Errors in Isotope Dilution Caused by Matrix-induced Mass Bias Effect
in Quadrupole Inductively Coupled Plasma-Mass Spectrometry
Yong-Nam Pak
Department of Chemistry Education, Korea National University of Education, Chung Buk 363-791, Korea E-mail: [email protected]
Received July 2, 2014, Accepted August 8, 2014
Matrix-induced mass bias and its effect on the accuracy of isotope ratio measurements have been examined for a quadrupole-based inductively coupled plasma-mass spectrometer (Q ICP-MS). Matrix-induced mass bias effect was directly proportional to % mass difference, and its magnitude varied for element and nebulizer flow rate. For a given element and conditions in a day, the effect was consistent. The isotope ratio of Cd106/Cd114 under 200 µg g−1 U matrix deviated from the natural value significantly by 3.5%. When Cd 111 and Cd114 were used for the quantification of Cd with isotope dilution (ID) method, the average of differences between the calculated and measured concentrations was −0.034% for samples without matrix (0.076 µg g−1 to 0.21 µg g−1 for the period of 6 months). However, the error was as large as 1.5% for samples with 200 µg g−1 U. The error in ID caused by matrix could be larger when larger mass difference isotopes are used.
Key Words : Mass bias, Matrix, Q ICPMS, Isotope ratio, Isotopic dilution
Introduction
Isotope Dilution is the most accurate analytical technique in quantitative analysis. The technique uses the measure-ment of two isotopes and can be applied to about 80% of the element in the periodic table. It has the advantages of correcting for the sample loss during the process of sample preparation, for the error caused by matrix, and for the instrument drift. ID uses the ratio of two isotopes instead of intensity so that any signal suppression or enhancement even by matrix should not effect on the accuracy.
Q ICP-MS is a powerful technique1,2 for quantitative analysis allowing the direct introduction of liquid samples for routine measurements. The technique has gained wide acceptance for elemental analysis. Furthermore, it is capable of isotope dilution3,4 and isotope ratio measurement which provides information useful in the areas of isotopic, geo-logical,5,6 and cosmic studies,7 bioanalytical applications8,9 and environmental monitoring.10 The precision of the ratio is typically 0.2-0.5% provided that signal is high and the major error source is only statistical one. Although it is higher than thermal ionization mass spectrometry (TIMS) and multi-collector (MC) MS, it is very useful for many applications. In short, Q ICP-MS has gained popularity and wide accep-tance due to its availability and convenience but needs to improve in precision.
There are several uncertainties in determination of accurate concentration using isotope ratios in Q ICP-MS. One of the largest and most complexing source of error in ICP-MS lies in the interface region. Uncertainty occurs when a prefer-ential selection of ions takes place during the process of ion extraction from the atmospheric plasma into the mass spectrometer vacuum. Mass bias11,12 occurs due to a simple nozzle effect whereby a lighter ion diffuses faster and a
space charge effect13-15 as ions of the same charge repel each other on their way through the system. Radial diffusion of ions occurred and lighter isotope is affected more severely. Both effects enhance heavier ionic species at the end. Ion lens voltage16 is a factor determining the extent of the space charge effect. Isotope ratios are further altered by the re-sidence time difference17 in quadrupole between heavy and light elements. In addition to the interface and mass spectro-meter, plasma conditions such as nebulizer flow rate18 can change the isotope ratio as well.
Along with instrumental and experimental conditions, the matrix of a sample can change the mass bias factor because ion flux characteristics of the analyte can be significantly altered by the ions generated from matrix. Matrix effects in ICPMS have been known and studied by many resear-chers19-22 and even for high resolution ICP-MS.17 More recent development for Multi-channel (MC) ICP/MS also showed mass bias effect, which was function of operating conditions such as sampling depth and carrier gas flow rate.12,19 Some studies have focused on the direct signal intensity changes20,21 and the others on the elucidation of the effect.22-24 Mostly, ion suppression was observed but signal enhancement22 was reported as well and the magnitude was different greatly with each other. Generally, it was shown that the greater the mass and ionization potential of the analyte, the lower was the suppression by the matrix. Also, the matrix effect was instrument specific and strongly depended on experimental conditions. Simple ion-atom equilibrium shift was ruled out as a likely mechanism and space charge has been the most successful in explaining the matrix effect.
At first, it could be thought that ID should provide accurate results for any samples even under complex matrix. Though ID technique can eliminate uncertainties from the plasma source, it is not free from the error caused at the
interface or inside the mass spectrometer where preferential selection of an isotope could occur due to matrix. Since the accuracy of ID is dependent upon the accuracy of isotope ratio measurement, it will hinge on the control and correc-tion for matrix-induced mass bias effect. To overcome this bias effect, matrix elemination25 or an internal standard was employed26 as well as matrix matched method27 in Q ICP-MS. However, not many studies have been devoted deeply enough to elucidate the nature of the bias nor to quantify the degree of matrix-induced mass bias effect. The object of this research is to study the nature of matrix-induced mass bias effect extensively as well as to quantify the degree of this effect on the measurements of Cd concentrations.
Experimental Section
Reagent. Samples, typically 0.1 μg g−1 to 0.2 μg g−1 Cd, were prepared from 10,000 μg g−1 stock solutions by weigh-ing out a necessary amount and diluted with a 1.5% (v/v) nitric solution (Optima, Fisher, PA) by successive dilution. Other samples, Mg, Ti, and Zn prepared from 1,000 μg g−1 stock solutions were selected to cover a broad mass range. Heavy element such as U or Pb was chosen as a matrix to produce a large mass bias effect. Water purified with a Milli-Q system (Millipore, Bedford, MA) was used throughout the experiment. Spike Cd111 solution was prepared by dissolv-ing enriched Cd111 (Oak Ridge, CA) isotope standard. All solutions and spikes were prepared by mass dilution in polyethylene bottles thus eliminating glass wares for the volumetric measurements. The advantages are that there is no need for the washing/cleaning of glass wares as well as providing higher accuracy.
Procedure. The instrument used in this study was Elan 5000 (PE Sciex, CT). For 0.1 μg g−1 Cd solution, around 200,000 cps (count per second) was detected for Cd114. After the plasma was ignited, the instrument was allowed to stabilize for about an hour. Data were taken in the peak-hopping mode and the detailed conditions are listed in Table 1. To minimize drift change between isotopes, a short
dwell time (30 ms) was used along with many sweep number and replicates to provide high signals. The total time of measurement (50 replicate) for a given m/z was 150 s and 300 s for a pair of isotopes. The wash time between the samples was 2 minutes. For more rigorous condition, the wash time could be prolonged to 30 minutes. The operating conditions for gas flow rates, plasma power, and other variables were a typical set for ICP/MS as shown in Table 1. Only one element in each sample was prepared to eliminate any possibilities of spectroscopic interference. Samples with and without matrices were run alternatively several times to reduce memory effect and to correct any drift of signals. Q ICP/MS typically shows about 5% drift of signal within couple of hours. To correct for the drift, Salit and Turk method28 was applied. The advantage of this method was that no reference solutions were required but samples them-selves served only to correct for the drift.
Heavy metal matrix of 200 μg g−1 U or 400 μg g−1 Pb were used as a matrix, which gave about a 50% suppression, a level that was appropriate to observe proper matrix inter-ference. The Cd concentration for a sample with matrix was increased to give approximately the same counts, typically 300,000 cps for Cd 114, to avoid difference in dead time correction uncertainties. The theoretical limitation of error for this level of signal was around 0.2% (100 × √3 × 10⁶/ 3 × 10⁶) if the error was limited by the statistical error only. This procedure also reduced susceptibility to background noise and other uncertainty associated with small signal measurement. The matrix solutions were examined separate-ly to assure the absence of spectral interferences in the analyte mass range.
Results and Discussion
Isotopic Ratio Change by Matrix. Figure 1 illustrates the case of matrix reduced mass bias in the measurement of Cd by Q ICP-MS. It shows that the lighter isotope was lost preferentially due to matrix as expected. Other elements, such as Zn, Ti and Mg also showed vivid isotopic ratio changes for samples with and without matrix. The magni-tude of the mass bias effect will be reported in delta units where Δ is defined as the relative difference between the natural and measured isotope ratios..
Δ% = ×
If there is a matrix of heavy element, it will preferentially scatter a light isotope than a heavy one when they travel along the ion trajectory inside the mass spectrometer. Both isotopes are deviated from the main ion flux due to the same charge of matrix but the effect is more significant to the lighter isotope than a heavier one. Therefore, if the mass difference is larger for a pair of isotopes, the effect will be
light isotope heavy isotope
---⎝ ⎠
⎛ ⎞natural light isotope
heavy isotope ---⎝ ⎠ ⎛ ⎞measured – × 100 light isotope heavy isotope ---⎝ ⎠ ⎛ ⎞natural
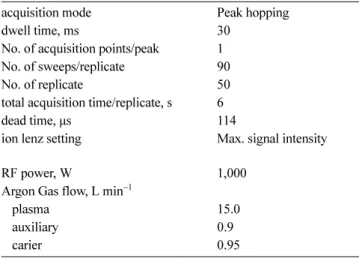
---Table 1. Instrumental conditions and measurement parameters used for Q ICP/MS
acquisition mode Peak hopping dwell time, ms 30
No. of acquisition points/peak 1 No. of sweeps/replicate 90 No. of replicate 50 total acquisition time/replicate, s 6 dead time, µs 114
ion lenz setting Max. signal intensity
RF power, W 1,000 Argon Gas flow, L min−1
plasma 15.0
auxiliary 0.9
even more significant. % mass difference is defined as a relative mass difference between the two isotopes measured. For example, for Cd110 and Cd114, it is 100% × (114-110)/ 112. The isotope ratio is expected to decrease for a sample under the heavier matrix. In other words, Δ is expected to show a positive value and an increase with the concentration of matrix
Isotopic ratio changes due to matrix were plotted against % mass difference in Figure 2. The magnitude of Δ increases with % mass difference for all elements, whether Δ is positive or negative, and appears to be proportional to the mass difference. At a given experimental condition, this observa-tion has been consistent throughout the experiment.
How-ever, the magnitude and sign of Δ varies for different ele-ments. It can be postulated that the ion trajectory is different for the different element and consequently, the matrix ions influence on elements differently to give different magnitude of Δ.
The sign of Δ can be positive or negative from element to element. Similar type of behavior was also observed earlier in this laboratory for the same instrument. Theories such as nozzle effect and space charge effect predict that lighter isotope is preferentially lost, which means Δ should be positive for all elements. However, negative Δ was observed in this experiment also. Different behaviors of mass bias effect was also observed by Houk.29 Ion density behind the skimmer was measured by depositing ions on an array of graphite and it was shown that elements behave differently even for the same lens setting. Under 1,000 μg g−1 Cs, Scandium showed decrease in intensity while Y showed increase ion flux. Addition of matrix ion could focus or defocus ion beams to change the path of sample ion flux. Exact changes to signals depend on the lens setting18 and plasma conditions.17 Consequently, the sign of mass bias effect, Δ, may vary from an instrumental setting to another.
Figure 1. Change of isotope ratio Cd 110/Cd114 under 200 μg g−1
U matrix. Carrier gas flow rate was 0.9 L min−1. Sample with and without matrix was run alternatively.
Figure 2. Mass bias effect induced by 200 μg g−1 U matrix as a
function of % mass difference for several elements. The magni-tude and sign of Δ is consistent in a day at a fixed experimental condition but can be changing from day-to-day experiments.
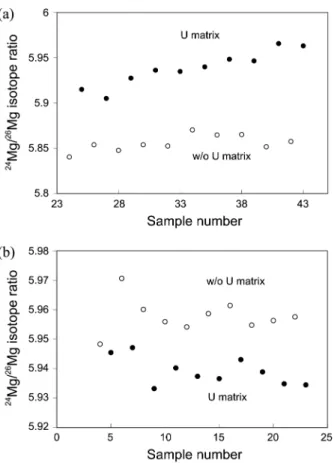
Figure 3. (a) Isotope ratio change of Cd 110/114 under 200 μg g−1
U matrix at several nebulizer flow rates. Empty symbols are without matrix and closed ones are matrix added. (b) The % isotope ratio change due to a matrix, Δ, with nebulizer flow rate for Cd. As nebulizer gas flow rate increases, generally matrix induced mass bias effect decreases except at 0.95 L min−1 where ion flux is maximum. Cd116 was not used because of high background from doubly charged U232.
Nebulizer Gas Flow Rate Study. Δ can be changed greatly by the nebulizer flow rate. Isotope ratio changes of Cd 110/Cd114 with the nebulizer flow rate are shown in Figure 3(a). For the range of 0.85 L min−1 to 0.95 L min−1, the ratio did not show much change for the sample without matrix while it should decrease for the one with matrix. The decrease was due to U matrix ions and the magnitude was the largest at 0.95 L min−1 when the intensity, and ion flux, was the highest. At 1.0 L min−1, another effect played an
important role to show the ratio without matrix changed sharply. When it was applied for other isotope pairs, shown in Figure 3(b) as Δ changed with the flow, they showed similar behaviors. Also, Δ was larger for a large mass differ-ence as expected. Another feature to be noticed was that the Δ differences between the pairs were getting smaller at higher flow. The same study was performed for Mg and shown in Figure 4. The nebulizer flow was varied from 0.8 L min−1 to 1.1 L min−1. The magnitude of matrix-induced mass bias effect was the largest at 0.9 L min−1, where signal intensity (matrix ion flux was the largest) was the highest. The differ-ence between Mg24/Mg26 and Mg25/Mg26 was smaller when the flow was increased. Ions gain kinetic momentum at higher flows and will be less influenced by nozzle effect.
Closer examinations of Δ revealed that it is the function of carrier gas flow rate. In Figure 5(a) and 5(b), the isotopic ratio changes for Mg24/Mg26 were shown with the flow rate. The magnitude and even the direction of the isotopic ratio change could be varied depending on the carrier gas flow rate. This was further examined for Zn in detail and shown in Figure 6. When the flow was increased the differ-ence became even obscure. The magnitude and direction of
Figure 4. The % isotope ratio change due to a matrix, Δ, with nebulizer gas flow rate for Mg. Δ is the largest at 0.90 L min−1 where ion flux and matrix ion flux are highest.
Figure 5. (a) Change of isotope ratio Mg 24/26 under 200 μg g−1 U
matrix at nebulizer gas flow rate of 0.90 L min−1. Open circle is without U and closed one is matrix added. Drift was not corrected. (b) Change of isotope ratio Mg 24/26 under 200 μg g−1 U matrix at nebulizer gas flow rate of 0.95 L min−1. Notice that the ratios are reversed.
Figure 6. Change of Zn isotope ratios with nebulizer gas flow rate. Open legend is without U matrix and closed one is matrix added. Circle is for 0.90 L min−1 and square is 0.95 L min−1. Nebulizer gas flow rate can change the isotope ratio differences. The effect is much more significant for the samples with matrix.
matrix-induced mass bias effect showed dependence on nebulizer flow rate as well as element. It has been well known that nebulizer flow rate can change plasma characteristics significantly. Because of this reason, the mount plot was more favored than a fixed flow study.19 Rodushkin17 used a double-focusing sector ICPMS to study the sea-water matrix effect. From the mount, it was found that the matrix caused the shift, of which magnitude and direction depended on elements and operating conditions.
The fact that Δ can be changed from positive to negative means matrix-induced mass bias effect is a very sensitive function of plasma and mass spectrometer conditions. Vanhaecke et al.24 observed VG Plasma Quad PQ1 and they suggested that the non-spectroscopic effect was the shift of a zone of maximum M+ density, which depended on mass and matrix. This zone model can partly explain how the flow affects matrix-induced mass bias effect. Variation of nebulizer flow can change several parameters including the shift of sampling position relative to the sampler. In turn, the ratio of matrix to argon ion as well as matrix to sample ions would be changed and consequently the degree of matrix-induced mass bias effect could be different. Especially when their ionization energy is different from each other, the difference will be amplified by the flow change. However, this model has a limitation that it can be explain only the changes in magnitude of matrix-induced mass bias effect but not the sign. From the isotope ratio change with the flow, it can be assumed that the flow rate change caused more than inter-element equilibrium shift in the plasma but beyond to the expansion stage. Higher sample gas flow can “cool” plasma thus reducing ion flux to lessen the space charge effect caused by the matrix.
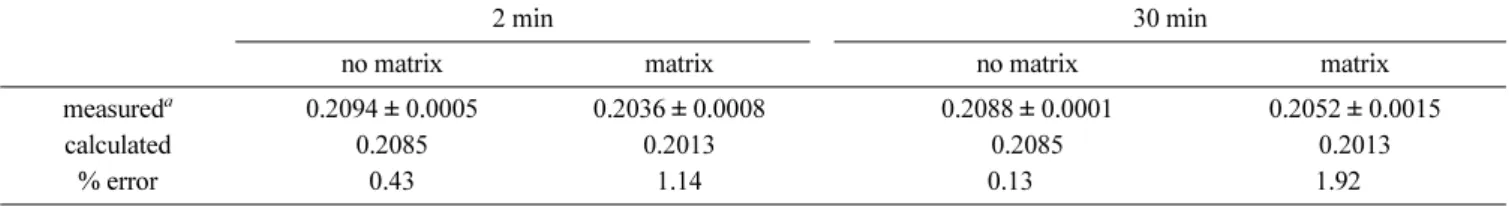
Memory Effect. Under the same experimental conditions, samples were run with different introduction intervals of 2 and 30 minutes. Samples (0.2085 μg g−1) were prepared in the lab and the concentrations were examined for accuracy. The final concentrations were different from 30 minutes to 2 minutes intervals as shown in Table 2. Sample without matrix for 2 min interval showed 0.43% error, which is significantly larger than 0.13% for 30 min interval suggesting that it was affected by the previous sample. No direct memory was observed i.e., Cd and matrix intensities became almost zero after 2 minutes waiting. However, for samples under U matrix, the extension of interval to 30 min did not show any improvement. For a sample under heavy matrix, the errors with ID method were significant (1.14% and 1.92%) regard-less of the interval.
Matrix as well as sample can be deposited on the sampling and skimmer cones and could be re-evaporated.29 Such deposition may induce isotopic change in sample. It could be concluded that a change of conditions due to the previous matrix was more suspected than a simple memory effect. It could take a longer time to re-equilibrate disturbed analyte ion beam trajectory than a simple depletion of increase of ion flux. For longer than 5 minutes of interval, no such memory effect was observed.
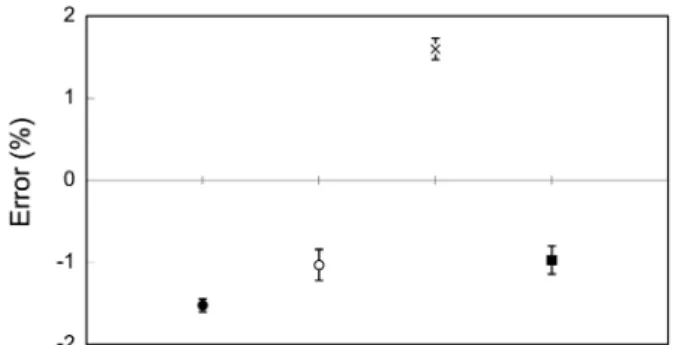
Quantitative Aspect of Matrix-induced Mass Bias Effect on ID. Cd was selected to study matrix-induced mass bias effect in quantitative isotope dilution because it gave the largest reproducible Δ. Ranges of 0.076 to 0.21 μg g−1 of Cd sample solutions with and without matrix were studied at different days. In case of samples without matrix, the error magnitudes in quantitative measurement with ID were between −0.21% and 0.13% while the average was −0.034% as shown in Figure 7. The results were in excellent agree-ment with the calculated concentrations. For a simple sample, Q-ICPMS could provide an accurate result with ID techni-que. However, when a matrix present, matrix-induced mass bias effect could cause more than 1.5% errors in the final concentration even with ID technique. Figure 8 shows the degree of matrix-induced mass bias effect under 200 μg g−1 U matrix. The experiments were performed on different dates. The errors or differences are as large as 1.5% and no sample shows accurate result. Mass bias due to matrix is significant and must be corrected for the accurate deter-mination of concentration even in ID method.
Interestingly, the error can be roughly estimated from Figure 2 for any isotope pairs used. The amount of isotope
Table 2. Memory effect and % error in ID by matrix induced mass bias effect for Cd under 200 μg g−1 U matrix
2 min 30 min
no matrix matrix no matrix matrix
measureda 0.2094 ± 0.0005 0.2036 ± 0.0008 0.2088 ± 0.0001 0.2052 ± 0.0015
calculated 0.2085 0.2013 0.2085 0.2013
% error 0.43 1.14 0.13 1.92
an = 7 replicates
Figure 7. Error magnitude of ID for Cd samples without matrix. The first one (−) represents average and the other 6 sets ( × ) refer to experiments carried out on different days for the period of 6 months. The sample concentration was from 0.7 μg g−1 to 2.1 μg g−1. The error bar represents one standard deviation for 4 measurements.
ratio change, Δ, is read and used for the calculation of concentration error. For example, Δ for Cd111/Cd114 pair was found as 1.1%, which predicted −2.0% error magni-tudes while the measured one was −1.5%. It could also offer a rough estimate of error magnitude for other elements by comparing the response curves of Δ with % mass difference. For example, since the slope of Mg is approximately half of Cd, the error of Mg will be about half for the same % mass difference providing all the other conditions are the same.
Space charge effect has been successful in explaining mass bias effect. Heavy matrix ions are less likely to be affected by Columbic repulsion force. Consequently, heavy elements with low ionization potential matrix would give larger errors than low mass with high ionization matrix in quantitative measurements. However, lighter mass of matrix, such as Na, can also affect the sample ion paths if its ion density is high enough. Our preliminary study indicates that Na could cause deviation of few % as well. Other researcher17 also observed that light matrix could cause isotopic ratio changes. Basical-ly, any disturbance in ion flux should cause matrix-induced mass bias effect.
Consistency of Matrix-induced Mass Bias Effect. The error magnitudes caused by matrix-induced mass bias were significant and could be shifting from day-to-day runs. In Figure 8, the error showed different sign on a different date. For a given set of conditions within a day running, the iso-topic ratio and consequently, concentration obtained showed good precision. Notice that the error bar in Figure 8 is very small. However, even the same sample on a different date could give different values. Once a condition was changed, return to the original setting could not guarantee the same data which suggests that there are some conditions hard to be controlled. Slight changes of these delicate conditions could affect the result quite modestly. In this respect, equilib-rating or settling down the initial conditions of the system could be important in a matrix study. Gregorie29 has observed “sensitization” effect in that a conditioning with a sample at the beginning of the experiment could give more repro-ducible data. Once the condition is settled, the system may behave consistently until it is disturbed.
The Nature of Matrix-induced Mass Bias Effect. Several researchers pointed out that ionization equilibrium shift,23
ambipolar diffusion,30 extraction processes at the sampler and skimmer,31 and the ion lens18 are important parameters in understanding the accurate matrix effect. Observation of isotope pairs should minimize any changes in the plasma yet large fluctuations caused by matrix indicates that the inter-face as well as Q-pole may be more responsible. Since the ion flux in Q-pole is much lower than the skimmer region, the extraction process at around the skimmer seems to be the most responsible in causing the fluctuation mass bias effect caused by matrix. Consequently, total ion flux and ion trajectories as well as ion lens become very important in determining the accurate isotopic ratios because any small changes in deflection angle at the skimmer region can result in very different ion focusing and changed signals. Distur-bance by the matrix ions on sample ion trajectories can either favor or hinder the detection of lighter isotopes depending on particular ion optics setting.18 Thus, recent development of collision cell would make the matrix effects more complex due to space charge and kinetic effects occurring inside the cell.32
In summary, the state of the first expansion stage and space charge effect around the skimmer must be very critical in determining precise isotope ratio. Matrix ions can alter the ion flux characteristics to change space charge and ion trajectories so as to fractionate isotope. The magnitude and consistency of matrix-induced mass bias effect will depend on parameters such as sample gas flow, ion lens setting, and anything that can influence on ion flux near the skimmer. Since this effect would give errors even in ID method, it is recommended to eliminate or correct for the matrix for a precise determination of concentration.
Conclusion
The study shows that matrix induces interference on mass bias effect to give errors even with ID technique. The degree of interference depended on matrix and experimental conditions. U and Pb matrix and possibly light matrix of Na also interfered on the isotopic ratio. The magnitude of matrix-induced mass bias effect, Δ, was directly propor-tional to the mass difference and its value and direction were consistent at a given experimental conditions in a run. The extent and sign of Δ could be different from one element to another. Even for a given element, Δ could be changing with experimental conditions and more surprisingly, day-to-day runs. The fact that matrix-induced mass bias effect was sensitive and not reproducible from day to day suggested that the initial conditions might be important as well. The disturbance in ion flux rather than the direct change of ion flux seemed more responsible to matrix-induced mass bias effect. The results agreed with other reports that the space charge effect near the skimmer was important in determining isotopic ratio.
Under 200 μg g−1 U (or 400 μg g−1 Pb), where intensity was reduced by 50%, mass bias caused by matrix resulted about 1.5% error in quantitative determination of Cd when 111 and 114 isotopes are used. A proper correction must be
Figure 8. Error magnitude of ID for Cd samples under 200 μg g−1
U matrix on different days. The error caused by matrix is significant and give inaccurate results. The error bar represents one standard deviation for 4 measurements.
applied to compensate for each sample of different matrix or by using matrix matched standards, which is currently under investigation.
Acknowledgments. The author deeply appreciates Dr. Li Yu for the inception of the idea and Dr. Fassett in NIST (national Institute of Standard and Technology) for the valuable discussion of this research. Publication cost of this paper was supported by the Korean Chemical Society.
References
1. Houk, R. S.; Fassel, V. A.; Flesh, G. D.; Svec, H. J.; Gray, A. L.; Taylor, C. E. Anal. Chem. 1980, 52, 2283-2290.
2. Houk, R. S.; Fassel, V. A.; Svec, H. J. Dyn. Mass. Spectrom. 1981, 6, 234.
3. Bievre, P. De Tech. Instrum. Anal. Chem. 1994, 15, 169-183. 4. Javis, K. E.; Grya, A. L.; Houk, R. S. Handbook of Inductively
Coupled Plasma Mass Sepctrometry, Chapter 11, Blackie, NY, 1992.
5. Hoefs, J. Stable Isotope Geochemistry; Springer: Berlin, 1987. 6. Palesskii, S. V.; Nikolaeva, I. V.; Koz’menko, O. A.; Anoshin, G.
N. J. of Anal. Chem. 2009, 64(3), 272-276.
7. Shima, M. Geochim. Cosmochim. Acta 1986, 50, 577-584. 8. Bettmer, J. Analytical and Bioanalytical Chemistry 2010, 397(8),
3495-3502.
9. Cavalheiro, J.; Preud'homme, H.; Amouroux, D.; Tessier, E.; Monperrus, M. Anal. & Bioanal. Chem. 2014, 406(4), 1253-1260. 10. Atkinson, N. R.; Bailey, E. H.; Tye, M.; Breward, N.; Young, S. D.
Environmental Chemistry 2011, 8(5), 493-500.
11. Ross, B. S.; Hieftje, G. M. Spectrochim. Acta 1991, 46B, 1263-1275.
12. Fontain, G. H.; Hattendorf, B.; Bourdon, B; Gunther, D. J. Anal.
Atom. Spectrom. 2009, 24, 637-648.
13. Martin, L. In ICP Mass Spectrometry Handbook, 1st ed.; Nelms, S., Ed.; Blackwell Publishing Ltd: Oxford, UK, 2005; ch. 1. 14. Gilson, G. R.; Douglas, D. J.; Furford, J. E.; Halligan, K. W.;
Tanners, S. D. Anal. Chem. 1988, 60, 1472-1479.
15. Praphairaksit, N.; Houk, R. S. Anal. Chem. 2000, 72, 4435-4440. 16. Krupp, E. A.; Donard, O. F. X. Int. J. Mass Spectrom. 2005, 242,
233-241.
17. Roudushkin, I. J. Anal. Atom. Spectrom. 1998, 13, 159-166. 18. Heumann, K. G.; Gallus, S. M.; Radlinger, G.; Vogl, J. J. Anal.
Atom. Spectrom. 1998, 13, 1001-1009.
19. Agatemor, C; Beauchemin, D. Anal. Chim. Acta 2011, 706, 66-83. 20. Tan, A. H.; Horlich, G. J. Anal. Atom. Spectrom. 1987, 2, 745-754. 21. Feng, L.; Wang, J.; Chao, J.; Lu, H. J. Anal. At. Spectrom. 2009,
24, 1676-1680.
22. Crain, J. S.; Houk, R. S.; Smith, F. G. Spectrochim. Acta Part B 1988, 43B, 1355-1364.
23. Tanner, S. D. J. Anal. Atom. Spectrom. 1995, 10, 905-911. 24. Vanheacke, F.; Dams, R.; Vandecasteele, C. J. Anal. Atom. Spectrom.
1993, 8, 433-440.
25. Sambuddha Misra; Philip N. Froelich J. Anal. At. Spectrom. 2009, 24, 1524-1533.
26. Poirier, A.; Doucelance, R. Geostandards and Geoanal. Research 2009, 33(2), 195-204.
27. Hughes, H. J.; Delvigne, C.; Korntheuer, M.; De Jong, J.; André, L.; Cardinal, D. J. Anal. Atom. Spectrom. 2011, 26, 1892-1896. 28. Salit, M. L.; Turk, G. C. Anal. Chem. 1998, 70, 3184-3189. 29. Gregorie, D. C. Spectrochim. Acta 1987, 42B, 895-904.
30. Douglas, D. J.; Kerr, L. A. J. Anal. At. Spectrom. 1988, 3, 749-752. 31. Jarvis, K. E.; Gray, A. L.; Houk, R. S. Handbook of Inductively
Coupled Plasma Mass Spectrometry; Chapter 2, Blackie, NY, 1992; p 36.
32. Stuerup, S.; Bendahl, L.; Gammelgaard, B. J. Anal. At. Spectrom. 2006, 21, 297-304.