The role of T cell Immunoglobulin Mucin
domain in Herpes simplex virus-induced
Beh
çet’s Disease mouse model
by
Ju A Shim
Major in Molecular Medicine
Department of Biomedical Sciences
The Graduate School, Ajou University
The role of T cell Immunoglobulin Mucin
domain in Herpes Simplex Virus-induced
Beh
çet’s Disease mouse model
by
Ju A Shim
A Dissertation Submitted to The Graduate School of
Ajou University in Partial Fulfillment of the Requirements
for the Degree of
Ph.D of Biomedical Sciences
Supervised by
SeongHyang Sohn, Ph.D.
Major in Molecular Medicine
Department of Biomedical Sciences
The Graduate School, Ajou University
This certifies that the dissertation
of Ju A Shim is approved.
SUPERVISORY COMMITTEE
Seong Hyang Sohn
Eun-So Lee
Sun Park
DongSik Bang
KyungSook Park
The Graduate School, Ajou University
December, 28th, 2012
i
- ABSTRACT –
The role of T cell Immunoglobulin Mucin domain in Herpes simplex
virus-induced Behçet’s Disease mouse model
The T cell immunoglobulin mucin (TIM) proteins regulate T cell activation and tolerance. Individual TIM family members may serve as susceptibility markers for asthma, allergies and autoimmune diseases, as well as potential cell surface markers for T helper type (Th)1 and Th2 T cells. TIM-1 plays an important role in the regulation of immune responses and the development of autoimmune diseases. TIM-4 is a natural ligand of TIM-1, and interaction of TIM-1 and TIM-4 is involved in the regulation of Th cell responses and the modulation of the Th1/Th2 cytokines balance. TIM-4 expression was increased in patients with systemic lupus erythematosus (SLE). It has been also reported that TIM-3 expression was higher in patients with rheumatoid arthritis compared to controls. Further, Galectin-9 (Gal-9) has been identified as a TIM-3 ligand (L) and the TIM-3-TIM-3L interaction serves as a specific down-regulator of the Th1 immune response.
Behçet’s disease (BD) is a chronic, multisystemic inflammatory disorder with arthritic, gastrointestinal, mucocutaneous, ocular, vascular, and central nervous system involvement. In herpes simplex virus induced BD mouse model, the expression of Tim-1 and Gal-9 was lower levels compared to asymptomatic BD normal (BDN) mice. The expression of Tim-3 and Tim-4 was higher in BD mice than BDN mice. In addition, Tim-1 vector injected BD mice showed changes of BD-like symptoms and decreased the severity score.
ii
Again, treatment with Tim-4 siRNA also improved the BD-like symptoms and decreased the severity score accompanied with up-regulation of regulatory T cells (Treg). Furthermore, administration of Gal-9 improved the BD-like symptoms, decreased the severity score, and increased Treg cells. In addition, Gal-9 induced improvement was associated with down-regulation of pro-inflammatory cytokines and induction of apoptosis.
In the present study, we showed that the regulation of Tim-1 or Tim-4 affected the BD-like symptoms and Tim-3-Tim-3L interaction improved the inflammatory symptoms in BD mice.
Key words: Tim-1, Tim-3, Tim-4, Galectin-9, Herpes simplex virus-induced systemic inflammation, Behçet’s Disease mouse model
iii
TABLE OF CONTENTS
ABSTRACT ··· ⅰ TABLE OF CONTENTS ··· ⅲ LIST OF FIGURES ··· ⅴ LIST OF TABLES ··· ⅶ Ⅰ. INTRODUCTION ··· 1Ⅱ. MATERIALS AND METHODS ··· 4
A. Antibodies and reagents ··· 4
B. Animal experiments ··· 4
C. BD-like symptoms ··· 5
D. Tim-1 DNA constructs ··· 5
E. Preparation of Tim-4 small interfering RNA (siRNA) ··· 6
F. Tim-1 vector and Tim-4 siRNA administration to BD mice ··· 6
G. Gal-9 administration to BD mice ··· 6
H. Flow cytometry ··· 6
I. Enzyme-linked immunosorbent assay (ELISA) ··· 7
J. Transmission electron microscopy (TEM) ··· 7
K. Statistical analysis ··· 8
Ⅲ. RESULTS ··· 9
A. The frequencies of Tim-1 and Tim-4 expressing cells in normal healthy, BDN and BD mice ··· 9
iv
B. The expression of Tim-3 and Gal-9 in BD mice ··· 14
C. Administration of Tim-1 vector up-regulates the frequency of Tim-1(+) cells in vivo lymph nodes ··· 16
D. Administration of Tim-1 vector affected the BD-like symptoms ··· 18
E. Tim-1 vector administration affected the regulatory cellular phenotypes ··· 24
F. Pro-inflammatory cytokines were down-regulated by Tim-1 vector administration in BD mice ··· 26
G. Tim-4 siRNA treatment down-regulated the expression of Tim-4 in normal healthy mice ··· 28
H. Administration of siTim-4 changed BD-like symptoms ··· 30
I. Treg cells were up-regulated in siTim-4 treated BD mice ··· 35
J. Treatment with siTim-4 decreased the serum level of IL-17 in BD mice ··· 37
K. Gal-9 treatment up-regulated the expression of Gal-9 in vitro and in vivo ··· 39
L. Gal-9 administration improved BD-like symptoms ··· 41
M. Gal-9 induced the expression of cell death-related molecules in BD mice ··· 43
N. Gal-9 modulated the cell population in BD mice ··· 47
O. Gal-9 regulated cytokine expression in BD mice ··· 49
Ⅳ. DISCUSSION ··· 51
Ⅴ. CONCLUSION ··· 57
REFERENCES ··· 58
v
LIST OF FIGURES
Fig. 1. The frequencies of Tim-1(+) cell phenotypes in normal healthy, BDN and BD mice ··· 12 Fig. 2. The frequencies of Tim-4(+) cell phenotypes in normal healthy, BDN and BD
mice ··· 13 Fig. 3. Expression of Tim-3 and Gal-9 in BD mice ··· 15 Fig. 4. Administration of Tim-1 vector increased the frequency of Tim-1(+) cells ··· 17 Fig. 5. Administration of Tim-1 improved the BD-like symptoms, but the frequencies
of Tim-1 expressing cells were not changed ··· 21 Fig. 6. The frequencies of Treg cells in PBMC were affected in Tim-1 vector injected
BD mice ··· 25 Fig. 7. Tim-1 vector administration decreased pro-inflammatory cytokines in BD mice
··· 27 Fig. 8. The expression of Tim-4(+) cells was down-regulated after siTim-4
treatment ··· 29 Fig. 9. BD-like symptoms were changed after siTim-4 administration ··· 32 Fig. 10. The frequencies of Treg cells were up-regulated after treatment with siTim-4
in BD mice ··· 36 Fig. 11. Administration of siTim-4 decreased the serum level of IL-17 in BD mice ···· 38 Fig. 12. Gal-9 treatment increased the expression of Gal-9 in vitro and in vivo ··· 40 Fig. 13. Gal-9 treatment improved BD-like symptoms ··· 42
vi
Fig. 14. Gal-9 treatment increased the expression of cell death-related molecules in BD mice ··· 46 Fig. 15. Gal-9 treatment affected the expression of several cell types in BD mice ··· 48 Fig. 16. Gal-9 treatment regulated pro-inflammatory cytokines in BD mice ··· 50
vii
LIST OF TABLES
Table 1. The change of BD-like symptoms after Tim-1 and control vector administration ··· 22 Table 2. The change of BD-like symptoms in siTim-4 administered BD mice ··· 33
- 1 -
І. INTRODUCTION
The T cell immunoglobulin and mucin domain (TIM) family is located on chromosome 11B1.1 in mice and consists of several members (Tim-1~8). In human it is located on chromosome 5q33.2 and consists of three members (TIM-1, 3 and 4) (Kuchroo et al., 2003). Individual TIM family members may serve as susceptibility markers for asthma, allergies and autoimmune diseases, as well as potential cell surface markers for T helper type (Th) 1 and Th2 T cells (Kuchroo et al., 2003; Meyers et al., 2005b). Therefore, human TIM gene family is critical to Th1/Th2 mediated immunological regulation (Meyers et al., 2005b). TIM-1 was first identified as a hepatitis A virus cellular receptor 1 (Kaplan et al., 1996; Feigelstock et al., 1998) and a kidney injury molecule, KIM-1 (Han et al., 2002; Ichimura et al., 1998). TIM-1 is expressed on CD4+ T cells after activation and its expression is sustained preferentially in Th2 but not Th1 cells (Kuchroo et al., 2003; Meyers et al., 2005a). TIM-1 plays an important role in the regulation of immune responses and the development of autoimmune disease. The high-avidity anti-Tim-1 antibody enhances the severity of experimental autoimmune encephalitis (EAE) by increasing autopathogenic Th1 and Th17 responses, whereas the low-avidity antibody inhibits autopathogenic Th1 and Th17 responses (Umestu et al., 2005).
TIM-4 is a natural ligand of TIM-1 (Meyers et al., 2005a) and exclusively expressed on antigen-presenting cells (APCs), including dendritic cells (DCs) and macrophages (Rodriguez-Manzanet et al., 2008; Mizui et al., 2008), where it mediates phagocytosis of apoptotic cells and plays an important role in maintaining tolerance
- 2 -
(Kobayashi et al., 2007; Miyanishi et al., 2007). Interaction of TIM-1 and TIM-4 is involved in the regulation of Th cell responses and the modulation of the Th1/Th2 cytokines balance (Meyers et al., 2005a). DCs-derived TIM-4 maintains TIM-1 in Th2 cells in a stable status that plays a critical role in sustaining the Th2 polarization (Zhao et al., 2010). Recent report demonstrated that TIM-4 binding to TIM-1 has different effects on T cell proliferation. A higher dose of Tim-4-Ig consistently led to an increase in T cell proliferation upon TCR ligation, whereas a lower concentration of Tim-4-Ig inhibited T cell proliferation (Meyers et al., 2005a). Human TIM-1 is also associated with other types of immune dysfunction, such as atopic dermatitis, allergy, rheumatoid arthritis, asthma and systemic lupus erythematosus (SLE) (Chae et al., 2003a; Chae et al., 2003b; Chae et al., 2005; Page et al., 2006; Wang et al., 2008), suggesting that Tim-1 may regulate immune responses. In addition, in patients with SLE, TIM-4 expression in PBMC was also increased (Zhao et al., 2010).
Galectin-9 (Gal-9) is a ligand for TIM-3. TIM-3 was identified as a Th1-specific marker and has been found on cytotoxic CD8+ T cells, Th17, regulatory T (Treg) cells, monocytes, DCs, mast cells, and microglia (Nakae et al., 2007; Monney et al., 2002; Cua et al., 2003; Anderson et al., 2007; Wang et al., 2007). The TIM-3-TIM-3 ligand (TIM-3-TIM-3L) interaction serves as a specific down-regulator of the Th1 immune response (Meyers et al., 2005b). Gal-9 was previously shown to ameliorate collagen-induced arthritis (Seki et al., 2007) as well as EAE (Zhu et al., 2005) by inducing apoptosis in synoviocytes, suppressing generation of Th17 cells, and up-regulating the induction of Treg cells (Seki et al., 2008). The expression of TIM-3 by PBMC isolated from BD patients increased compared with healthy control (Lee et al., 2012).
- 3 -
Behçet’s Disease (BD) is a Th1-polarized (Ilhan et al., 2008), chronic, multi-systemic inflammatory disorder with arthritis, gastrointestinal, mucocutaneous, ocular, vascular, and central nervous system involvement. This disease takes on a chronic course with periodic exacerbations and progressive deterioration (Shimizu, 1979). The etiology of BD is unclear; however, viral infection has long been postulated as one of the main factors. Ever since Hulusi Behçet first proposed a viral etiology (Behçet, 1937), his hypothesis has been verified by detection of virus in saliva (Lee et al., 1996b), intestinal ulcers (Lee et al., 1993), and genital ulcers (Bang et al., 1997; Lee et al., 1996a) of patients with BD. Subsequent to these findings, herpes simplex virus (HSV) inoculation of the earlobes of ICR mice resulted in the development of BD-like symptoms (Sohn et al., 1998). Manifestations in mice inoculated with HSV include multiple symptoms such as oral ulcers, genital ulcers, skin ulcers, eye symptoms, gastrointestinal ulcers, arthritis, and neural involvement, as well as skin crusting. The frequencies of these symptoms are similar to those of patients with BD (Kim et al., 1988).
TIM in BD has not been studied much until today. Therefore, we investigated that the expression of Tim in BD mouse model with BD-like symptoms. The expression of Tim-1 and Tim-4 was analyzed in BD mice and the change of BD-like symptoms by regulating the expression of Tim-1 or Tim-4. Furthermore, the changes of cellular phenotypes and cytokine levels on immune cells were confirmed after up-regulation of Tim-1 or down-regulation of Tim-4 in BD mice. In addition, we demonstrated that administration of Gal-9 up-regulated apoptosis, down-regulated pro-inflammatory cytokines, and improved the BD-like symptoms in mice.
- 4 -
Ⅱ
. MATERIALS AND METHODS
A. Antibodies and Reagents
Mouse anti-CD4, anti-CD44, anti-CD107a, anti-Tim-1, anti-Tim-3, anti-Tim-4, CD8a, CD122, CD34, CD11b, CD11c, CD25, CD86, anti-Gr-1 and anti-granzyme B antibodies, an anti-Foxp3 staining kit, and an Annexine V-FITC apoptosis detection kit were purchased from eBioscience (San Diego, CA). Anti-Gal-9 was purchased from R&D system (Minneapolis, MN).
B. Animal experiments
ICR male mice (4 to 5 weeks old) were infected with HSV type 1 (1x10⁶ pfu/mL, F
strain) grown in Vero cells as previously described (Sohn et al., 1998). We used anesthetic composed of a mixture of Zoletil (Virbac Lab, Carros, France) and Rompun (Bayer, Seoul, Korea). The ratio of Zoletil and Rompun was 1:4, and it was administered at a dose of 40 μL per mouse (Tiletamine 10 mg/kg, zolazepam 10 mg/kg, and xylazine hydrochloride 36 mg/kg) via intramuscular injection. Virus inoculation was conducted twice at a 10 day intervals, after which the animals were observed for 16 weeks. Animals were handled in accordance with a protocol approved by the animal care committee of Ajou University School of Medicine.
- 5 -
C. BD-like symptoms
Manifestations in mice after HSV inoculation involved multiple symptoms. Of the total number of HSV-injected mice, 15% developed BD-like symptoms. Disappearance of symptoms or a higher than 20% decrease in lesion size were classified as effective. Determination of the severity score of BD was followed by determination of the value of the BD activity index, as outlined in the BD Activity Form (www.behcet.ws/pdf/BehcetsDisease Activity-Form.pdf). Among the symptoms exhibited by patients, mouth ulceration, genital ulceration, erythema, skin pustules, skin ulceration, joints-arthritis, diarrhea, red eye (right, left), reduced vision (right, left), loss of balance, discoloration, and swelling of the face were selected and analyzed in the BD mouse model. The score of each symptom was one, and after the score was added up, the total was used to determine the severity score of BD.
D. Tim-1 DNA constructs
Tim-1 construct with an extracellular Flag epitope tag was generated (de Souza et
al., 2005). A cDNA clone containing the entire coding sequence of murine Tim-1 was provided from Prof. Lawrence P. Kane (University of Pittsburgh) Briefly, the ORF of Tim-1 (excluding the start codon and signal sequence) was amplified from this clone by PCR and ligated into a pCDEF3 expression plasmid (Wu et al., 1999). All DNA construct were verified by automated DNA sequencing. All plasmids used were purified by two passes through Endo-Free columns (Qiagen, Chatsworth, CA, USA) as described elsewhere (Ulker et al., 1990).
- 6 -
E. Preparation of Tim-4 small interfering RNA (siRNA)
Tim-4 siRNA (siTim-4) was synthesized from Genolution pharmaceuticals, Inc (Seoul, Korea). The synthesized sequences of Tim-4 siRNA was sense; 5'- CUA AAU CAC AUC AGA UCA ACA GCA GUU -3', anti-sense; 5'- CUG CUG UUG AUC UGA UGU GAU UUA GUU -3'. For injection into mice, the Tim-4 siRNA with transfection reagent jetPEI (PolyPlus-transfection, Llkirch, France) was used.
F. Tim-1 vector and Tim-4 siRNA administration to BD mice
For each mouse, 10 mg of Tim-1 vector was intraperitoneallly injected 4 times at 2 day intervals in BD mice, followed by observation for 2 weeks. Control was used empty vector, PCDEF3. For the down-regulation of Tim-4, 5 mg of siRNA Tim-4 was intraperitoneally injected 3 times at 2 day intervals in BD mice, followed by observation for 2 weeks. And scramble siRNA was used as negative control (N.C) (Genolution pharmaceuticals, Inc, Seoul, Korea).
G. Gal-9 administration to BD mice
For each mouse, 100 mg of Gal-9 was injected intraperitoneally five times at 3 days interval, followed by observation for 2 weeks. PBS was used as a control. Over the next two weeks, the severity score was compared with that of the vehicle control.
H. Flow cytometry
- 7 -
CD11c, CD25, CD34, CD44, CD122, Tim-1, Tim-3, Tim-4, Gr-1 and Gal-9) for 30 min at 4 °C in the dark. For the intracellular detection of Foxp3 and granzyme B, an anti-mouse Foxp3-staining buffer set was used according to the manufacturer's instructions. Briefly, cells were fixed using Fix/perm buffer after washing with 1X permeabilization buffer and then incubated with anti-mouse forkhead box p3 (Foxp3) and granzyme B antibodies. For staining of CD107a, brefeldin A (Sigma, st. Louis, MO, USA) was added to the incubation media for 5 h, after which the intracellular staining protocol was carried out according to the manufacturer's instructions. Stained cells were analyzed by a flow cytometer (FACS canto II; Becton Dickinson, Franklin Lakes, NJ, USA) with ≥10,000 gated lymphocytes.
I. Enzyme linked immunosorbent assay (ELISA)
Tim-1 vector, Tim-4 siRNA, and Gal-9 were injected into BD mice, and 14 days
after the first administration, serum was collected. Serum was analyzed using commercial ELISA kits for the detection of mouse IL-6 (R&D system, Minneapolis, MN), TNF-a (R&D system), IL-17 (R&D system), IL-4 (R&D system), and IFN-γ (R&D system), according to the manufacturer’s instructions. The ELISA reader was Bio-Rad model 170-6850 microplate reader, and samples were read at a wavelength of 450 nm.
J. Transmission electron microscopy (TEM)
Gal-9 was injected into BD mice, and 14 days after first administration, peripheral blood was collected. After RBC lysis, blood cells were fixed with fixative solution [2% glutaraldehyde and 1% paraformaldehyde in 0.1M sodium cacodylate buffer (pH 7.4)] under
- 8 -
a fume hood and washed with 0.1M cacodylate buffer for 5 minutes at 3 times. Again the cells were fixed with 1% Osmium tetroxide for 30 min and washed with 0.1M cacodylate buffer for 5 min at 3 times. Then, cells were dehydrated by replacement of ascending series of ethanol (30, 40, 50, 60, 70, 80, 90, 95 and 100%) for 5 min in every step. During infiltration process, the cells were treated with a mixture of Epon and ethanol (1:2 for 30 min, 1:1 for 60 min, 2:1 for 90 min) and with Epon alone for overnight. To prepare “Epon block”, cells were incubated at 60 °C for 2 days. Further, the cells were sectioned (70-90 nm) with an ultramicrotome (Reichert ultracut S, Leica Microsystems, Wetzlar, Germany) and place on copper grids and double stained with uranly acetate for 10 min and lead citrate for 2 min. Finally the cellular ultrastructural changes were observed using a Transmission electron microscope (Zeiss EM 902A, Zeiss, Oberkochen, Germany).
K. Statistical analysis
All data are expressed as the mean ± SD. Statistical differences between the experimental groups were determined using Student’s t test and Bonferroni correction. Statistical analysis was conducted using MedCalc® version 9.3.0.0.
- 9 -
Ⅲ
. RESULTS
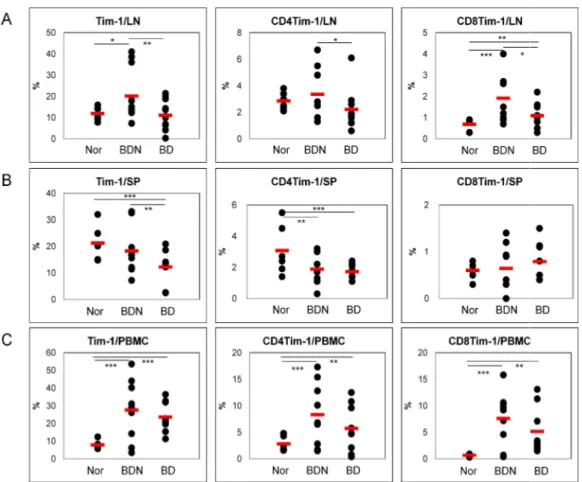
A. The frequencies of Tim-1 and Tim-4 expressing cells in normal healthy, BDN and BD mice
The frequencies of Tim-1(+), CD4(+)Tim-1(+) and CD8(+)Tim-1(+) cells were analyzed in cells from lymph nodes (LN), spleen (SP) and peripheral blood mononuclear cells (PBMC) of normal healthy (Nor) and BD Normal (BDN; HSV-1 was inoculated but no symptoms) mice and compared with those in BD mice by FACS. In LN, the frequencies of Tim-1(+), CD4(+)Tim-1(+) and CD8(+)Tim-1(+) cells in BD mice were significantly lower than BDN mice [BDN vs. BD (%): Tim-1(+), 20.1±11.5 (n=12) vs. 11.1±6.7 (n=12), p=0.01; CD4(+)Tim-1(+), 3.4±1.9 (n=9) vs. 2.2±1.6 (n=9), p=0.09; CD8(+)Tim-1(+), 1.9±1.1 (n=9) vs. 1.1±0.6 (n=9), p=0.04]. (Fig 1A). In spelnocytes, the BD mice showed significantly lower frequencies than Nor or BDN mice [Nor vs. BDN vs. BD (%): Tim-1(+), 21.3±6.5 (n=6) vs. 18.3±8.5 (n=10) vs. 12.2±5.9 (n=10), Nor vs. BD p=0.006, BDN vs. BD p=0.04; CD4(+)Tim-1(+), 3.1±1.6 (n=6) vs. 1.9±1.0 (n=8) vs. 1.7±0.5 (n=8), Nor vs. BD p=0.02, BDN vs. BD p=0.35]. CD8(+)Tim-1(+) cells showed similar frequencies among three groups (Fig 1B). In PBMC, the frequencies of BD mice were slightly lower than BDN, but not significant [BDN (n=9) vs BD (n=9) (%): Tim-1(+), 27.6±17.1 vs. 23.6±8.4 p=0.54; CD4(+)Tim-1(+), 8.3±5.9 vs. 5.7±4.4, p=0.31; CD8(+)Tim-1(+), 7.6±5.0 vs. 5.2±4.3, p=0.29]. BD mice were significantly higher than Nor mice (Fig 1C). These data indicated that the frequencies of Tim-1 expression cells in BD mice were down-regulated compare to
- 10 -
BDN mice.
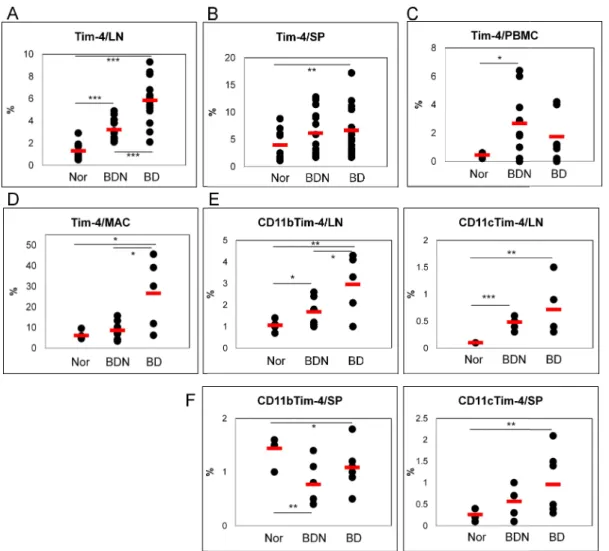
The frequencies of Tim-4(+) cells were also analyzed in LN, SP and PBMC of Nor, BDN and BD mice. In LN, the frequency of Tim-4(+) cells in BD mice was significantly higher than Nor and BDN mice [Nor vs. BDN vs. BD (%): 1.3±0.8 (n=11) vs. 3.2±0.9 (n=15) vs. 5.8±2.0 (n=15), Nor vs. BDN p=0.000005, Nor vs. BD p=0.0000001, BDN vs. BD p=0.00003](Fig 2A). In splenocytes, the frequency of Tim-4(+) cells in BD mice was also significantly higher than Nor mice [Nor vs BD (%): 3.9±2.8 (n=11) vs. 6.7±4.3 (n=17), p=0.035]. However, the difference between BDN and BD mice were not significant (Fig 2B). In PBMC, the frequencies of Tim-4(+) cells in BD mice were higher than Nor mice (Fig 2C). Moreover, in peritoneal macrophages, the frequencies of Tim-4(+) cells in BD mice were significantly higher than Nor and BDN mice [Nor vs. BDN vs. BD (%): 6.1±2.0 (n=5) vs. 8.6±4.0 (n=9) vs. 26.6±17.0 (n=5), Nor vs. BDN p=0.11, Nor vs. BD p=0.02, BDN vs. BD p=0.005]. There was not found any differences between Nor and BDN mice (Fig 2D). In addition, we also examined the frequencies of CD11b(+)Tim-4(+) and CD11c(+)Tim-4(+) cells in LN and spleen. In LN, both markers in BD mice were higher than Nor and BDN mice [Nor (n=5) vs. BDN (n=6) vs. BD (n=5) (%): CD11b(+)Tim-4(+), 1.1±0.3 vs. 1.7±0.7 vs. 3.0±1.4, Nor vs. BDN p=0.05, Nor vs. BD p=0.01, BDN vs. BD p=0.04; CD11c(+)Tim-4(+), 0.1±0.0 vs. 0.5±0.1 vs. 0.7±0.5, nor vs. BDN p=0.00003, Nor vs. BD p=0.01, BDN vs. BD p=0.14] (Fig 2E). In splenocytes, expression of CD11c(+)Tim-4(+) cells was found similar to the LN in Nor (0.3±0.1%, n=5), BDN (0.6±0.4%, n=6) and BD mice (1.0±0.6%, n=8) (Nor vs. BDN p=0.07, Nor vs. BD p=0.07, BDN vs. BD p=0.1). On the other hand, the frequencies of CD11b(+)Tim-4(+) cells in BD mice were significantly lower than Nor, but
- 11 -
higher than BDN mice (Fig 2F). These data suggested that the frequencies of Tim-4 expression cells in BD mice were up-regulated compare to BDN mice.
Figure 1. The frequencies of Tim
mice. The frequencies of Tim-1(+), CD4(+)Tim
were compared to Nor and BDN mice by FACS analysis in A. lymph nodes, B. spleen, and C. PBMC. (n=6~12) (*p < 0.1, ** p < 0.05, *** p < 0.01)
normal mice
- 12 -
Figure 1. The frequencies of Tim-1(+) cell phenotypes in normal healthy, BDN and BD 1(+), CD4(+)Tim-1(+) and CD8(+)Tim-1(+) cells in BD mice and BDN mice by FACS analysis in A. lymph nodes, B. spleen, and C. (*p < 0.1, ** p < 0.05, *** p < 0.01) Nor: normal healthy mice, BDN: BD
, BDN and BD 1(+) cells in BD mice and BDN mice by FACS analysis in A. lymph nodes, B. spleen, and C.
Figure 2. The frequencies of Tim
mice. The frequency of Tim-4(+) cells in BD mice was compared to FACS analysis in A. lymph nodes, B. spleen, C. PBMC, and D. expression of CD11b(+)Tim-4(+) and CD11c(+)Tim
compared to Norand BDN mice in E. lymph nodes and F. spleen. < 0.01, *** p < 0.001) Nor: normal healthy
- 13 -
of Tim-4(+) cell phenotypes in normal healthy, BDN and BD 4(+) cells in BD mice was compared to Norand BDN mice by FACS analysis in A. lymph nodes, B. spleen, C. PBMC, and D. peritoneal macrophage
4(+) and CD11c(+)Tim-4(+) cells in BD mice were also and BDN mice in E. lymph nodes and F. spleen. (n=5~17) (*p < 0.05, ** p
normal healthy mice, BDN: BD normal mice
, BDN and BD and BDN mice by macrophage. The 4(+) cells in BD mice were also < 0.05, ** p
- 14 -
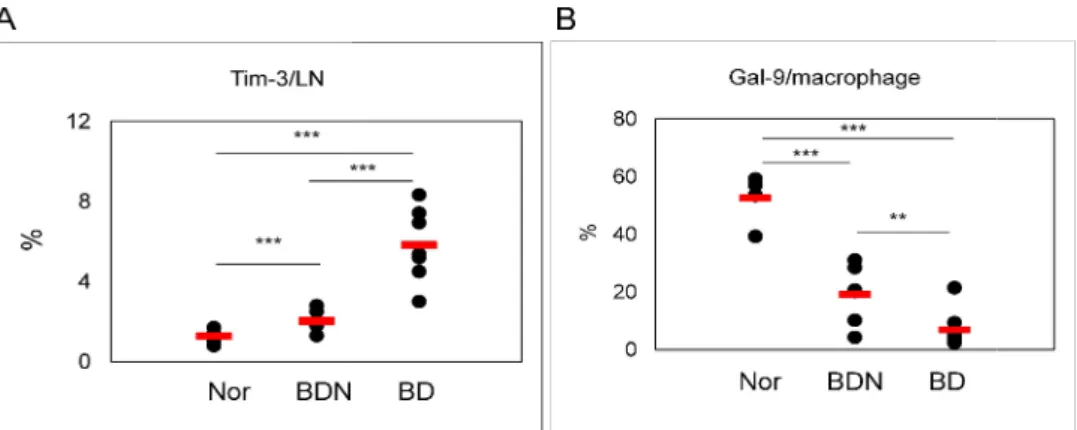
B. The expression of Tim-3 and Gal-9 in BD mice
The frequencies of Tim-3(+) cells in lymph node and Gal-9 in peritoneal macrophages of Nor and BDN mice were compared to those of BD mice by FACS analysis. The number of Tim-3(+) cells in BD mice (n=7) were significantly higher than those in normal (n=7) and BDN mice (n=6) (Nor 1.3±0.3% vs. BD 5.8±1.8%, p=0.00003; BDN 2.0±0.5% vs. BD 5.8±1.8%, p=0.005) (Fig 3A). On the other hand, the frequencies of Gal-9 in peritoneal macrophages from BD mice (n=7) were significantly lower than those in Nor (n=5) and BDN (n=6) mice (Nor 52.5±7.8% vs. BD 6.9±6.8%, p=0.000001, BDN 19.2±10.3% vs. BD 6.9±6.8%, p=0.027) (Fig 3B).
Figure 3. Expression of Tim-3 and Gal lymph node and (B) Gal-9(+) in
and BD mice by FACS analysis. mice, BDN: BD normal mice
- 15 -
3 and Gal-9 in BD mice. The frequencies of (A) Tim 9(+) in peritoneal macrophages were compared among
and BD mice by FACS analysis. (n=5~7) (**p < 0.05, ***p < 0.01) Nor: normal healthy The frequencies of (A) Tim-3(+) in macrophages were compared among Nor, BDN, normal healthy
- 16 -
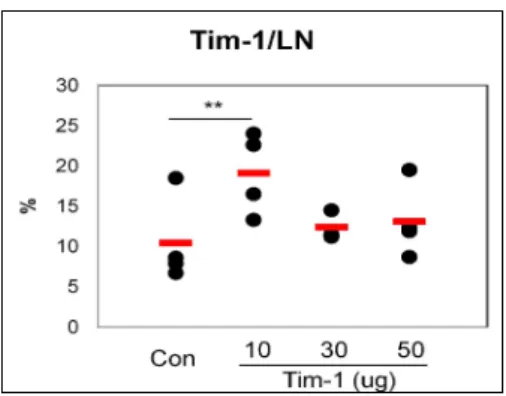
C. Administration of Tim-1 vector up-regulates the frequency of Tim-1(+) cells in vivo lymph nodes
We investigated the change of BD-like symptoms according to the regulation of Tim-1 expression. To up-regulate the expression of Tim-1, Tim-1 expression vector was administered into BD mice and the frequencies of Tim-1(+) cells were down-regulated in BD mice compared to BDN mice (Fig 1). Tim-1 vector was injected intraperitoneally at 10, 30 and 50 μg per mouse into Nor mice for 2 times at 2 days interval. Then, next day of the last injection, the frequencies of Tim-1(+) cells from LN were compared to those of the control vector injected group. The expression of Tim-1(+) cells in 10 μg of Tim-1 vector injected group (19.1±5.1%, n=3~4) were significantly higher than control vector injected group (10.4±5.4%, n=4, p=0.03) (Fig 4). However, 30 and 50 μg of Tim-1 vector injected group showed lower expression than 10 μg injected group. After that, 10 μg of Tim-1 vector was used for the following study.
Figure 4. Administration of Tim observe the up-regulation of Tim 10, 30 and 50 μg per mouse into the last injection, the frequency of Tim
injected group by FACS analysis. Control was used empty vector, PCDEF3 (n=3~4) (**p < 0.05) Con: control vector
injection to Nor mice
- 17 -
Tim-1 vector increased the frequency of Tim-1(+) cells
regulation of Tim-1 expression, Tim-1 vector was injected intraperitoneally at g per mouse into Nor mice for 2 times at 2 days interval. Then, next day of the last injection, the frequency of Tim-1(+) cells in LN was compared to the control
group by FACS analysis. Control was used empty vector, PCDEF3 (50 on: control vector injection to Nor mice, Tim-1: Tim
1(+) cells. To vector was injected intraperitoneally at mice for 2 times at 2 days interval. Then, next day of 1(+) cells in LN was compared to the control vector μg/mouse).
- 18 -
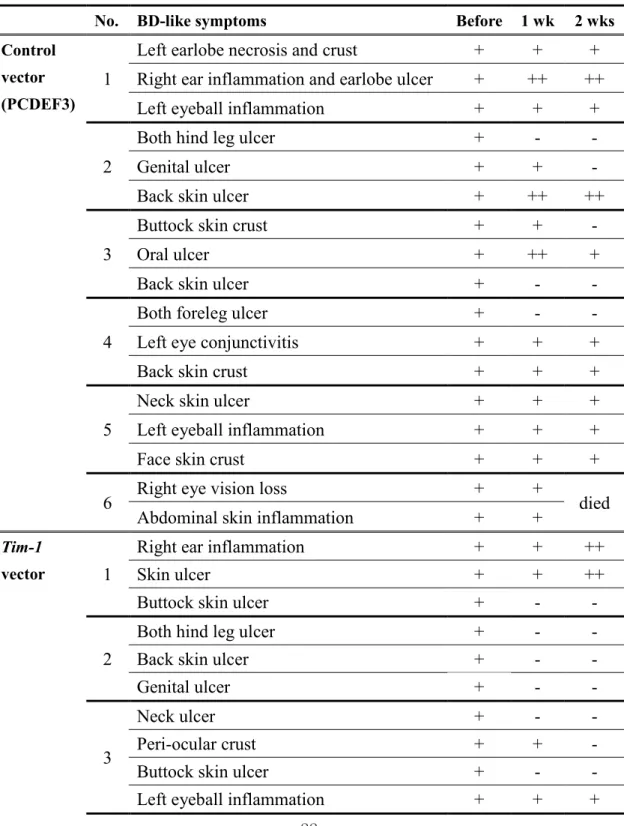
D. Administration of Tim-1 vector affected the BD-like symptoms
Ten mg of Tim-1 vector was injected intraperitoneally 4 times at 2 day intervals into BD mice, followed by the observation for 2 weeks. In this study, skin and genital ulcers were improved after Tim-1 vector administration when compared to the control vector injected group (Fig 5A). However, Tim-1 vector was not effective in eye involvement (Table 1). Additionally, in control vector group, the severity score was 2.83±0.41 before and 2.83±0.75 at one week and 2.67±1.21 at two week after first injection of control vector (p=0.8, n=6). In
Tim-1 vector group, severity score was 3.17±0.75 before the injection, 1.50±1.22 at one
week after injection (p=0.004), 1.33±1.51 at two weeks after injection in BD mice (p=0.03) (Fig 5B). After injection of Tim-1 vector, the severity score was decreased, whereas, control vector injection was not different in BD mice.
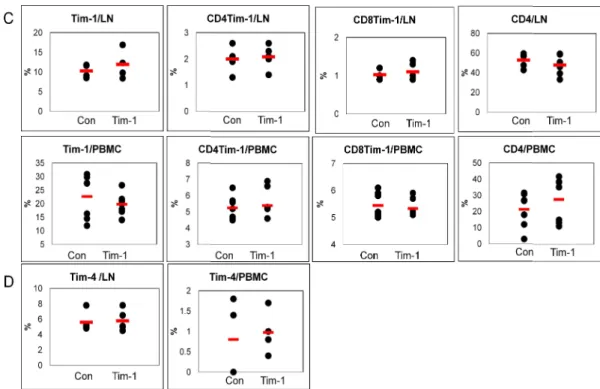
Two weeks after the first administration of Tim-1 vector to BD mice, isolated lymph node and PBMC were analyzed for Tim-1(+) cells by FACS. In LN, the frequency of Tim-1(+) cells in Tim-1 vector injected group was slightly high compared to control vector injected group [Con vs. Tim-1 (%): 10.3±1.7 (n=4) vs. 11.9±3.2 (n=5), p=0.19]. However, CD4(+)Tim-1(+) and CD8(+)Tim-1(+) cells were similar to control vector injected group (Fig 5C). The frequencies of 4(+) cells were also not different (Fig 5D). In PBMC, Tim-1(+) cells was slightly lower in Tim-1 vector injected group. CD4(+)Tim-Tim-1(+), CD8(+)1(+) and 4(+) cells were not different (Fig 5C-D). Interestingly, CD4(+) T cells in Tim-1 vector injected group were higher than control vector injected group [Con vs. Tim-Tim-1 (%): 21.3±10.7 (n=8) vs. 27.6±13.7 (n=8), p=0.36, Fig 5C]. One week after administration of
- 19 -
two weeks after injection (data not shown). Up-regulated Tim-1 expression improved BD-like symptoms in BD mice.
- 20 -
Figure 5. Administration of Tim of Tim-1 expressing cells were not
injected intraperitoneally 4 times at 2 days interval into BD mice, followed by observation for 2 weeks. A. photographs of mice were taken before and
treatment of Tim-1 vector and control vector injected group compared before and at one and two
Tim-1 vector injection, the frequencies of Tim
CD4(+) T cells, and D. Tim-4(+) cells in LN and PBM 0.1) Con: control vector injection to BD mice, Tim
- 21 -
tration of Tim-1 improved the BD-like symptoms, but the frequencies cells were not changed. Ten mg per mouse of Tim-1
injected intraperitoneally 4 times at 2 days interval into BD mice, followed by observation for 2 weeks. A. photographs of mice were taken before and at one and two weeks
vector and control vector injected group. B. The severity score was at one and two weeks after treatment of them. C. Two weeks after
he frequencies of Tim-1(+), CD4(+)Tim-1(+), CD8(+)Tim 4(+) cells in LN and PBMC by FACS analysis. (n=5~6) vector injection to BD mice, Tim-1: Tim-1 vector injection to BD mice
frequencies vector was injected intraperitoneally 4 times at 2 days interval into BD mice, followed by observation weeks after first B. The severity score was Two weeks after first 1(+), CD8(+)Tim-1(+) and (n=5~6) (*p < vector injection to BD mice
- 22 -
Table 1. The change of BD-like symptoms after Tim-1 and control vector administration
No. BD-like symptoms Before 1 wk 2 wks Control
vector (PCDEF3)
1
Left earlobe necrosis and crust
+
+
+
Right ear inflammation and earlobe ulcer
+
++
++
Left eyeball inflammation
+
+
+
2
Both hind leg ulcer
+
-
-
Genital ulcer
+
+
-
Back skin ulcer
+
++
++
3
Buttock skin crust
+
+
-
Oral ulcer
+
++
+
Back skin ulcer
+
-
-
4
Both foreleg ulcer
+
-
-
Left eye conjunctivitis
+
+
+
Back skin crust
+
+
+
5
Neck skin ulcer
+
+
+
Left eyeball inflammation
+
+
+
Face skin crust
+
+
+
6
Right eye vision loss
+
+
died
Abdominal skin inflammation
+
+
Tim-1
vector
1
Right ear inflammation
+
+
++
Skin ulcer
+
+
++
Buttock skin ulcer
+
-
-
2
Both hind leg ulcer
+
-
-
Back skin ulcer
+
-
-
Genital ulcer
+
-
-
3
Neck ulcer
+
-
-
Peri-ocular crust
+
+
-
Buttock skin ulcer
+
-
-
Left eyeball inflammation
+
+
+
- 23 -
No. BD-like symptoms Before 1 wk 2 wks
Tim-1
vector
4
Genital ulcer
+
-
-
Back skin ulcer
+
-
-
5
Neck skin ulcer
+
+
-
Back skin crust
+
-
-
Right eyeball inflammation
+
+
+
6
Left eyeball inflammation
+
+
+
Right eye vision loss
+
+
+
Back skin crust
+
-
-
Left earlobe erythema
+
+
-
BD symptom: +, deteriorated: ++, improved: -
- 24 -
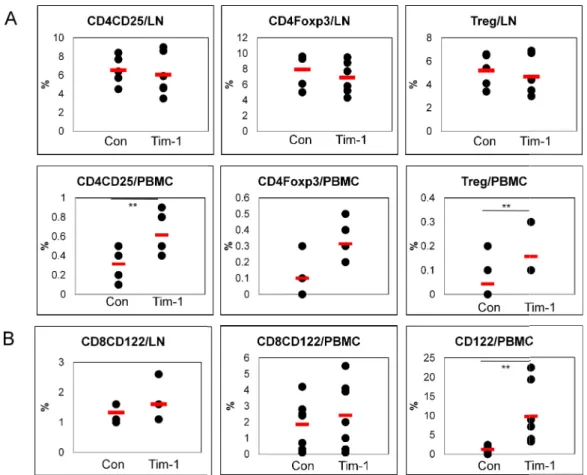
E. Tim-1 vector administration affects the regulatory cellular phenotypes
After Tim-1 vector administration, several cellular phenotypes in LN and PBMC were analyzed in BD mice. The frequencies of CD4(+)CD25(+), CD4(+)Foxp3(+) and CD4(+)CD25(+)Foxp3(+) (regulatory T, Treg) cells in LN were not significantly changed in
Tim-1 vector compared to control vector injected group [Con (n=5) vs. Tim-1 (n=6) (%):
CD4(+)CD25(+), 6.5±1.6 vs. 6.1±2.3 p=0.35; CD4(+)Foxp3(+), 5.3±1.5 vs. 4.7±1.7, p=0.29; Treg, 5.2±1.4 vs 4.7±1.7, p=0.3] (Fig 6A). But, in PBMC, CD4(+)CD25(+), CD4(+)Foxp3(+) and Treg cells in Tim-1 vector injected group were significantly higher than control vector injected group [Con (n=8) vs. Tim-1 (n=8) (%): CD4(+)CD25(+), 0.31±0.18 vs. 0.61±0.21 p=0.01; CD4(+)Foxp3(+), 0.10±0.10 vs. 0.31± 0.12, p=0.004 ; Treg, 0.04±0.08 vs 0.16± 0.10, p=0.03] (Fig 6A).
CD8(+)CD122(+) T cells are newly identified and regarded as Treg cells (Saitoh et al., 2007) and reported the effect as an anti-inflammatory responses (Rifa’i et al., 2008). Another type of Treg cells, CD8(+)CD122(+) T cells were also analyzed in LN of Tim-1 vector injected group. [Con (n=5) vs. Tim-1 (n=6) (%): 1.3±0.3 vs. 1.6±0.7 p=0.25] (Fig 6B). In PBMC, CD122(+) and CD8(+)CD122(+)T cells in Tim-1 vector injected group were also higher than control vector injected group [Con (n=8) vs. Tim-1 (n=8) (%): CD122(+), 1.2±1.0 vs. 9.8±7.9 p=0.04; CD8(+)CD122(+), 1.9±1.5 vs. 2.4±2.1 p=0.58).
Our study indicated that Tim-1 vector up-regulated Treg cells and CD8(+)CD122(+) Treg cells in BD mice. Up-regulation of these cellular phenotypes may be involved in the improvement of BD-like symptoms after injection of Tim-1 vector.
Figure 6. The frequencies of Treg cells in PBMC were affected in
BD mice. Two types of Treg cells and apoptotic cell phenotypes were confirmed in LN and PBMC after Tim-1 administration to BD mice. A. The frequencies of CD4(+)CD25(+), CD4(+)Foxp3(+) and Treg cells were compared between control and
group. B. CD8(+)CD122(+) T cells were up
significant. CD122(+) cells was significantly increased in (n=5~8) (**p < 0.05, ***p < 0.01)
vector injection to BD mice
- 25 -
Figure 6. The frequencies of Treg cells in PBMC were affected in Tim-1 vector injected Two types of Treg cells and apoptotic cell phenotypes were confirmed in LN and administration to BD mice. A. The frequencies of CD4(+)CD25(+), CD4(+)Foxp3(+) and Treg cells were compared between control and Tim-1 vector injected group. B. CD8(+)CD122(+) T cells were up-regulated compared to control group but not significant. CD122(+) cells was significantly increased in Tim-1 vector injected grou
**p < 0.05, ***p < 0.01) Con: control vector injection to BD mice, Tim
vector injected Two types of Treg cells and apoptotic cell phenotypes were confirmed in LN and administration to BD mice. A. The frequencies of CD4(+)CD25(+), vector injected regulated compared to control group but not vector injected group. vector injection to BD mice, Tim-1: Tim-1
- 26 -
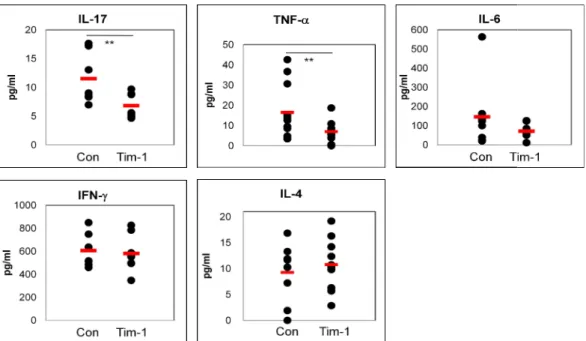
F. Pro-inflammatory cytokines were down-regulated by Tim-1 vector administration in BD mice
To determine the level of cytokines, two weeks after Tim-1 vector injection into BD mice, sera were analyzed by ELISA. The IL-17 level in Tim-1 vector injected group was significantly lower than control group [Con (n=7) vs. Tim-1 (n=7) (pg/ml): 11.53±4.45 vs. 6.84±2.17, p=0.03]. TNF-a was also significantly decreased in the Tim-1 vector injected group compared to control group [Con (n=11) vs. Tim-1 (n=11) (pg/ml):16.5±13.8 vs. 6.9±5.1, p=0.04]. The IL-6 level in Tim-1 vector injected group was decreased [Con (n=8) vs. Tim-1 (n=8) (pg/ml):145.7±176.9 vs.72.2±38.8, p=0.27]. In contrast, IL-4 was slightly increased in Tim-1 vector injected group [Con (n=8) vs. Tim-1 (n=9) (pg/ml):9.3±5.4 vs. 10.8±5.0, p=0.53]. But IFN-g did not differ between the Tim-1 and control vector injected group (Fig 7). Consequently, these results indicated that Tim-1 vector might be served as down-regulator for pro-inflammatory cytokines in BD mice.
Figure 7. Tim-1 vector administration decreased pro mice. Two weeks after first injection
17, TNF-a, IL-6, IFN-g and IL injected BD mice by ELISA. (n=7~11
mice, Tim-1: Tim-1 vector injection to BD mice
- 27 -
vector administration decreased pro-inflammatory cytokines in BD injection of Tim-1 vector isolated sera in blood. The levels of IL and IL-4 were analyzed in the sera of Tim-1 and control vector
(n=7~11) (**p < 0.05) Con: control vector injection to BD vector injection to BD mice
inflammatory cytokines in BD levels of IL-and control vector vector injection to BD
- 28 -
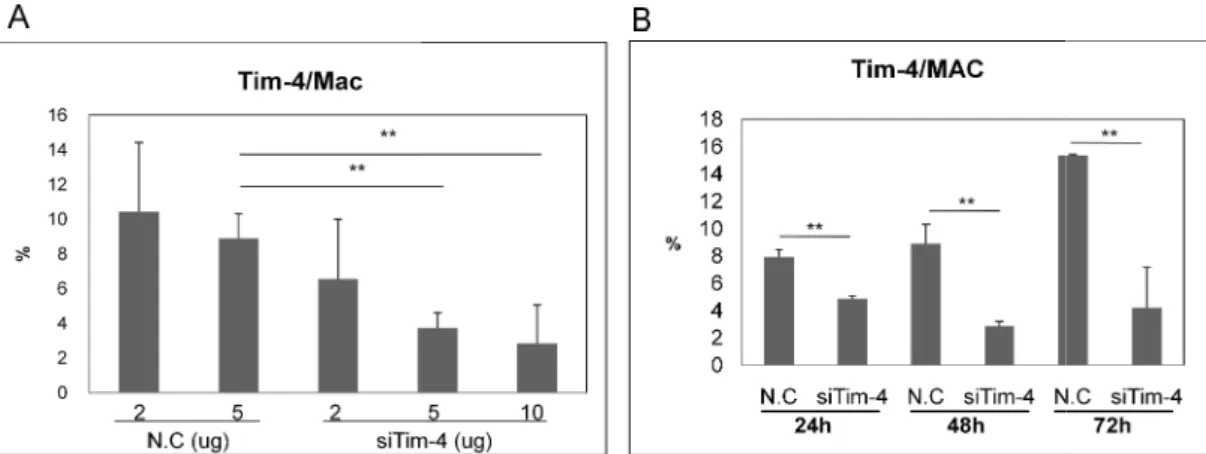
G. Tim-4 siRNA treatment down-regulated the expression of Tim-4 in normal healthy mice
In BD mice, the frequencies of Tim-4(+) cells were higher than Nor and BDN mice in LN cells and peritoneal macorphages (Fig 2). For down-regulation of Tim-4(+) cells, siTim-4 was injected into Nor mice intraperitoneally and the frequencies of Tim-4(+) cells were analyzed in peritoneal macrophages by FACS. Tim-4 siRNA (siTim-4) at 2, 5 or 10 μg per mouse or negative control (N.C.) scramble siRNA (2 and 5 μg per mouse) were injected [N.C - 5 μg vs. siTim-4 - 2, 5 and 10 μg (n=3~4): 8.9±1.4% vs. 6.6±3.4% (p=0.42), 3.7±0.9% (p=0.013), 2.8±2.2% (p=0.04)] (Fig 8A). siTim-4 down-regulated Tim-4(+) macrophages by dose dependent manner and showed statistical significance at 5 μg and 10 μg administered groups. Therefore, 5 μg injection was used for the following experiment. To see the time dependent efficacy of Tim-4 siRNA, 5 μg of siTim-4 was injected, and after 24, 48, and 72 hours, the frequencies of Tim-4(+) macrophages were analyzed by FACS. Until 72 hours, siTim-4 significantly down-regulated Tim-4(+) macrophages compared to N.C. The frequencies of Tim-4(+) at 48 hours were lowest [N.C vs. siTim-4 (n=2): 24h, 7.9±0.6% vs. 4.9±0.2%, p=0.02; 48h, 8.9±1.4% vs. 2.9±0.4%, p=0.03; 72h, 15.4±0.1% vs. 4.2±3.0%, p=0.03] (Fig 8B).
Figure 8. The expression of Tim
Tim-4 siRNA was applied intraperitoneally and the frequencies of Tim analyzed in peritoneal macrophages
mouse or negative control (N.C.) siRNA (2 intraperitoneally into Nor mice. B. Five μg of siTim
hours, the frequencies of Tim-4(+) peritoneal macrophages were ana was used as negative control (n=3~4)
mice, siTim-4: siRNA Tim-4 injection to normal mice
- 29 -
Figure 8. The expression of Tim-4(+) cells was down-regulated after siTim-4
4 siRNA was applied intraperitoneally and the frequencies of Tim-4(+) cells were analyzed in peritoneal macrophages in Nor mice by FACS. A. siTim-4 2, 5 and 10 mouse or negative control (N.C.) siRNA (2 and 5 μg per mouse) were injected
mice. B. Five μg of siTim-4 was injected, and after 24, 48, and 72 4(+) peritoneal macrophages were analyzed. Scramble siRNA egative control (n=3~4) (**p < 0.05). N.C: negative control injection to normal
4 injection to normal mice, Mac: macrophage
treatment. 4(+) cells were 2, 5 and 10 μg per g per mouse) were injected 4 was injected, and after 24, 48, and 72 Scramble siRNA N.C: negative control injection to normal
- 30 -
H. Administration of siTim-4 changed the BD-like symptoms
Five mg of siTim-4 was injected intraperitoneally 3 times at 2 days interval into BD mice and followed by observation for 2 weeks (Fig 9A). After administration of siTim-4, BD-like symptoms, such as skin ulcer and genital ulcer were compared to the control group. However, siTim-4 was not effective in eye involvement (Table 2). In negative control group, the severity score was 2.25±0.46 before and 2.00±1.07 at one week (p=0.35), and 1.88±1.13 at two weeks after first injection of BD mice (p=0.28, n=8). In siTim-4 treated group, score was 2.63±0.52 before and 1.25±0.89 at one week (p=0.001), 1.25±0.89 at two weeks after injection into BD mice (p=0.001, n=8) (Fig 9B). At one and two weeks after first administration of siTim-4 into BD mice, macrophages were isolated from peritoneal cavity and analyzed for Tim-4 by FACS. The frequencies of Tim-4(+) cells at one and two weeks after siTim-4 treated group were lower than negative control group even though not significant (1 week: 18.6±4.8% vs. 15.7±3.7%, p=0.31, 2 weeks: 20.7±6.5%vs. 18.8±3.3%, p=0.42) (Fig 9B). However in LN, 4(+), CD11b(+)4(+), CD11c(+)4(+), Tim-1(+), CD4(+)Tim-1(+) and CD8(+)Tim-1(+) cells of siTim-4 treated group were similar to control treated group (Fig 9C~D). At one week after first injection of siTim-4, those markers assessed but not different to two weeks (date not shown). In these results, BD-like symptoms were improved with si4 treatment and decreased severity score but the changes of Tim-4 related cellular phenotypes could not be found in this study.
- 32 -
Figure 9. BD-like symptoms were changed after siTim-4 administration. Five mg per mouse of Tim-4 siRNA was injected intraperitoneally 3 times at 2 days interval into BD mice and observed for 2 weeks. A. Photographs of mice taken before and at one and two weeks after treatment with siTim-4 and N.C treated group. B. The severity score was compared before and at one and two weeks after treatment between the siTim-4 and N.C treated group. The frequencies of Tim-4(+) cells in peritoneal cavity were compared between siTim-4 and N.C treated groups. C~D. The frequencies of Tim-4(+), CD11b(+)Tim-4(+), CD11c(+)Tim-4(+), Tim-1(+), CD4(+)Tim-1(+) and CD8(+)Tim-1(+) cells in LN were compared to siTim-4 and negative control treated group. (n=7~8) (**p < 0.05) N.C: negative control injection to BD mice, siTim-4: siRNA Tim-4 injection to BD mice, LN: lymph node
- 33 -
Table 2. The change of BD-like symptoms in siTim-4 administered BD mice
No. BD symptoms Before 1 wk 2 wks Negative control (Scramble siRNA) 1
Right earlobe necrosis + ++ ++ Flank skin ulcer + ++ ++ Left Foreleg ulcer + - - 2 Right ear inflammation + + +
Face crust + - +
3 Genital ulcer + - -
Right ear ulcer + ++ ++
4
Back skin ulcer + + -
Face skin ulcer + + +
Right ear inflammation + + + 5 Genital inflammation + - -
Back crust + + +
6 Genital inflammation + + - Back skin crust + - -
7
Genital ulcer + - -
Back skin ulcer + + +
Oral crust - + +
8 Right foreleg skin ulcer + - -
Oral ulcer + ++ ++
Tim-4
siRNA 1
Right eye vision loss + + + Back skin ulcer + - -
2
Face and neck crust + + + Right ear inflammation and
earlobe ulcer + ++ ++ Left ear inflammation + - - 3 Both foreleg crust + - - Genital inflammation + - - 4 Right ear inflammation + + +
- 34 -
No. BD symptoms Before 1 wk 2 wks Tim-4
siRNA
4 Oral crust + - -
5
Scruff skin necrosis + + +
Genital ulcer + - -
Back skin crust + - -
6
Genital ulcer + - -
Back skin ulcer + - - Peri-ocular skin crust + + +
7
Left hind leg arthritis + - - Right eyeball inflammation + + + Left earlobe ulcer + - -
8
Left ear inflammation + - - Left eyeball inflammation + + +
Neck skin ulcer + + +
- 35 -
I. Treg cells were up-regulated in siTim-4 treated BD mice
The frequencies of CD4(+)CD25(+), CD4(+)Foxp3(+) and Treg [CD4(+)CD25(+) Foxp3(+)] cells were also analyzed by FACS at one and two weeks after first treatment with siTim-4 into BD mice. After one week, Treg cells were slightly increased in siTim-4 treated BD mice compared with N.C treated group [N.C vs. siTim-4: CD4(+)CD25(+), 5.82±2.01% vs. 6.84±2.03%, p=0.45, n=5; CD4(+)Foxp3(+), 4,64±1.9% vs. 5.82±2.4%, p=0.41, n=5; Treg, 3.28±1.57% vs. 4.08±1.73%, p=0.47, n=5]. After two weeks, Treg cells were significantly higher in siTim-4 treated BD mice than N.C treated group [N.C vs. siTim-4: CD4(+)CD25(+), 4.8±0.6% vs. 5.9±1.2%, p=0.03, n=6; CD4(+)Foxp3(+), 4.1±0.7% vs. 5.2±1.2%, p=0.03, n=7; Treg, 2.7±0.5% vs. 3.5±0.9%, p=0.04, n=7] From this result, the increases of Treg cells are associated with knock down of Tim-4 in BD mice.
Figure 10. The frequencies of Treg cells were up
in BD mice. Treg cells and granzyme B(+) cells were confirmed in LN of BD mice after treatment with siTim-4. At One and two weeks after
frequency of CD4(+)CD25(+), CD4(+)Foxp3(+) and Treg were compared between
siTim-negative control injection to BD mice, siTim lymph node
- 36 -
Figure 10. The frequencies of Treg cells were up-regulated after treatment with siTim Treg cells and granzyme B(+) cells were confirmed in LN of BD mice after
One and two weeks after first treatment with siTim frequency of CD4(+)CD25(+), CD4(+)Foxp3(+) and Treg [CD4(+)CD25(+)Foxp3(+)]
-4 and control treated group. (n=5~7) (**p < 0.05) negative control injection to BD mice, siTim-4: siRNA Tim-4 injection to BD mice, LN:
regulated after treatment with siTim-4 Treg cells and granzyme B(+) cells were confirmed in LN of BD mice after ment with siTim-4, the [CD4(+)CD25(+)Foxp3(+)] cells (**p < 0.05) N.C: 4 injection to BD mice, LN:
- 37 -
J. Treatment with siTim-4 decreased the serum level of IL-17 in BD mice
After administration of siTim-4 into BD mice, serum level of IL-17 was analyzed by ELISA and compared with N.C siRNA treated BD mice. The level of IL-17 was decreased in siTim-4 treated group compared to N.C treated group, but not significant [N.C vs. siTim-4 (n=8): 19.4±11.5 pg/ml vs. 15.6±8.1 pg/ml, p=0.25] (Fig 11).
Figure 11. Administration of siTim Serum obtained at two weeks after of IL-17 was analyzed by ELISA. siRNA Tim-4 injection to BD mice
- 38 -
siTim-4 decreased the serum level of IL-17 in BD mice erum obtained at two weeks after first injection of siTim-4 and N.C in BD mice.
17 was analyzed by ELISA. (n=8) N.C: negative control injection to BD mice, 4 injection to BD mice
17 in BD mice. in BD mice. The level N.C: negative control injection to BD mice, siTim-4:
- 39 -
K. Gal-9 treatment up-regulated the expression of Gal-9 in vitro and in vivo
We checked the expression of Gal-9 after Gal-9 treatment in in vitro and in vivo normal healthy mice Lymph node cells and splenocytes from Nor mice were cultured with or without Gal-9, including anti-CD3 and anti-CD28 antibodies, for 48 h in vitro. In LN cells, the frequencies of Gal-9(+) cells were significantly higher in the Gal-9-treated group than in the non-treated or IgG1-treated control group (non-treated 1.4±0.4% vs. Gal-9-treated 46.7±1.5, p=0.000001; IgG1-treated 1.5±1.2 vs. Gal-9-treated 46.7±1.5, p=0.000002). The frequencies of Gal-9(+) cells in splenocytes were significantly higher in the Gal-9 treated group than in the non-treated group or IgG1-treated group (non-treated 1.3±0.4% vs. Gal-9-treated 64.6±6.2%, p=0.00003; IgG1-Gal-9-treated 1.7±0.8% vs. Gal-9-Gal-9-treated 64.6±6.2%, p=0.00006] (Fig 12A). For in vivo administration, 100 μg per mouse of Gal-9 was injected intraperitoneally once a day for 3 days. One day after the last injection, the frequency of 9(+) cells was compared to those of the PBS-injected control group. The expression of Gal-9(+) cells was higher in lymph node cells of Gal-9 treated mice (45.5±7.4%) compared to control mice (35.5±7.6%) (p= 0.069) (Fig12B). We confirmed that treated with Gal-9 can increase Gal-9 expression in in vitro and in vivo Nor mice.
Figure 12. Gal-9 treatment increased the expression of Gal node cells and splenocytes isolated from
CD28 antibodies with or without Gal
higher in the Gal-9-treated group than in the non
vivo treatment, 100 μg of Gal-9 was injected 3 times once a day. One day after the last
injection, the frequencies of Gal-(PBS) group. (n=5) (*p < 0.1, ***p
- 40 -
9 treatment increased the expression of Gal-9 in vitro and in vivo node cells and splenocytes isolated from Nor mice were cultured with anti-CD3 and anti CD28 antibodies with or without Gal-9 for 48 h. A. The frequencies of Gal-9(+) cells were
treated group than in the non-treated or IgG1-treated group. B. For 9 was injected 3 times once a day. One day after the last
-9 were higher in the Gal-9 treated group than in the control (*p < 0.1, ***p < 0.01)
in vivo. Lymph
CD3 and anti-9(+) cells were treated group. B. For in 9 was injected 3 times once a day. One day after the last group than in the control
- 41 -
L. Gal-9 administration improved BD-like symptoms
Gal-9 (100 μg per mouse) was injected intraperitoneally into BD mice 5 times at 3 days interval, followed by observation for 2 weeks. Changes in symptoms are shown in Figure 13A. The BD-like symptoms, such as skin ulcers and arthritis, improved after Gal-9 administration as compared to the control group. The severity score was significantly different between the control (2.4±0.6 to 2.7±0.8) and Gal-9 treated groups (2.8±0.8 to 1.2±0.5) (p=0.016, n=5) (Fig 13B). Two weeks after administration of Gal-9 into BD mice, lymph node cells were isolated and analyzed for 3 by FACS. The frequencies of Tim-3(+) cells were 3.7±0.4% in the Gal-9 treated group and 5.9±1.1% in the control group (p=0.003, n=5) (Fig 13C). In this study, administration of Gal-9 was significantly decreased the frequencies of Tim-3(+) cells in the lymph nodes. These results suggest that the down-regulation of Tim-3(+) cells may be related to the improvement of BD-like symptoms.
Figure 13. Gal-9 treatment improved BD
9 was injected intraperitoneally five times at 3 days interval, followed by observation for 2 weeks. A. Photographs of mice were taken before and after treatment. B. The severity score was compared before and after treatment b
C.The frequency of Tim-3(+) cells in Gal in LN by FACS analysis. (n=5)
Gal-9: Gal-9 injection to BD mice
- 42 -
9 treatment improved BD-like symptoms. For each mouse, 100 μg of Gal 9 was injected intraperitoneally five times at 3 days interval, followed by observation for 2 weeks. A. Photographs of mice were taken before and after treatment. B. The severity score was compared before and after treatment between the Gal-9 and control treated groups. 3(+) cells in Gal-9 treated group was compared with control group (**p < 0.05, ***p < 0.01) Con: PBS injection to BD mice, 9 injection to BD mice
For each mouse, 100 μg of Gal-9 was injected intraperitoneally five times at 3 days interval, followed by observation for 2 weeks. A. Photographs of mice were taken before and after treatment. B. The severity score treated groups. 9 treated group was compared with control group on: PBS injection to BD mice,
- 43 -
M. Gal-9 induced the expression of cell death-related molecules in BD mice
To confirm the apoptotic cell death in Gal-9 administered BD mice, lymph node cells were analyzed by flow cytometry after staining with Annexin V and propidium iodide (PI). The frequencies of Annexin V(+) and PI(-) apoptotic cells were 12.0±2.9% in the Gal-9-treated group (n=6) and 6.9±2.4% in the PBS treated control group (n=7) (p=0.006) (Fig 14A). In this study, Gal-9 administration induced apoptosis in lymph node cells in BD mice. Granzyme B induces apoptosis (Saito et al., 2008) and is expressed in resting and activated plasmacytoid dendritic cells,monocytes, resting T-cells, B-cells, activated granulocytes, and activated monocyte-derived dendriticcells (Rissoan et al., 2002). Granzyme B(+) cells were also significantly higher in the Gal-9 treated group (11.0±6.3%) compared to the control group (5.6±3.6%) (p=0.04, n=9) (Fig 14B). CD107a is a marker of functional NK cells (Alter G et al., 2004) and CD8 T cells (Betts et al., 2003). CD107a is a transmembrane glycoprotein found in lysosomal and cell membranes and a marker of degranulation on lymphocytes (Betts et al., 2003). The frequencies of CD107a(+) cells were significantly increased after Gal-9 administration (10.9±4.9%) when compared to the PBS-administered control BD mice (0.4±0.2%) (p=0.001, n=5) (Fig 14C).
For confirmation of apoptosis induced by Gal-9, lymph node cells were cultured for 24 h with Gal-9, after which the frequencies of Tim-3(+) and Gal-9(+) among the apoptotic cells were analyzed by FACS. In apoptotic cells, the Gal-9 treated group showed 42.5±3.5% frequencies of Gal-9(+) cells compared to 17.9±0.9% in the control group (Fig 14D). In the Gal-9-treated group, the frequencies of Tim-3(+) cells were also up-regulated to 1.7±1.1% compared to the control group (0.6±0.5%) (Fig 14D). Further, Gal-9 treatment for 48 h also
- 44 -
up-regulated the frequencies of CD11b(+)Gal-9(+)CD107a(+) cells lymph node (1.80±0.3%) compared to the control group (0.20±0.1%) (Fig 14E). The frequencies of CD11c(+)Gal-9(+)CD107a(+) cells were also higher in the Gal-9 treated group (1.2±0.1%) compared to the control group (0.2±0.1%). 9 treatment increased the expression of CD107a(+) in Gal-9(+) macrophages (CD11b) and Gal-Gal-9(+) dendritic cells (CD11c). Furthermore, we applied CD11b(+) or Gr-1(+) staining as a neutrophil marker to lymph node cells and splenocytes for FACS analysis (Fig 14F). The lymph node cells and splenocytes isolated from BD mice were treated with Gal-9 (10 μg/ml) for 16 h. Then, anti-CD11b and anti-Gr-1 staining were performed on Annexin V(+) and PI(-) cells in order to measure the frequencies of apoptotic neutrophils. The frequencies of CD11b(+) cells among apoptotic lymph node cells were 11.5±1.2% in the Gal-9 treated group compared to the control group (8.4±2.4%). In splenocytes, the frequencies of CD11b(+) cells were 44.5±20.7% in the Gal-9 treated group compared to the control group (23.3±0.8%). The frequencies of Gr-1(+) cells among the apoptotic cells were also higher in the Gal-9 treated group (7.7%±2.1%) than in the control group (5.9±0.4%) among lymph node cells. In splenocytes, the frequencies of Gr-1(+) cells among the apoptotic cells were 29.3±22.1% in the Gal-9 treated group compared to the control group (23.1±1.3%) (Fig 14F). The frequencies of Gr-1(+) apoptotic cells were also higher in the Gal-9 treated group than in the control group.
After Gal-9 treatment to BD mice, to determine which cell populations were regulated, additionally, PBMC were isolated from Gal-9-treated BD mice and subjected to transmission electron microscopy (TEM). Gal-9-treated BD mice showed rare neutrophils compared to the control group under TEM (Fig. 14G).
Figure 14. Gal-9 treatment increased the expression of cell death BD mice. A. Annexin V(+) and PI(−
B Frequencies of granzyme B(+) cell
control group. C. CD107a(+) cells were increased in the Gal
control group. (A-C, n=7~9) D–F. Lymph nodes and spleen were isolated from BD mice, and isolated cells were incubated with 10 μg/mL of Gal
Annexin V(+) and PI(−) apoptotic cells were analyzed after staining with anti Gal-9 antibody to determine the frequencies of Tim
apoptotic cells, respectively. E. In LN, CD11b(+)Gal CD11c(+)Gal-9(+)CD107a(+) cells were up
Gr-1(+) neutrophils in Annexin V(+) and PI(− apoptotic cells than in the control group. G. After Gal
the Gal-9-treated group and control group and subjected to tran
(TEM). In Gal-9-treated group, neutrophils were rarely found compared to the c (×4000) (bar = 2.5 μm). Arrow indicates neutrophil in the control group. 0.01) Con: PBS injection to BD mice, Gal
- 46 -
9 treatment increased the expression of cell death-related molecules in A. Annexin V(+) and PI(−) apoptotic cells were higher in the Gal-9 treated group. B Frequencies of granzyme B(+) cells were also higher in the Gal-9 treated group than in the control group. C. CD107a(+) cells were increased in the Gal-9 treated group compared to the F. Lymph nodes and spleen were isolated from BD mice, and e incubated with 10 μg/mL of Gal-9 for 16–48 h, then applied to FACS. D.
) apoptotic cells were analyzed after staining with anti-Tim
9 antibody to determine the frequencies of Tim-3(+) or Gal-9(+) cells among the ic cells, respectively. E. In LN, CD11b(+)Gal-9(+)CD107a(+) cells and 9(+)CD107a(+) cells were up-regulated after Gal-9 treatment. F. CD11b(+) or
n V(+) and PI(−) apoptotic cells were higher in Gal
ic cells than in the control group. G. After Gal-9 treatment, PBMC were isolated from treated group and control group and subjected to transmission electron microscopy treated group, neutrophils were rarely found compared to the control group Arrow indicates neutrophil in the control group. (**p < 0.05, ***p < on: PBS injection to BD mice, Gal-9: Gal-9 injection to BD mice
related molecules in 9 treated group. 9 treated group than in the 9 treated group compared to the F. Lymph nodes and spleen were isolated from BD mice, and 48 h, then applied to FACS. D. Tim-3 or anti-9(+) cells among the 9(+)CD107a(+) cells and 9 treatment. F. CD11b(+) or ) apoptotic cells were higher in Gal-9-treated 9 treatment, PBMC were isolated from smission electron microscopy ontrol group (**p < 0.05, ***p <
- 47 -
N. Gal-9 modulated the cell population in BD mice
Various cellular phenotypes were regulated after treatment with Gal-9 in BD mice. The frequencies of Treg cells in the Gal-9 treated group were 2.4±0.6% compared to the control group (1.8±0.4%) (p=0.048, n=5) (Fig 15A). The frequencies of plasmacytoid dendritic cells were lower in BD patients than in the healthy control group (Pay S et al., 2007). CD11c(+) dendritic cells in the lymph node were significantly higher in the Gal-9-treated group (1.8±0.4%) compared to the control group (1.2±0.3%) (p=0.033, n=4) (Fig 15B). CD34 is a cell surface glycoprotein that functions as a cell-cell adhesion factor (Satterthwaite et al., 1992). The frequencies of CD34 in the Gal-9-treated group (2.5±1.0%) were significantly lower than the control group (5.6±3.7%) (p=0.025, n=7) (Fig 15C). Gal-9 led to the down-regulation of CD34, resulting in decreased cell adhesion in the inflammatory cells and therefore, changes in the symptoms.
Figure 15. Gal-9 treatment affected the expression of several cell types in BD mice The frequencies of Treg [CD4(+)CD25(+)Foxp3(+)]
higher than in the control group.
myeloid suppressor cells (CD34) were compared between the control and Gal groups. (n=4~9) (**p < 0.05) Con: PBS injection to BD mice, Gal
mice
- 48 -
9 treatment affected the expression of several cell types in BD mice [CD4(+)CD25(+)Foxp3(+)] cells in the Gal-9-treated group were higher than in the control group. B and C. Expression levels of dendritic cells (CD11c) and myeloid suppressor cells (CD34) were compared between the control and Gal
on: PBS injection to BD mice, Gal-9: Gal-9 injection to BD 9 treatment affected the expression of several cell types in BD mice. A. treated group were . Expression levels of dendritic cells (CD11c) and myeloid suppressor cells (CD34) were compared between the control and Gal-9 treated 9 injection to BD
- 49 -
O. Gal-9 regulated cytokine expression in BD mice
To determine the level of cytokines after Gal-9 treatment in BD mice, sera were analyzed by ELISA. The TNF-α level was significantly lower in the Gal-9 treated group (153.9±33.1 pg/ml) than the control group (206.1±28.7 pg/ml) (p=0.025, n=4). IL-6 was also decreased in the Gal-9 treated group (133.7±65.6 pg/ml, n=12) compared to the control group (219.38±147.00 pg/ml, n=10) (p=0.04). In addition, IL-17 was significantly lower in the Gal-9 treated group (263.5±179.0 pg/ml, n=12) than in the control (500.8±325.1 pg/ml, n=10) (p=0.02). IFN-γ and IL-4 levels did not differ significantly between the Gal-9 and control treated groups (Fig 16).
Figure 16. Gal-9 treatment regulated pro
inflammatory cytokines were analyzed in the sera of Gal
levels of TNF-α, IL-6, and IL-17 significantly decreased in the Gal to the control group. IFN-γ and IL
and control groups. (n=4~12) (**p < 0.05) injection to BD mice
- 50 -
9 treatment regulated pro-inflammatory cytokines in BD mice. inflammatory cytokines were analyzed in the sera of Gal-9 treated BD mice by ELISA. The
17 significantly decreased in the Gal-9 treated group comp γ and IL-4 levels were not significantly different between the Gal
(**p < 0.05) Con: PBS injection to BD mice, Gal
inflammatory cytokines in BD mice. Pro-9 treated BD mice by ELISA. The
9 treated group compared 4 levels were not significantly different between the Gal-9 on: PBS injection to BD mice, Gal-9: Gal-9
- 51 -
Ⅳ
. DISCUSSION
According to our study, BD mice display down-regulation of Tim-1 levels and up-regulation of Tim-4 levels, in LN, spleen, PBMC or peritoneal macrophages compared to BDN mice. Tim-1 vector administration up-regulated Tim-1(+) cells and Tim-4 siRNA down-regulated Tim-4(+) cells. Tim-1 vector administration improved the BD-like symptoms, such as genital ulcer and skin ulcer, and decreased the severity score. Recently, in active SLE patients, the expression of TIM-1 was lower compared to inactive patients (Wang Y et al., 2008). Human TIM-1 is associated with immune dysfunction, such as atopic dermatitis, allergy, rheumatoid arthritis, asthma and SLE (Chae et al., 2003b; Chae et al., 2003a; Chae et al., 2005; Page et al., 2006; Wang et al., 2008). Our data indicated that after Tim-1 vector administration, Tim-1 related T cells phenotype did not change. Interestingly, the frequency of CD4(+) T cells in PBMC was increased in Tim-1 vector injected group compared to control vector injected group. Actually, TIM-1 is expressed on CD4+ T cells after activation and its expression is sustained preferentially on Th2 but not Th1 cells (Kuchroo et al., 2003; Meyers et al., 2005a). Recently, reported that Tim-1-Fc triggered a significantly increase in the frequency of CD4(+) T cells (Xiao et al., 2011). In our study, Treg cells were up-regulated in Tim-1 vector injected BD group. Another Treg cells, CD8(+)CD122(+) T cells were higher in Tim-1 vector injected group compared to control group in PBMC and LN. CD8(+)CD122(+) T cells are newly identified and regarded as Treg cells (Saitoh et al., 2007) and reported the effect in anti-inflammatory responses (Rifa’i et al., 2008). Our study
- 52 -
suggest that the function of Tim-1 influenced on BD-like symptoms, associated with Treg cells and CD8(+)CD122(+) T cells.
Recent studies suggested that IL-17 may play a dominant role in provoking chronic autoimmune inflammation, and it is considered to be essential for T cell-mediated colitis and promotion of inflammation (Cua et al., 2003; Langrish et al., 2005; Yen et al., 2006). Pro-inflammatory cytokine TNF-a over-expression has been implicated in acute and chronic inflammatory diseases, such as septic shock, bowel disease, Crohn’s disease, rheumatoid arthritis, atopic dermatitis, psoriasis, and BD (Edwards, 2004). Overproduction of IL-6 has been shown to play a role in rheumatoid arthritis, juvenile idiopathic arthritis (Nishimoto and Kishimoto, 2008), inflammatory bowel disease (Mudter and Neurath, 2007), and SLE (Chun et al., 2007). Recently reported that anti-Tim-1 antibody (high avidity/agonistic) was determined as a down-regulator of pro-inflammatory Th-17 cells. TIM-1-TIM-4 interaction is involved in the regulation of Th cell responses and the modulation of the Th1/Th2 cytokines balance (Meyers et al., 2005a). Our data also indicate that Tim-1 vector administration decreased the pro-inflammatory cytokines, such as IL-17, TNF-α and IL-6. And Th2 type cytokine, IL-4 was up-regulated in Tim-1 vector injected group.
BD mice display markedly increased Tim-4 levels in LN and peritoneal macrophages compared to Nor and BDN mice. In Tim-4 siRNA administration to Nor mice, the frequencies of Tim-4(+) cells were down-regulated compared to N.C group. siTim-4 administration to BD mice decreased Tim-4(+) cells in peritoneal macrophages even though not significant. siTim-4 administered BD mice displayed improved symptoms such as skin ulcer, genital ulcer and arthritis and also decreased the severity score. But Tim-4(+) cells