Background: There is limited evidence about surgical outcomes after lumbar spinal surgery in patients with neuropathic pain (NP) or the prevalence of NP proportions among patients with degenerative lumbar diseases who are candidates for a surgical interventions.
Objective: The objectives of this study were to investigate the prevalence of NP among patients scheduled for lumbar spinal surgery and the relationship between health-related quality of life (HRQoL) and NP. This study also aimed to identify the risk factors related to NP and compare the clinical outcomes after surgical treatment between patients with and without NP.
Study Design: This study was a nationwide, multicenter, prospective, and observational study. It was conducted from September 2011 to May 2013, and included a total of 1,109 patients who were scheduled for lumbar spinal surgery from 44 spinal centers (both orthopedics and neurosurgeons). Setting: Multicenter study
Methods: Patients were diagnosed of having NP if the Leeds Assessment of Neuropathic Symptoms and Signs (LANSS) pain scale was ≥ 12 points. The patients were investigated to assess the differences in their clinical outcomes one week and 3 months after surgery and were followed-up with regards to pain and HRQoL to explore the risk factors affecting NP.
Results: Of 1,109 recruited patients, 404 (36.4%) suffered from NP (mean age 62.06 years; 37.9% men) with mean LANSS score of 17.44 ± 4.06, while 705 (63.6%) had nociceptive pain with mean LANSS score of 6.03 ± 3.52. At baseline, patients with NP showed lower HRQoL and more severe pain compared to nociceptive pain patients. However, 3 months after surgical treatment, the NP group showed greater improvement in pain NRS (P = 0.087) and EQ-5D (P = 0.029) as compared to nociceptive pain group. Longer symptom duration was identified as a risk factor for NP (OR 1.003, respectively, P = 0.020).
Conclusion: There was a high prevalence of NP in Korean patients scheduled for lumbar spine surgery, and these patients suffered greater pain and lower HRQoL than nociceptive pain patients. The more remarkable improvement NP patients showed after treatment highlights the importance of appropriate diagnosis and treatment of NP.
Key words: Neuropathic pain, lumbar surgery, spine, HRQoL, LANSS, prevalence Pain Physician 2015; 18:E889-E897
Observational Study
Prevalence of Neuropathic Pain in Patients
Scheduled for Lumbar Spine Surgery:
Nationwide, Multicenter, Prospective Study
From: 1Gangnam Severance Spine Hospital, Spine and Spinal Cord Institute, Department of Neurosurgery, Yonsei University College of Medicine, Seoul, Korea; 2Orthopedic Clinic, Severance Hospital, Yonsei University College of Medicine, Seoul, Korea; 3Orthopedic Clinic, Asan Medical Center, University of Ulsan College of Medicine, Seoul, Korea Address Correspondence:
Yong Eun Cho, MD, PhD Clinical Assistant Professor Department of Neurosurgery, Spine and Spinal Cord Institute, Gangnam Severance Hospital, Spine Center Yonsei University College of
Medicine, 712, Eonjuro, Gangnam-gu, Seoul, South Korea E-mail: [email protected] Disclaimer: This study was supported by Pfizer Pharmaceuticals Korea Ltd. We like to thank all 44 orthopaedic or spinal neurosurgical investigators for allowing us to conduct this articles and their support as well. Manuscript received: 02-01-2015 Revised manuscript received: 04-02-2015 Accepted for publication: 04-27-2015 Free full manuscript: www.painphysicianjournal.com
Kyung Hyun Kim, MD1, Seong-Hwan Moon, MD, PhD2, Chang-Ju Hwang, MD, PhD3, and Yong Eun Cho, MD, PhD1
T
he number of surgical interventions of the spine has increased yearly by 77% between 1996 and 2001 in the United States and this increased demand for costly surgical procedures represents achallenge for any health care system (1). Although there are numerous studies in this area, surgical decision-making for degenerative lumbar diseases such as intervertebral disc herniation, spinal stenosis,
1,109 patients were enrolled and completed the whole process without dropout from 44 participating spinal centers (both orthopedics and neurosurgeons) in Ko-rea. The protocols were approved by the institutional review board (IRB) of the Gangnam Severance Hospi-tal (3-2011-0223) prior to patient enrollment. Written informed consent was obtained from each patient before the initiation of the lumbar spinal surgery. All patients who are waiting for operation schedules were screened consecutively at each hospital accord-ing to inclusion criteria and inclusion criteria were as follows: age over 18, patients with degenerative lumbar disease who were scheduled for lumbar spinal surgery. Baseline demographics data of the 2 groups are presented in Table 1.
Patients were divided into 2 groups (patients with or without NP). The detailed method is described in the instruments section below. For intergroup comparison, preoperative diagnosis are categorized into 4 groups: lumbar stenosis with segmental instability or without instability, herniated lumbar disc, and degenerative lumbar scoliosis. We also screened all concomitant diseases of patients which could be another source of NP such as diabetes mellitus, herpetic zoster, traumatic injury, amputation, cancer, stroke, and AIDS.
2.2. Instruments
2.2.1. Assessment and Diagnosis of Neuropathic Pain
NP was diagnosed by using the Leeds Assessment of Neuropathic Symptoms and Signs (LANSS) Pain Scale, and patients for the NP group were assigned with a LANSS pain scale over 12 points. Detailed com-ponents of this scale are described in Fig. 1. Patients were screened using the LANSS scale and divided into 2 groups before surgery: patients with NP (NP+) or pa-tients without NP (NP-). Also the Pain Numeric Rating Scale (NRS) was used to evaluate pain intensity (1 – 3 mild pain, 4 – 6 moderate pain and 7 – 10 severe pain).
2.2.2. Assessment of Health Related Quality of Life and Risk Factors for Neuropathic Pain
Patients’ HRQoL was measured using the following general questionnaires: the EuroQoL (EQ-5D), EuroQoL Visual Analogue Scale (EQ-VAS), and Short Form-36 (SF-36). EQ-5D scores ranged from 0 to 1, EQ-VAS and SF-36 scores ranged from 0 to 100, with higher scores indi-cating better health status. The EQ-5D consisted of the EQ-5D descriptive system and the EQ visual analogue and segmental instability are mainly dependent on
the physician (2) and there are geographic variations in the number of spinal procedures also (3). The 2005 Cochrane review reported limited conclusions of surgical efficacy for spinal stenosis because of heterogeneity and insufficient evidence (4,5). However, 2 multicenter clinical comparative studies concluded that surgical intervention for degenerative spondylolisthesis and degenerative spinal stenosis showed a superior clinical outcome including both pain and health related quality of life (HRQoL) than a nonsurgical management (6,7).
Chronic pain due to lumbar spinal disorders affects large numbers of people worldwide and is unquestion-ably a public health care issue. Neuropathic pain (NP) is one type of a refractory chronic pain condition (8). The annual incidence of NP has been reported to be 0.82% (9) and the prevalence of neuropathic characteristics with chronic pain has been reported to be 6.9% in the general population (10). The medical treatment for NP often fails to relieve pain and symptoms persists. These painful conditions often reduce the quality of life and limit the activities of daily living (11,12). The health care costs for the management of NP are substantial. A re-cent study in the United States showed that the cost for patients with NP was 3-fold that of age- and gender-matched patients without NP (13). The most common locations of chronic NP are the back and legs and 10 – 40% of patients treated with lumbar spinal surgery to reduce their neuropathic radicular pain suffered from recurrent or persistent pain (14,15). However there is limited evidence about surgical outcomes after lumbar spinal surgery in patients with NP or the prevalence of NP proportions among patients with degenerative lumbar diseases who are candidates for a surgical inter-vention. The objectives of this study were to investigate the prevalence of NP among the patients scheduled for lumbar spinal surgery and the relationship between HRQoL and NP. We also tried to find out the risk factors related to NP and to compare the clinical outcomes and the impact on the quality of life after surgical treat-ment in patients with and without NP.
M
ethods2.1. Study Design and Patients
This study was a prospective cross-sectional, multi-center observational study. It was conducted from Sep-tember 2011 to May 2013 and patients were recruited from September 2011 to December 2012. A total of
scale (EQ-VAS) and could be used to evaluate surgical outcomes of spine surgery (16). The EQ-5D descriptive system comprised the following 5 dimensions: mobility, self-care, usual activities, pain/discomfort, and anxiety/ depression. Each dimension had 3 levels: no problem was scored as one, some problems were scored as 2, and severe problems were scored as 3. The EQ VAS was designed to assess patients’ self-rated health on a visual analog scale (VAS), which ranged from 0 (worst imagin-able health state) to 100 (best imaginimagin-able health state) (16). These instruments (LANSS, VAS, EQ-5D, EQ VAS, and SF-36) were completed by the participants on the day before surgery, and one week and 3 months after surgery.
The patient variables included gender, age, pre-operative symptom duration, surgical techniques, and preoperative diagnosis with regard to the risk factors for NP. Surgical techniques were subdivided into instru-mented fusion and non-instruinstru-mented decompression.
The preoperative diagnosis was classified into stenosis with or without instability, herniated lumbar disc, and degenerative lumbar scoliosis. Using these patient variables, we conducted logistic regression analysis for exploring risk factors for NP.
2.3. Statistical Analysis
All data were analyzed using SAS version 9.2 (SAS Institute, Cary, North Carolina). For all analyses, a P-value less than 0.05 was defined as statistically sig-nificant. For the intergroup demographic comparison, Students’ t-test was used for variables such as age and preoperative duration of symptoms and chi-square test was used for variables such as gender, preopera-tive diagnosis, and concomitant disease. Additionally, a logistic regression analysis was used to evaluate the relationship between NP and patient variables such as gender, age, preoperative symptom duration, surgical techniques, and preoperative diagnosis.
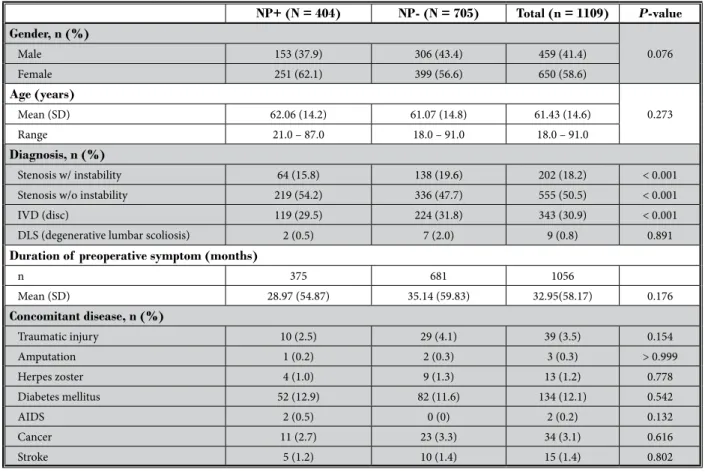
Table 1. Patients’ baseline demographics.
NP+ (N = 404) NP- (N = 705) Total (n = 1109) P-value Gender, n (%) 0.076 Male 153 (37.9) 306 (43.4) 459 (41.4) Female 251 (62.1) 399 (56.6) 650 (58.6) Age (years) 0.273 Mean (SD) 62.06 (14.2) 61.07 (14.8) 61.43 (14.6) Range 21.0 – 87.0 18.0 – 91.0 18.0 – 91.0 Diagnosis, n (%) Stenosis w/ instability 64 (15.8) 138 (19.6) 202 (18.2) < 0.001 Stenosis w/o instability 219 (54.2) 336 (47.7) 555 (50.5) < 0.001
IVD (disc) 119 (29.5) 224 (31.8) 343 (30.9) < 0.001
DLS (degenerative lumbar scoliosis) 2 (0.5) 7 (2.0) 9 (0.8) 0.891
Duration of preoperative symptom (months)
n 375 681 1056 Mean (SD) 28.97 (54.87) 35.14 (59.83) 32.95(58.17) 0.176 Concomitant disease, n (%) Traumatic injury 10 (2.5) 29 (4.1) 39 (3.5) 0.154 Amputation 1 (0.2) 2 (0.3) 3 (0.3) > 0.999 Herpes zoster 4 (1.0) 9 (1.3) 13 (1.2) 0.778 Diabetes mellitus 52 (12.9) 82 (11.6) 134 (12.1) 0.542 AIDS 2 (0.5) 0 (0) 2 (0.2) 0.132 Cancer 11 (2.7) 23 (3.3) 34 (3.1) 0.616 Stroke 5 (1.2) 10 (1.4) 15 (1.4) 0.802
Students’ t-test was used for variables such as age and preoperative duration of symptoms and chi-square test was used for variables such as gender, preoperative diagnosis, and concomitant disease.
3. R
esults3.1. Intergroup Comparison for Clinical Characteristics of Participants
In totally 1,109 patients with 459 (41.4%) men and 650 (58.6%) women were enrolled in this study. Out of 1,109 recruited patients, 404 (36.4%) patients were diagnosed as NP+ based on LANSS scale ≥ 12 and 705 patients were diagnosed and classified as NP- group based on LANSS scale < 12. Detailed baseline clinical characteristics and demographic data are described in Table 1. The mean age was 62.06 years in the NP+ group and 61.07 years in the NP- group. The mean pre-operative symptom duration was 28.97 months for the NP+ group, which was shorter than in the NP- group with 35.14 months, but without statistical significance (P = 0.176). Also there was no statistical significant dif-ference between groups with regard to gender, age, preoperative symptom duration, and the frequency of
concomitant disease which could be another source of NP (Table 1). In terms of preoperative diagnosis, the number of patients with lumbar stenosis with instabil-ity was significantly higher in the NP- group than in the NP+ group (15.8% vs. 19.6%), the number of patients with lumbar stenosis without instability was signifi-cantly higher in the NP+ group than in the NP- group (54.2% vs. 47.7%), and the number of patients with herniated lumbar disc was significantly higher in the NP- group than in the NP+ group (29.5% vs. 31.8%).
3.2. Intergroup Comparison for Surgical Outcome including LANSS, NRS, EQ5D, EQ5D-VAS, and SF-36
The mean LANSS scores of baseline, one week after surgery, and 3 months after surgery in the NP+ group were higher than in the NP- group (17.44 vs. 6.03, 6.28 vs. 2.87, and 3.07 vs. 1.95, respectively, P < 0.000). How-ever, except the baseline score, all mean LANSS scores of both groups showed less than 12 during the follow-up which is adhering to the diagnostic guideline for NP (Table 2). With regard to pain improvement, the NRS at baseline was significantly higher in the NP+ group than in the NP- group (7.50 vs. 7.21, P = 0.018), although NRS at one week and 3 months follow-up revealed no sig-nificant differences between NP+ and NP- (4.00 vs. 3.79,
P = 0.113, 2.59 vs. 2.81, P = 0.087, respectively, Table
2). In terms of functional outcomes including HRQoL such as EQ5D, EQ5D-VAS, and SF-36, both, EQ5D and EQ5D-VAS at baseline implied a worse health status in NP+ than in NP- (0.49 vs. 0.55, P = 0.000, 49.88 vs. 56.55,
P = 0.000, respectively, Table 2). However, during the
follow-up period, both EQ5D and EQ5D-VAS showed no statistical differences between the groups except a higher EQ5D at 3 months follow-up in NP+ than in NP- (0.86 vs. 0.84, P = 0.029, Table 2).
Additionally, we performed a SF-36 survey in all pa-tients at baseline and 3 months follow-up after surgery (Fig.1). At baseline survey, NP+ showed consistently lower SF-36 scores than NP- in all dimensions except the general health dimension, indicating a poorer HRQoL preoperatively. Baseline mean scores, obtained on the physical component summary (PCS) (34.78) and mental component summary (MCS) (52.11) scales of NP + (Fig.1) were significantly lower than in NP- (37.86; 55.84, re-spectively, P < 0.001, Fig.1). At 3 months follow up-after surgery, scores of dimensions such as physical function-ing, role physical, bodily pain, vitality, and emotional role were higher in NP+ than in NP-, although the scores of dimensions such as general health and social func-Table 2. Differences in various clinical outcome between
neuropathic pain (NP+) group and nociceptive pain group (NP-)
NP+ (N = 404)
Mean ± SD NP- (N = 705) Mean ± SD P-value LANSS Baseline 17.44 ± 4.06 6.03 ± 3.52 < 0.001 1 week F/U 6.28 ± 6.48 2.87 ± 3.75 < 0.001 FU 3M 3.07 ± 4.78 1.95 ± 3.41 < 0.001 NRS Baseline 7.50 ± 1.88 7.21 ± 2.00 0.018 1 week F/U 4.00 ± 2.06 3.79 ± 2.16 0.113 FU 3M 2.59 ± 1.89 2.81 ± 2.13 0.087 EQ5D Baseline 0.49 ± 0.29 0.55 ± 0.25 < 0.001 1 week F/U 0.76 ± 0.17 0.75 ± 0.18 0.414 FU 3M 0.86 ± 0.16 0.84 ± 0.15 0.029 EQ-VAS Baseline 49.88 ± 22.13 56.55 ± 20.40 < 0.001 1 week F/U 66.77 ± 16.39 68.43 ± 16.83 0.112 FU 3M 75.84 ± 17.15 74.74 ± 16.17 0.288 Data are mean ± standard deviation. Outcome results at each follow up were compared between 2 groups with independent-sample t test. LANSS, Leeds assessment of neuropathic symptoms and signs; NRS, numeric rating scale; EQ-5D, EQ-5D VAS; NP+, neuropathic pain+;
tioning of both groups showed no differences. Mean scores obtained at 3 months follow-up on the physical component summary (PCS) scales of NP+ were signifi-cantly higher than in NP- (64.45 vs. 61.71, respectively, P = 0.009, Fig.1). However, there were no significant dif-ferences between the mean scores of NP+ and NP- on the mental component summary (MCS) scales (67.71 vs. 67.31, respectively, P = 0.616, Fig.1).
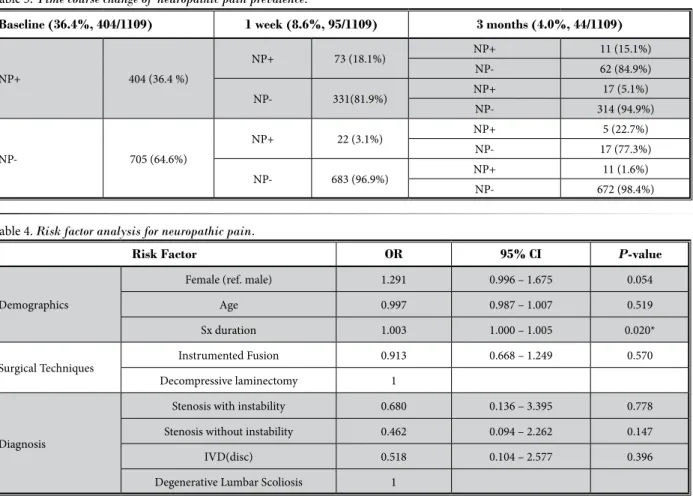
3.3. Time Course Change of Neuropathic Pain Prevalence
According to the stepwise survey during the follow-up (Table 3), the overall prevalence of NP has decreased during the follow-up period (36.4% at baseline, 8.6% at one week follow-up, and 4.0% at 3 months follow-up). Of 404 patients with NP, 331 patients (81.9%, 331/404) turned into the NP- group which means their LANSS scores were lower than 12. Finally at 3 months
follow-Fig.1. Differences in Short-Form 36 (SF-36) data between neuropathic pain (NP+) group and nociceptive pain group (NP-).
At baseline survey, NP+ showed consistently lower SF-36 scores than NP- in all dimensions except general health dimension, indicating a poorer HRQoL preoperatively. At 3 months follow-up after surgery, scores of all dimensions except general health and social functioning were higher in NP+ than in NP-.
Data are mean ± standard deviation. Outcome results at each follow-up were compared between 2 groups with independent-sample t test. SF-36, Short-Form 36; NP+, neuropathic pain+; NP-, neuropathic pain-; FU 3M, follow-up at 3 months after operation. * P < 0.05.
up, only 28 patients (6.9%, 28/404) suffered from rem-nant NP. Of 705 patients (64.6 %) without preoperative NP, 22 patients at one week follow-up and 11 patients at 3 months follow-up (4.7%, 33/705) showed newly developed NP which was probably surgically related. However, during the follow-up period, 17 (77.3%) out of 22 patients with newly developed NP turned into the NP- group although 689 (17 + 672/705, 97.7%) out of 705 patients without NP preoperatively did not have NP at 3 months follow-up after surgery.
3.4. Risk Factor Analysis for Neuropathic Pain
Logistic regression analysis was conducted for in-vestigating the relationship between NP and patient variables such as demographics (age, gender, and pre-operative symptoms), surgical techniques (instrumented fusion and decompressive laminectomy), and preopera-tive diagnosis (stenosis with instability, stenosis without
instability, herniated lumbar disc, and degenerative lumbar scoliosis) (Table 4). None of preoperative di-agnosis and surgical technique was statistically associ-ated with NP. Among demographic variables, a longer preoperative symptom period was significantly related with NP (OR 1.003, P = 0.020, Table 4).
4. d
iscussionWe investigated in a multicenter cross-sectional observational study with prospective 3 months follow-up data from 1,109 patients who were scheduled for lumbar spinal surgery, the prevalence and its immedi-ate postoperative change after surgery, and the risk factors for NP. To the best of our knowledge, this is the first study about the prevalence of NP in surgically in-dicated patients with degenerative lumbar disease and the HRQoL after surgery in patients with NP compared to patients with nociceptive pain, although there are many articles about epidemiology and incidence of NP
in patients with chronic low back pain or spinal disor-der including all the pathology such as cervical disease, spinal cord injury, or failed back surgery syndrome and its impact on the HRQoL (17-20). Besides that, we also conducted a short-term longitudinal prospective follow-up survey for the clinical course of NP after sur-gical treatment.
NP is a prevalent and often underdiagnosed condi-tion estimated to affect up to 2% to 3% of the gen-eral population (18,21-23). Particularly in patients with chronic low back pain, the prevalence of NP was much higher than in the general population (20,24,25). El Sissi W et al (20) reported a 55% prevalence rate among 1,134 patients with chronic low-back pain in the Ara-bian Gulf Region assessed using the LANSS scale and Hassan AE et al (24) also published similar results that 41% of patients with chronic low back pain had scores over 12 using the LANSS in the Saudi Arabian popula-tion. Although, according to Yamashita T et al (25) the Table 3. Time course change of neuropathic pain prevalence.
Baseline (36.4%, 404/1109) 1 week (8.6%, 95/1109) 3 months (4.0%, 44/1109)
NP+ 404 (36.4 %) NP+ 73 (18.1%) NP+ 11 (15.1%) NP- 62 (84.9%) NP- 331(81.9%) NP+ 17 (5.1%) NP- 314 (94.9%) NP- 705 (64.6%) NP+ 22 (3.1%) NP+ 5 (22.7%) NP- 17 (77.3%) NP- 683 (96.9%) NP+ 11 (1.6%) NP- 672 (98.4%)
Table 4. Risk factor analysis for neuropathic pain.
Risk Factor OR 95% CI P-value
Demographics
Female (ref. male) 1.291 0.996 – 1.675 0.054
Age 0.997 0.987 – 1.007 0.519
Sx duration 1.003 1.000 – 1.005 0.020*
Surgical Techniques Instrumented Fusion 0.913 0.668 – 1.249 0.570
Decompressive laminectomy 1
Diagnosis
Stenosis with instability 0.680 0.136 – 3.395 0.778 Stenosis without instability 0.462 0.094 – 2.262 0.147
IVD(disc) 0.518 0.104 – 2.577 0.396
Degenerative Lumbar Scoliosis 1
* P < 0.05, a logistic regression analysis was used to evaluate the relationship between neuropathic pain and candidate variables such as gender, age, preoperative symptom duration, surgical techniques, and preoperative diagnosis.
overall incidence of NP was 53.5% in patients with chronic pain related to spinal disorders. These results, at a much higher rate than expected, were mainly as-sociated with cervical spondylotic myelopathy or spinal cord injury. They reported an incidence of NP among the patients with low back pain of 29.4% and in pa-tients with spondylolysis or spondylolisthesis of 40.4% (25). In our survey, 404 out of 1,109 participants (36.4%) were diagnosed with NP according to the LANSS scale and these results were similar to previous results more specifically compared in degenerative lumbar diseases. Attal et al (26) demonstrated that the NP proportion of patients with chronic low back pain was the highest in those who underwent surgical procedures and postu-lated that it could be the results of lesions of nocicep-tive sprouts, postsurgical scars, and local nerve lesions. Even in our highly selected patients without a history of surgery on their spine, cord injury, and cervical pa-thology, the prevalence of NP in this study was higher than in the general population and similar to results of patients in previous articles (20,24,25).
The impact of NP (of different origin) on HRQoL has been the focus of a recent study (12), which reviewed 52 high-quality published reports on this subject. In conclusion the authors found strong evidence that the presence (and severity) of NP is associated with greater impairments in a number of HRQoL domains. Regard-less of NP, the HRQoL in patients waiting for spinal or musculoskeletal surgery was lower than in the general population (27). In the present investigation, EQ5D, EQ5D-VAS, and all domain scores of SF-36 in patients with NP were significant lower than in patients with nociceptive pain at baseline preoperative survey. With regard to HRQoL domains dependent on pain, such as physical functioning, physical role, and bodily pain, absolute values of these domain score were lower than 40 as expected. However, absolute values of HRQoL domains mainly affected by mental components such as social functioning, emotional role, and emotional health showed relatively higher than physical com-ponents. Jensen et al (12) reported that weaker asso-ciations were found between NP and measures of the quality of patients’ social relationships than between NP and measures of other HRQoL domains. Patients with chronic disease processes are able to adapt to their physical situation so that their mental function is not as affected as their physical function (28,29). Our results could be partly explained by the reasons cited above. Also the above results indicate that psychosocial and behavioral treatments for the mental component of
NP could be helpful for the improvement of the mental HRQoL.
We conducted this study to confirm the hypothesis that patients with NP related to degenerative lumbar disorder have poorer surgical results than patients with nociceptive pain. Our 3 months follow-up data after spinal surgery showed significant improvements in both groups. In the physical component summary at 3 months follow-up, patients with NP had significantly higher scores than patients with nociceptive pain even though baseline scores are contradictory. However, in the mental component summary at 3 months follow-up, there were no significant differences between the 2 groups. We conducted a short-term longitudinal study for prevalence of NP and found a significant decrease at one week and 3 months after surgery. Although the incidence rate was similar to the general popula-tion (2.3 – 6.9%) (10), the recovery rate was relatively lower than the disease-related NP with regard to the surgical procedure related NP, that is, newly developed NP after surgery. There are few references to compare those results about the time course change of neuro-pathic prevalence, thus these results could be useful for counseling and informing the patients about surgical outcomes or natural history. Krishna et al (30) described that complications after posterior lumbar fusion sur-gery and postoperative neuralgic symptom happened in 7.1% of patients.
In terms of risk factors for NP, we included several candidates such as age, gender, preoperative duration of symptom, preoperative diagnosis, and surgical tech-nique. According to the logistic regression analysis, female gender and longer duration of preoperative symptoms are risk factors for NP. However, age, surgical technique, and preoperative diagnosis were not asso-ciated with NP. Older age, female gender, lower level of education, and more disability before surgery are reported risk factors in previous articles (31,32). Peul et al (33) quantified the relationship between gender and rate of recovery and outcome at one year after lumbar surgery and found that women showed slower recovery rates and higher rates of unsatisfactory results. Yamashita T et al (25) reported that advanced age, se-vere preoperative pain, disease duration over 6 months, and a cervical-level lesion are risk factors for NP. Except age and level of lesion, their results are consistent with our findings.
This study has several strengths, including the highly selected study patients, no drop outs, and the longitudinal follow-up of NP prevalence. Despite this,
R
efeRences1. Deyo RA, Nachemson A, Mirza SK. Spinal-fusion surgery - the case for re-straint. N Engl J Med 2004; 350:722-726. 2. Overdevest GM, Luijsterburg PA, Brand
R, Koes BW, Bierma-Zeinstra SM, Eek-hof JA, Vleggeert-Lankamp CL, Peul WC. Design of the Verbiest trial: cost-ef-fectiveness of surgery versus prolonged conservative treatment in patients with lumbar stenosis. BMC Musculoskelet
Disord 2011; 12:57.
3. Ciol MA, Deyo RA, Howell E, Kreif S. An assessment of surgery for spinal steno-sis: Time trends, geographic variations, complications, and reoperations. J Am
Geriatr Soc 1996; 44:285-290.
4. Atlas SJ, Keller RB, Robson D, Deyo RA, Singer DE. Surgical and nonsurgical management of lumbar spinal steno-sis: Four-year outcomes from the maine lumbar spine study. Spine (Phila Pa 1976) 2000; 25:556-562.
5. Atlas SJ, Deyo RA, Keller RB, Chapin AM, Patrick DL, Long JM, Singer DE. The Maine Lumbar Spine Study, Part III. 1-year outcomes of surgical and nonsur-gical management of lumbar spinal ste-nosis. Spine (Phila Pa 1976) 1996; 21:1787-1794; discussion 1794-1785.
6. Weinstein JN, Tosteson TD, Lurie JD, Tosteson AN, Blood E, Hanscom B, Herkowitz H, Cammisa F, Albert T, Boden SD, Hilibrand A, Goldberg H, Berven S, An H. Surgical versus nonsur-gical therapy for lumbar spinal stenosis.
N Engl J Med 2008; 358:794-810.
7. Weinstein JN, Lurie JD, Tosteson TD, Hanscom B, Tosteson AN, Blood EA, Birkmeyer NJ, Hilibrand AS, Herkowitz H, Cammisa FP, Albert TJ, Emery SE, Lenke LG, Abdu WA, Longley M, Errico TJ, Hu SS. Surgical versus nonsurgi-cal treatment for lumbar degenerative spondylolisthesis. N Engl J Med 2007; 356:2257-2270.
8. Cruccu G, Aziz TZ, Garcia-Larrea L, Hansson P, Jensen TS, Lefaucheur JP, Simpson BA, Taylor RS. EFNS guide-lines on neurostimulation therapy for neuropathic pain. Eur J Neurol 2007; 14:952-970.
9. Dieleman JP, Kerklaan J, Huygen FJ, Bouma PA, Sturkenboom MC. Incidence rates and treatment of neuropathic pain conditions in the general population.
Pain 2008; 137:681-688.
10. Bouhassira D, Lanteri-Minet M, Attal N, Laurent B, Touboul C. Prevalence of chronic pain with neuropathic charac-teristics in the general population. Pain 2008; 136:380-387.
11. Manca A, Eldabe S, Buchser E, Kumar K, Taylor RS. Relationship between health-related quality of life, pain, and function-al disability in neuropathic pain patients with failed back surgery syndrome. Value
Health 2010; 13:95-102.
12. Jensen MP, Chodroff MJ, Dworkin RH. The impact of neuropathic pain on health-related quality of life: Re-view and implications. Neurology 2007; 68:1178-1182.
13. Berger A, Dukes EM, Oster G. Clinical characteristics and economic costs of patients with painful neuropathic disor-ders. J Pain 2004; 5:143-149.
14. Dworkin RH, Backonja M, Rowbotham MC, Allen RR, Argoff CR, Bennett GJ, Bushnell MC, Farrar JT, Galer BS, Hay-thornthwaite JA, Hewitt DJ, Loeser JD, Max MB, Saltarelli M, Schmader KE, Stein C, Thompson D, Turk DC, Wal-lace MS, Watkins LR, Weinstein SM. Ad-vances in neuropathic pain: Diagnosis, mechanisms, and treatment recommen-dations. Arch Neurol 2003; 60:1524-1534. 15. Wilkinson HA. Spinal cord stimulation
versus reoperation for failed back sur-gery syndrome: A cost effectiveness and cost utility analysis based on a
random-ized, controlled trial. Neurosurgery 2008; 63:E376; author reply: E376.
16. Jansson KA, Nemeth G, Granath F, Jons-son B, Blomqvist P. Health-related qual-ity of life (EQ-5D) before and one year after surgery for lumbar spinal stenosis.
J Bone Joint Surg Br 2009; 91:210-216.
17. Hall GC, Morant SV, Carroll D, Gabriel ZL, McQuay HJ. An observational de-scriptive study of the epidemiology and treatment of neuropathic pain in a UK general population. BMC Fam Pract 2013; 14:28.
18. Hall GC, Carroll D, Parry D, McQuay HJ. Epidemiology and treatment of neuro-pathic pain: The UK primary care per-spective. Pain 2006; 122:156-162. 19. Schwartzman RJ, Grothusen J, Kiefer TR,
Rohr P. Neuropathic central pain: Epi-demiology, etiology, and treatment op-tions. Arch Neurol 2001; 58:1547-1550. 20. El Sissi W, Arnaout A, Chaarani MW,
Fouad M, El Assuity W, Zalzala M, Dershaby YE, Youseif E. Prevalence of neuropathic pain among patients with chronic low-back pain in the Arabian Gulf Region assessed using the leeds assessment of neuropathic symptoms and signs pain scale. J Int Med Res 2010; 38:2135-2145.
21. Bennett GJ. Neuropathic pain: New in-sights, new interventions. Hosp Pract
(1995) 1998; 33:95-98, 101-104, 107-110
passim.
22. Gilron I, Watson CP, Cahill CM, Moulin DE. Neuropathic pain: A practical guide for the clinician. CMAJ 2006; 175:265-275. 23. Torrance N, Smith BH, Bennett MI, Lee
AJ. The epidemiology of chronic pain of predominantly neuropathic origin. Re-sults from a general population survey. J
Pain 2006; 7:281-289.
24. Hassan AE, Saleh HA, Baroudy YM, Ab-dul-Rahman KI, Najjar MW, Kazi MS, El-Gazar MA, Hafez MA, Abdullah MA, several limitations should be noted also. First, a
short-term follow-up of less than 3 months is not enough to thoroughly figure out the time course change of NP prevalence and the clinical outcome or the natural history of the newly developed NP. Further long-term follow-up research is therefore required. Second, we did not analyze psychosocial factors and social factors such as occupation and economic status, and preopera-tive pain severity as variables for NP.
c
onclusionGiven our results, NP is highly prevalent in patients with surgically indicated degenerative lumbar disorders and patients with NP showed a close relationship with lower HRQoL. However, contrary to our expectations, the surgical treatment revealed a significant improve-ment on pain and HRQoL in both groups.
Abdul-Rahman YA, Youseif EA. Preva-lence of neuropathic pain among pa-tients suffering from chronic low back pain in Saudi Arabia. Saudi Med J 2004; 25:1986-1990.
25. Yamashita T, Takahashi K, Yonenobu K, Kikuchi S. Prevalence of neuropathic pain in cases with chronic pain related to spinal disorders. J Orthop Sci 2014; 19:15-21.
26. Attal N, Perrot S, Fermanian J, Bouhas-sira D. The neuropathic components of chronic low back pain: a prospective multicenter study using the DN4 Ques-tionnaire. J Pain 2011; 12:1080-1087. 27. Becerra Fontal JA, Bago Granell J, Garre
Olmo J, Roig Busquets R, Peris Prats F,
Villanueva Leal C. Evaluation of health-related quality of life in patients candi-date for spine and other musculoskeletal surgery. Eur Spine J 2013; 22:1002-1009. 28. Singer MA, Hopman WM, MacKenzie
TA. Physical functioning and mental health in patients with chronic medical conditions. Qual Life Res 1999; 8:687-691. 29. Schlenk EA, Erlen JA, Dunbar-Jacob J,
McDowell J, Engberg S, Sereika SM, Ro-hay JM, Bernier MJ. Health-related qual-ity of life in chronic disorders: A com-parison across studies using the MOS SF-36. Qual Life Res 1998; 7:57-65. 30. Krishna M, Pollock RD, Bhatia C.
Inci-dence, etiology, classification, and
man-agement of neuralgia after posterior lumbar interbody fusion surgery in 226 patients. Spine J 2008; 8:374-379. 31. Kehlet H, Jensen TS, Woolf CJ. Persistent
postsurgical pain: risk factors and pre-vention. Lancet 2006; 367:1618-1625. 32. den Boer JJ, Oostendorp RA, Beems T,
Munneke M, Evers AW. Continued dis-ability and pain after lumbar disc sur-gery: The role of cognitive-behavioral factors. Pain 2006; 123:45-52.
33. Peul WC, Brand R, Thomeer RT, Koes BW. Influence of gender and other prognostic factors on outcome of sci-atica. Pain 2008; 138:180-191.