Gadoxetic acid-enhanced
Hepatobiliary Phase MR imaging of
Hepatocellular carcinoma (HCC):
Correlation with Histological
Characteristics
Jin-Young Choi
Department of Medicine
2
Gadoxetic acid-enhanced
Hepatobiliary Phase MR imaging of
Hepatocellular carcinoma (HCC):
Correlation with Histological
Characteristics
Directed by Professor Myeong-Jin Kim
The Doctoral Dissertation
submitted to the Department of Medicine,
the Graduate School of Yonsei University
in partial fulfillment of the requirements for the degree of
Doctor of Philosophy
Jin-Young Choi
3
This certifies that the Doctoral Dissertation
of Jin-Young Choi is approved.
--- Thesis Supervisor: Myeong-Jin Kim
--- Sun Kook Yoo
--- Young Nyun Park
--- Jeong Min Lee
--- Sun Young Rha
The Graduate School
Yonsei University
4
ACKNOWLEDGEMENTS
I would like to express my deepest gratitude to my thesis
supervisor prof. Myeong-Jin Kim. He has inspired me to strive for
excellence not only through the course of this thesis but also in
everyday practice. I also acknowledge helpful comments from
prof. Young Nyun Park, prof. Sun Kook Yoo, prof. Sun Young
Rha, and prof. Jeong Min Lee. They have helped me with sincere
direction, encouragements, advices, and revisions from the start
of my research to the finish of writing this thesis.
My grateful thanks also are extended to my colleagues,
prof. Jae Yeon Seok, prof. Joon Seok Lim, prof. Mi-Suk Park,
prof. Min Jeong Kim for helping me in reviewing this thesis. This
thesis would not have been possible without their kind help.
Finally, I am deeply indebted to my parents and my wife
who inspired me to undergo further efforts during the writing of
this thesis.
5
CONTENTS
ABSTRACT………1
I. INTRODUCTION………3
II. MATERIALS AND METHODS………..……...5
III. RESULTS………..……….……….13
IV. DISCUSSION………...24
V. CONCLUSION………...……….28
REFERENCES………..………29
6
LIST OF FIGURES
Figure 1. Methods to measure the signal intensity of the lesions
using an operator-defined region of interest (ROI)
··· 10
Figure 2. The relationship between CNR ratio and histologic
grade ···15
Figure 3. The relationship between CNR of the precontrast
images and histologic grade···16
Figure 4. The relationship between contrast enhancement ratio
(CER) of the tumor and histologic grade··· 17
Figure 5. The relationship of the ratios of the cell densities of the
HCC to nonneoplastic liver tissue and contrast
enhancement ratio (CER)···18
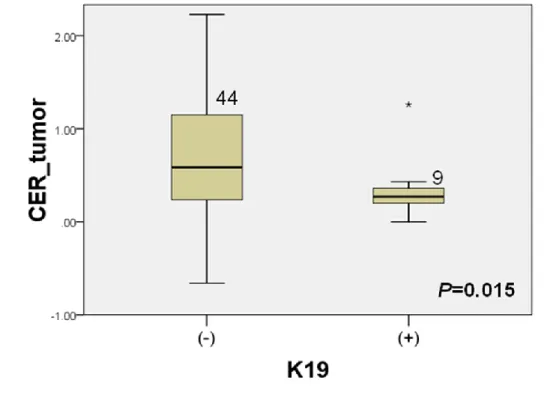
Figure 6. The relationship of contrast enhancement ratio (CER) of
HCC and immunoreactivity to Hep Par 1, K7, and
K19···20-22
Figure 7. A 37-year-old woman with grade II HCC showing low
signal intensity on hepatobiliary phase with gadoxetic
acid ···23
7
LIST OF TABLES
Table 1. The parameters of magnetic resonance imaging···7
1 <ABSTRACT>
Gadoxetic acid-enhanced Hepatobiliary Phase MR imaging of
Hepatocellular carcinoma (HCC): Correlation with Histological
Characteristics
Jin-Young Choi
Department of Medicine
The Graduate School, Yonsei University
(Directed by Professor Myeong-Jin Kim)
PURPOSE: The purpose of this study was to assess whether gadoxetic
acid-enhanced hepatobiliary phase magnetic resonance (MR) imaging could predict the histologic factors of the HCCs.
MATERIALS AND METHODS:
Fifty three HCCs histopathologically proved by surgery in 51 patients were retrospectively evaluated. All patients underwent gadoxetic acid-enhanced MR imaging prior to surgical resection. The differences of contrast enhancement ratio (CERs) of lesion and liver and CNR ratio between histologic grades of the HCC were compared by using an analysis of variance test. Pearson test was performed to determine the correlation among CERs, CNR ratio of the tumor, cell density ratio,
2
antihepatocyte antibody (Hep Par 1), keratin 7 (K7), and keratin 19 (K19).
RESULTS:
Of 53 HCCs, 50 HCCs showed low signal intensity on hepatobiliary phase. The CNR ratio of well-differentiated HCC were significantly different from that of moderately and poorly-differentiated HCCs (P=0.032). There was no statistical significance between CER of the tumors and histologic grade (P=0.414). The CER of the tumor were significantly lower in K19 positive group than K19 negative group (P= 0.015). There was no significant correlation among CER, CNR ratio of the tumors, Hep Par 1 positivity, cell density ratio, and K7 (P>0.05).
CONCLUSION:
Tumor-to-liver CNR on gadoxetic acid-enhanced hepatobiliary phase MR imaging can be helpful for differentiating well-differentiated HCCs from moderate and poorly differentiated HCCs. The CER was significantly lower in K19 positive HCCs.
3
Gadoxetic acid-enhanced Hepatobiliary Phase MR imaging of
Hepatocellular carcinoma (HCC): Correlation with Histological
Characteristics
Jin-Young Choi
Department of Medicine
The Graduate School, Yonsei University
(Directed by Professor Myeong-Jin Kim)
Ⅰ. INTRODUCTION
Hepatocellular carcinoma (HCC) is the fifth most common tumor in the world and the incidence of HCC has risen rapidly especially in the western countries 1-2. Imaging diagnosis of HCC is essential for treatment planning and management. Contrast-enhanced ultrasound, contrast-enhanced computed tomography (CT), and magnetic resonance imaging (MRI), have made it possible to detect and characterize HCC accurately. Among them, MR imaging has been reported to be an excellent imaging modality due to its high tissue contrast and use of tissue specific contrast agents 3-9. Various liver-specific MR contrast agents have been introduced to increase the accuracy of hepatic imaging. Superparamagnetic iron oxide (SPIO) is taken up by cells of the reticuloendothelial system, resulting in
4
signal intensity loss on T2-weighted MR imaging due to susceptibility effects of iron 10. Hepatobiliary contrast agents are T1 contrast agents that are partially taken up by hepatocytes, excreted through the biliary system, and produce positive enhancement of normal hepatic tissue 11.
Recently, gadoxetic acid disodium (gadolinium-ethoxybenzyl-diethylenetriamine pentaacetic acid [Gd-EOB-DTPA], Primovist; Bayer-Schering Pharma, Germany) has been approved for hepatic imaging and used in clinical practice 12-18. Gadoxetic acid has the property of both extracellular and hepatobiliary contrast agents. It is taken up by functioning hepatocytes and excreted into bile up to 50% 14, 16, 19-21. It is well known that not only normal hepatocytes, but also hepatocyte-derived tumor cells, take up gadoxetic acid. Therefore, gadoxetic acid-enhanced MRI has been shown to be useful for the detection and characterization of HCC 12, 22. The majority of HCC lacking normally functioning hepatocytes are imaged as a defect of hepatocyte-selective enhancement in the hepatobiliary phase compared with surrounding hepatic parenchyma 14. However, some HCCs may show uptake of gadoxetic acid and are recognized as iso-or hyperintense lesions in the hepatobiliary phase, compared with surrounding hepatic parenchyma 15, 22. It is still uncertain which factors affect the degree of enhancement of HCCs during hepatobiliary phase. Some investigators reported that the degree of tumor enhancement by hepatobiliary contrast agents correlated with the histologic grades of the HCCs, however, other researchers disputed this assertion 15, 23-25. It would be important implication whether the degree of tumor enhancement on hepatobiliary
5
phase correlates with the histologic grades because the histologic grade of the HCCs is one of the important prognostic factors. Therefore, the aim of this was study to assess whether the hepatobiliary phase MR imaging could predict the histologic factors of the HCCs.
II. MATERIALS and METHODS
Patients PopulationThis study was approved by institutional review board and informed consent for this retrospective study was not required. By searching the radiologic reports of the Department of Radiology, between May 2007 and June 2008, a total of 120 patients who underwent gadoxetic acid enhanced MR imaging for preoperative evaluation of HCC was found. Of them, 51 patients (46 men, 5 women; range 34-81 years, mean age 56 years) underwent hepatic resection. The criteria of exclusion were patients with prior history of transarterial chemoembolization (TACE) or radiofrequency ablation (RFA), or mixed-type malignancy (hepatocellular and cholangiocellular carcinoma). All lesions were confirmed by histopathology. The severity of liver cirrhosis was based on the Child-Pugh classification with all patients classified as Child-Pugh class A. Total bilirubin levels were within normal range (0.2-1.2 mg/dL) in 48 patients. The bilirubin level was slightly elevated in three patients (1.6, 1.4, and 1.3 mg/dL).
6
All MRI examinations were performed using a 3-T imaging system (MAGNETOM Tim Trio, Siemens Healthcare sector, Erlangen, Germany), equipped with a phased-array coil (Erlangen, Germany). Antiperistaltic agents or oral contrast agents were not used.
The parameters of MRI are shown in Table 1. The MRI protocol consisted of a breath-hold transverse T1-weighted in- and out-of-phase 2D gradient echo (GRE) sequence (TR/in-phase TE, 150/2.4 msec; out-of-phase TE = 1.2 msec; flip angle, 65°; field of view, 32–38 × 25–29 cm; matrix, 256 × 256; section thickness, 6 mm; slice spacing, 1.2 mm; one signal acquired; number of slices=30); a single slice turbo spin echo (TR/TE, 466/148; field of view, 32–36 × 25–29 cm; matrix, 288 × 230; section thickness, 4 mm; slice spacing, 1 mm) with spectral fat suppression technique; and a breath-hold transverse 3D-GRE (TR/TE, 2.5/0.9 msec; flip angle, 13°; field of view, 32–36 × 25–36 cm; matrix, 320 × 224; section thickness, 2 mm; no gap; acquisition time, 23 sec).
7
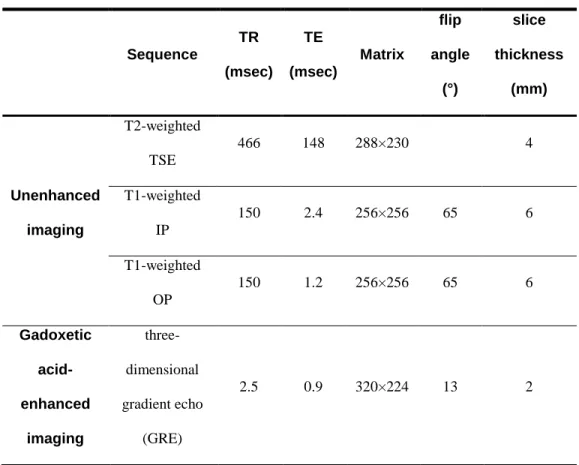
Table 1. The parameters of magnetic resonance imaging
Sequence TR (msec) TE (msec) Matrix flip angle (°) slice thickness (mm) Unenhanced imaging T2-weighted TSE 466 148 288×230 4 T1-weighted IP 150 2.4 256×256 65 6 T1-weighted OP 150 1.2 256×256 65 6 Gadoxetic acid-enhanced imaging three-dimensional gradient echo (GRE) 2.5 0.9 320×224 13 2
Note. TSE= turbo spin echo, TR= repetition time, TE= echo time, IP= in-phase, OP= opposed-phase
8
Contrast-enhanced MRI was performed using a breath-hold 3D-GRE sequence after an intravenous bolus of 0.025 mL/Kg of body weight of gadoxetic acid (Primovist; Bayer-Schering Pharma, Berlin, Germany) at an injection rate of 2 mL/sec followed by a saline flush of 30 mL. To determine the optimal timing for the hepatic arterial phase, fluoroscopic bolus detection technique was used in all patients (CareBolus, Siemens, Germany). Portal venous, hepatic venous and equilibrium phase images were obtained approximately 20 – 30 seconds after the acquisition of the prior phase images. Hepatobiliary phase was obtained at 20 minutes after infusion of contrast. An automatic infusion system (Sonic shot 50, Nemoto Kyorindo Co., Ltd., Tokyo, Japan) was used. The actual pulse sequence was started manually when the fluoroscopic sequence revealed that the contrast material bolus had reached the abdominal aorta.
Image Analysis
Two experienced radiologists reviewed the images on hepatobiliary phase by consensus. Radiologists recorded the degree of the HCCs’ enhancement with respect to the adjacent hepatic parenchyma without knowledge of quantitative image analysis. Relative signal intensity of HCCs compared with that of surrounding liver parenchyma was recorded as low signal intensity, iso signal intensity, and high signal intensity equivalent to adjacent hepatic parenchyma.
9
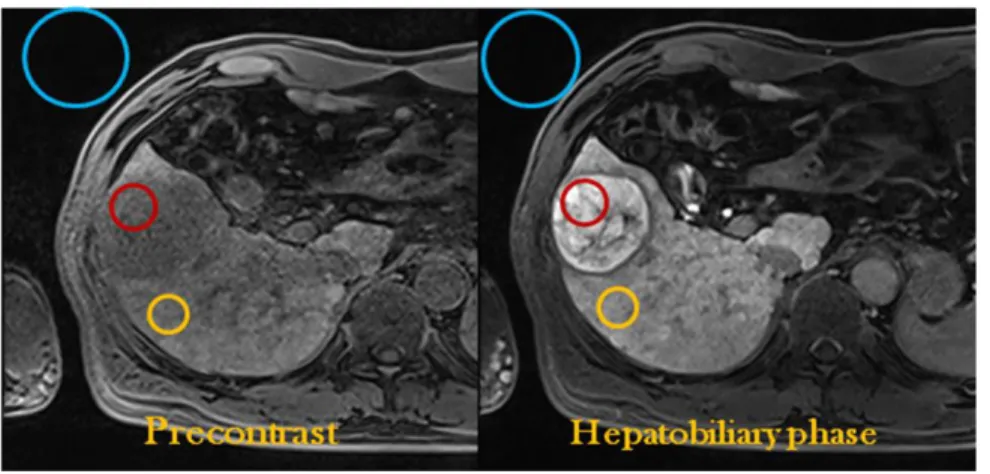
measured using an operator-defined region of interest (ROI). Average of three regions of interest (ROIs) were placed in the solid portion of HCCs corresponding to the enhancing portion identified on contrast-enhanced T1-weighted GRE images. For heterogeneous lesions, the lesions of interest were chosen in more homogeneous areas. Regions of interest were electronically drawn with areas larger than 256 mm2 in the liver and 50 mm2 in the lesions. In cases of non-visualized lesions, the measurement location was determined with anatomical structure such as vasculatures. The liver parenchyma adjacent to the lesion was measured using an ROI that excluded artifacts and blood vessels. The background noise was measured using the largest possible ROI located ventrally to the patient’s abdomen in the direction of the phase-encoding gradient, in an area without phase shift artifacts.
10
Figure 1. Methods to measure the signal intensity of the lesions using an operator-defined region of interest (ROI). Average of three regions of interest (ROIs) were placed in the solid portion of HCCs corresponding to the enhancing portion identified on contrast-enhanced T1-weighted GRE images. The liver parenchyma adjacent to the lesion was measured using an ROI that excluded artifacts and blood vessels. The background noise was measures using the largest possible ROI located ventrally to the patient’s abdomen in the direction of the phase-encoding gradient, in an area without phase shift artifacts.
11
Signal-to-noise ratios (SNR) of the liver and the lesion on unenhanced and gadoxetic acid-enhanced MR images were calculated with the following formulas: SNRliver= signal intensity (SI)liver/ standard deviation of background noise (NSD)
SNRtumor=SItumor/NSD
The contrast enhancement ratios (CER) and CNR ratio of the tumor and that of the liver parenchyma were calculated with the following formula:
CER (%)=(SNRpost-SNRpre)/(SNRpre)×100
CNR ratio=CNRpost-CNRpre/ CNRpre
Pathologic Analysis
Whole specimens of HCCs were retrieved and all tissue sections were fixed in 10% buffered formaldehyde solution and paraffinized. According to the general rules for the study of primary liver cancer by the KOREAN LIVER CANCER STUDY GROUP, the histopathologic factors were assessed for each tumor; these factors included nuclear grade, size of the tumor, grow type, histologic type, cell type, the cell density ratio of the tumor to the adjacent parenchyma, the percentage of the immunopositive areas on immunostaining for monoclonal hepatocyte antibody (hepatocyte paraffin 1, Hep Par 1), keratin 7 (K7), and keratin 19 (K19).
Using a basic hematoxylin and esosin (H&E) technique, the tumor grade of the HCCs was classified according to the nuclear grading scheme by Edmondson-Steiner, as I, II, III, and IV 26. When different tumor grades coexisted within a tumor, the major part represented the tumor grade. The tumor size was defined as the
12
largest diameter of the tumor specimen. The growth type was defined as either nodular expanding, nodular with perinodular growth, multinodular-confluent, or infiltrative; histologic type was defined as either trabecular, pseudoglandular, compact, or scirrhous; cell type was defined as hepatic, clear, giant, or spindle.
Image Pro Plus 4.0 (Media Cybernetics Inc, Silver Spring, USA) software was used for image acquisition. Three random areas were selected from each tumor and one area from surrounding non-neoplastic liver tissue in high-power fields
(×200). Then, individual nuclei were counted per 120,000 µm2 using manual count.
Cell density ratio was calculated with the following formula: Cell density ratio=mean cell density tumor/cell density liver
Immunohistochemical staining was carried out for Hep Par 1, K7, K19 27. A commercially available monoclonal antibody, Hep Par 1 (DAKO, Glostrup, Denmark), was used at a dilution of 1:25. The monoclonal antibodies against K7 (DAKO) and K19 (DAKO) were used at dilution of 1:15. Immunoreactivity was quantitated as the percent of the area positive for each marker. Immunohistochemical reactivity for Hep Par 1 was also semiquantitatively classified into four categories; - <5%, + 5-10%, ++ 10-50%, and +++ >50% of tumor cells. Immunoreactivity for K7 and K19 were classified into two categories; -
<5%, + ≥5% of tumor cells.
13
For statistical analysis, analysis of variance (ANOVA) or unpaired t-test was used to compare enhancement of HCC on hepatobiliary phase with the various clinical and histologic factors. Student-Neuman-Keuls test was used for all pairwise comparisons. Pearson’s correlation was used to determine correlations among cell density ratio, CER, histologic grade, Hep Par 1, K7, K19. A P value less than 0.05 was considered to indicate a statistically significant difference.
III. RESULTS
Of 53 HCCs, 50 HCCs showed low signal intensity on hepatobiliary phase. Three HCCs showed high signal intensity on hepatobiliary phase compared to surrounding liver parenchyma. The SNR of HCCs (mean ± standard deviation) increased from 47.2 ± 30.2 to 79.9 ± 75.7 (mean CER of all HCCs = 74.0 %, mean CER of hyperintense HCCs on hepatobiliary phase = 235.0 %, mean CER of hypointense HCCs on hepatobiliary phase = 64.4 %), whereas the SNR of the liver increased from 64.8 ± 42.3 to 150.2 ± 122.4 (mean CER of the liver = 145.7 %).
There were 8 HCCs with grade I (well-differentiated), 35 with grade II (moderately differentiated), 10 with grade III (poorly differentiated) (Table 2). The size of the tumors ranged from 0.8 to 9.5 cm (mean 4.1 cm). Twenty-four HCCs had nodular expanding growth patterns, 5 were of the nodular type with perinodular growth, 20 were of the multinodular-confluent type, 2 infiltrative type, and 2 vaguely nodular type. The histologic types consisted of 26 trabecular, 1 compact, and 26 mixed types (20 trabecular and pseudoglandular, 4 trabecular and compact, 1
14
pseudoglandular and compact, 1 trabecular, pseudoglandular and compact). The cell types consisted of 40 hepatic and 13 mixed types (9 hepatic and clear, 3 hepatic and giant, and one hepatic, clear, and giant).
Table 2. Pathologic features of hepatocellular carcinomas
Pathologic features subtypes
number of lesions
Nuclear grade grade I 8
grade II 35
grade III 10
Growth pattern nodular expanding growth 24
nodular with perinodular growth 5
multinodular-confluent type 20
infiltrative 2
vaguely nodular 2
Cell type hepatic 40
Mixed type (9 hepatic and clear, 3 hepatic and giant, and one hepatic, clear, and giant )
15
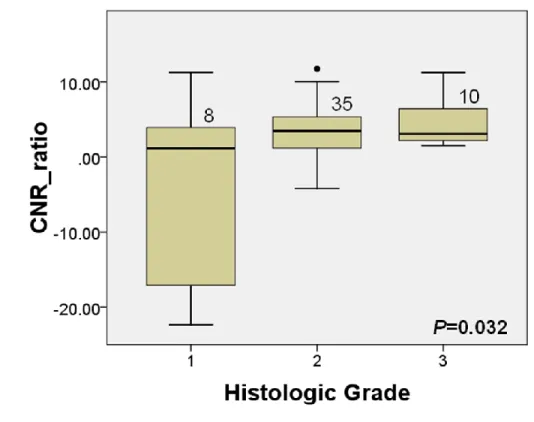
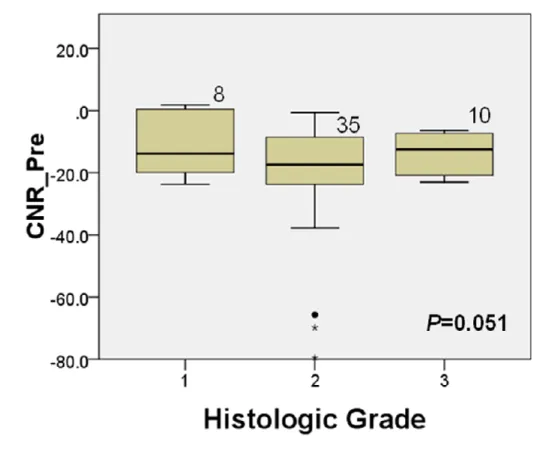
The relationship between liver-to-lesion (tumor) CNR ratio and histologic grade is shown in Fig. 2. The mean CNR ratio of well-differentiated HCC were significantly lower than that of moderately and poorly-differentiated HCCs (P=0.032). The relationship between CNR of the precontrast images and histologic grade is shown in Fig. 3. The CNR of the precontrast images was not significantly different according to the histologic grades (P=0.051).
16
Figure 3. The relationship between CNR of precontrast images and histologic grades.
17
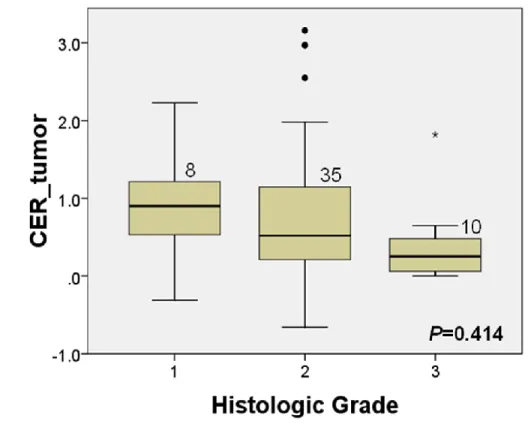
The relationship between the degree of tumor enhancement and histologic grade is shown in Fig. 4. Well-differentiated HCC showed higher enhancement on HBP compared with moderately differentiated and poorly-differentiated HCCs, but the difference were not statistically significant (P=0.414).
Figure 4. The relationship between contrast enhancement ratio (CER) of the tumor and histologic grades.
18
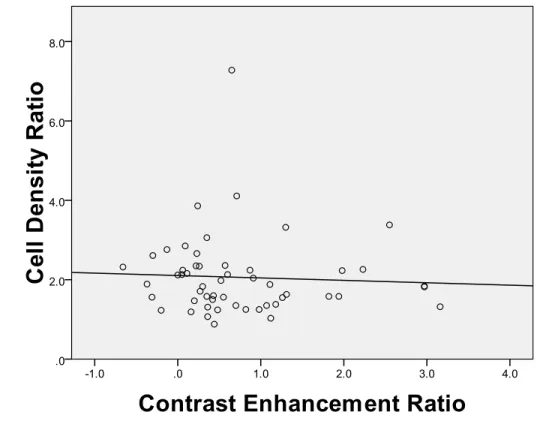
The ratios of the cell densities of the HCC to nonneoplastic liver tissue are shown in Fig. 5. Pearson correlation coefficient of CER and cell density ratio was -0.520 (P=0.711).
Figure 5. The relationship of the ratios of the cell densities of the HCC to nonneoplastic liver tissue and contrast enhancement ratio (CER).
19
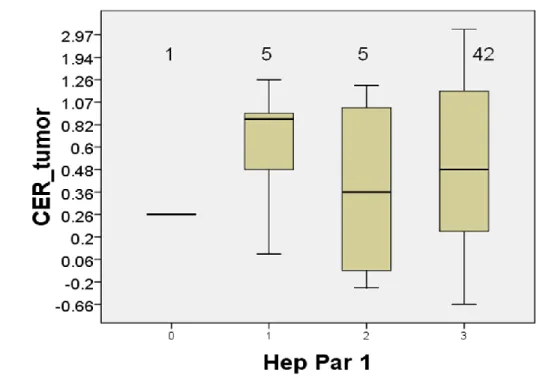
Hep Par 1 was positive in 52 HCCs (98.1%). 42 HCCs (79.2%) had strong
positivity on immunohistochemical staining for Hep Par 1. There was no
significant correlation between CER of HCC and Hep Par 1 positivity
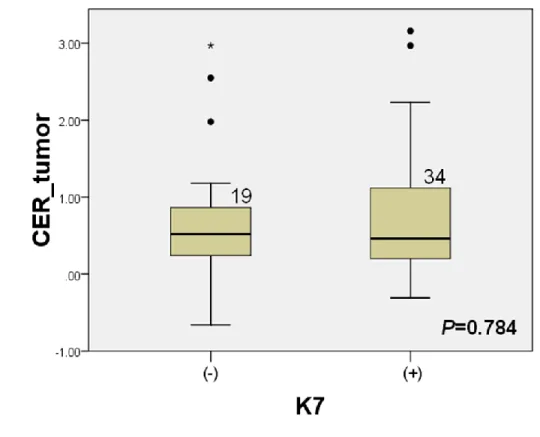
(P=0.504) (Fig. 6-a). K7 was positive in 34 HCCs (64.2 %) and K19 was
positive in 9 HCCs (16.9 %). The CER of HCC at hepatobiliary phase
images was not significantly associated with the expression of K7 in the
tumor (P=0.784) (Fig. 6-b). The CER of HCC were significantly lower in
K19 positive HCC than K19 negative group (P=0.015) (Fig. 6-c). There were
no significant correlations between Hep Par 1 positivity and the histologic
grades, the histologic grades and cell density ratio, or Hep Par 1 positivity
and cell density ratio (Fig. 7). There was no significant correlation among
CNR ratio of the tumors, Hep Par 1 positivity, cell density ratio, K7, and K19
(P=0.758, 0.170, 0.559, 0.829, respectively).
20
Figure 6. The relationship of contrast enhancement ratio (CER) of HCC and
immunoreactivity to Hep Par 1, K7, and K19.
21
22
23
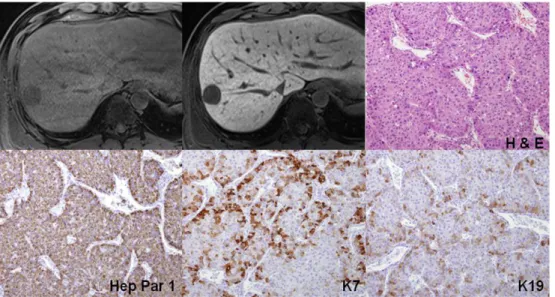
Figure 7. A 37-year-old woman with grade II HCC showed low signal intensity on hepatobiliary phase with gadoxetic acid. Three dimensional gradient echo images before and 20 minute after gadoxetic acid administration showed a mass in the right lobe of the liver with low signal intensity on hepatobiliary phase. Quantitatively, CER of the tumor was 43%. A nuclear grade II trabecular HCC with hepatic cells was proven. Immunoreactivity of Hep Par 1 was strongly positive. The cell density ratio was 1.6. K7 and K19 were (+).
24
IV. DISCUSSION
The present study showed that well-differentiated HCCs tended to present lower tumor-to-liver CNR values on gadoxetic acid-enhanced hepatobiliary phase images than HCCs of higher histologic grades. In well-differentiated HCC, the uptake of hepatobiliary contrast agent by tumor cells may be preserved to a certain degree and may show relatively lower CNR values on the hepatobiliary phase images compared to moderately or poorly differentiated HCCs11. The CNR ratio may be affected by hepatic function, however, all patients in this study was classified as Child-Pugh class A and most patients had normal range of bilirubin levels. Therefore, the effect of hepatic function to the enhancement of hepatic parenchyma on hepatobiliary phase would be negligible.
The CER of the tumor was not correlated with histologic grades in this study. The relationship between the degree of hepatobiliary contrast agent uptake and the histologic grades of HCCs has been a controversial issue 18, 22, 24, 28-29. The results of the present study, as well as those of other reports, indicate that most HCCs, irrespective of grade, retain a small amount of the hepatobiliary contrast agent but are predominantly hypointense relative to the surrounding liver parenchyma in the hepatobiliary phase images 15, 30. This finding implies that hepatobiliary phase imaging is useful for the detection of all grades of HCC. On the other hand, degree of tumor enhancement or CER cannot be used for noninvasive differentiation of tumor grades. It would be more important to measure CNR ratio
25
of the tumors than enhancement ratio for differentiation of tumor grades. Grazioli et al.31 found a tendency of greater enhancement of moderately differentiated HCCs over well-differentiated lesions on gadobenate dimeglumine-enhanced hepatobiliary phase images 31. However, in the present study, moderately and poorly differentiated HCCs tended to show lesser enhancement over well-differentiated lesions. The different results may be related to the different kinds of hepatobiliary contrast agents, a wide range of enhancement of moderately differentiated HCCs, and different population.
In the present study, 3 of 53 HCCs (5.6%) with moderate differentiation exhibited an exceeding uptake in comparison to the surrounding liver parenchyma in the hepatobiliary phase. Narita et al. 29 reported that uptake of gadoxetic acid in HCC is determined by the expression of OATP1B3 rather than by tumor differentiation or bile production. They observed strong correlation between enhancement ratio and expression levels of OATP1B3 protein. The expression of OATP1B3 was not investigated in the present study, and further study is needed to know the clinical significance of HCCs with an exceeding uptake.
Regarding the expression of immunohistochemical markers of HCCs, the CER of HCC was significantly lower in K19 positive groups than in K19 negative groups (P=0.015). This means that low CER value of the tumor may be related to expression of K19 and poor prognosis. Expression of K19 has been reported to be correlated with vascular invasion and poor prognosis in HCC 32-36 as well as representing a distinct type of HCC with intrahepatic cholangiocarcinoma-like
26
differentiation with increased risk for developing lymph node metastasis 33. Therefore, the results of this may imply that low CER on gadoxetic acid-enhanced hepatobiliary images may have a potential to be used as a poor prognostic marker of HCC. K7 and K19 are markers of biliary differentiation, and they are expressed in the bile ducts. It has been reported that survival in patients with biliary marker-positive HCC was significantly shorter than in those with negative HCC 35, 37. Bipotential hepatic progenitor cells also express K7 and K19, and the presence of HCCs expressing K7 and/or 19 could be of progenitor cell origin 34, 38. In the present study, K19 expression was negatively correlated with CER of HCC, while K7 was not.
Immunostaining for Hep par 1 was not correlated with the degree of enhancement of gadoxetic acid. Hep Par 1 is a monoclonal antibody which reacts to a cytoplasmic marker of normal and neoplastic hepatocytes. The relationship between Hep Par 1 positivity and nuclear grade of HCCs is unclear. Recent reports suggested that well-differentiated and trabecular HCCs showed stronger positivity of Hep Par 1 than poorly differentiated or undifferentiated HCCs 39-40. Although the uptake of mangafodipir trisodium (manganese dipyridoxal diphosphate, MnDPDP), which is a kind of hepatobiliary contrast agent, has been reported to be correlated with Hep Par 1 expression, the uptake mechanism of MnDPDP and gadoxetic acid is different 27. MnDPDP is an anionic manganese chelate and it is taken up by active hepatocytes as a form of free Mn2+ ion and excreted through the biliary system 41. Mitochondria may play an important role in MnDPDP uptake and Hep Par 1
27
positivity 27. However, organic anionic transporter peptides are involved in the uptake of gadoxetic acid and they are localized to the membrane of hepatocytes 42. Therefore, it appears to be no significant correlation between gadoxetic acid uptake and Hep Par 1 expression.
There are several limitations in my study. First, complete slice by slice pathologic-MR imaging matching was not technically feasible. Therefore, the most representative characteristics of each tumor were used, so the sampling bias within each tumor is inevitable. Second, although there was a significant correlation between CNR ratio and histologic grades, the practical value of this result is limited because there was significant overlap of CNR ratio among each group. Third, Child-Pugh class B or C cirrhosis patients were not included because they are not usually surgical candidates. Hence, the observed enhancement characteristics of liver parenchyma in Child-Pugh class A cirrhosis might be different in Child-Pugh classes B and C cirrhosis. Finally, although hepatocyte and liver stem cell/progenitor cell markers were used, other immunohistochemical markers were not included.
28
V. CONCLUSION
In conclusion, gadoxetic acid-enhanced hepatobiliary phase MR imaging can be helpful for predicting the histologic grades of HCCs, especially differentiating well-differentiated HCCs from moderate and poorly differentiated HCCs. The CNR ratio of well-differentiated HCCs of gadoxetic acid-enhanced MR imaging was significantly different from that of moderate or poorly differentiated HCCs. However, the CER of HCC was not correlated with histological grades. The CER of HCC was significantly different between K19 positive and negative groups.
29
V. References
1. El-Serag HB, Mason AC. Rising incidence of hepatocellular carcinoma in the United States. N Engl J Med 1999;340:745-50.
2. Parkin DM, Bray F, Ferlay J, Pisani P. Estimating the world cancer burden: Globocan 2000. Int J Cancer 2001;94:153-6.
3. Burrel M, Llovet JM, Ayuso C, Iglesias C, Sala M, Miquel R, et al. MRI angiography is superior to helical CT for detection of HCC prior to liver transplantation: an explant correlation. Hepatology 2003;38:1034-42. 4. Krinsky GA, Lee VS, Theise ND. Focal lesions in the cirrhotic liver: high
resolution ex vivo MRI with pathologic correlation. J Comput Assist Tomogr 2000;24:189-96.
5. Krinsky GA, Lee VS, Theise ND, Weinreb JC, Morgan GR, Diflo T, et al. Transplantation for hepatocellular carcinoma and cirrhosis: sensitivity of magnetic resonance imaging. Liver Transpl 2002;8:1156-64.
6. Libbrecht L, Bielen D, Verslype C, Vanbeckevoort D, Pirenne J, Nevens F, et al. Focal lesions in cirrhotic explant livers: pathological evaluation and accuracy of pretransplantation imaging examinations. Liver Transpl 2002;8:749-61.
7. Noguchi Y, Murakami T, Kim T, Hori M, Osuga K, Kawata S, et al. Detection of hepatocellular carcinoma: comparison of dynamic MR imaging with dynamic double arterial phase helical CT. AJR Am J
30
Roentgenol 2003;180:455-60.
8. Rode A, Bancel B, Douek P, Chevallier M, Vilgrain V, Picaud G, et al. Small nodule detection in cirrhotic livers: evaluation with US, spiral CT, and MRI and correlation with pathologic examination of explanted liver. J Comput Assist Tomogr 2001;25:327-36.
9. Tomemori T, Yamakado K, Nakatsuka A, Sakuma H, Matsumura K, Takeda K. Fast 3D dynamic MR imaging of the liver with MR SmartPrep: comparison with helical CT in detecting hypervascular hepatocellular carcinoma. Clin Imaging 2001;25:355-61.
10. Semelka RC, Helmberger TK. Contrast agents for MR imaging of the liver. Radiology 2001;218:27-38.
11. Bartolozzi C, Crocetti L, Lencioni R, Cioni D, Della Pina C, Campani D. Biliary and reticuloendothelial impairment in hepatocarcinogenesis: the diagnostic role of tissue-specific MR contrast media. Eur Radiol 2007;17:2519-30.
12. Hammerstingl R, Huppertz A, Breuer J, Balzer T, Blakeborough A, Carter R, et al. Diagnostic efficacy of gadoxetic acid (Primovist)-enhanced MRI and spiral CT for a therapeutic strategy: comparison with intraoperative and histopathologic findings in focal liver lesions. Eur Radiol 2007.
13. Jung G, Breuer J, Poll LW, Koch JA, Balzer T, Chang S, et al. Imaging characteristics of hepatocellular carcinoma using the hepatobiliary contrast agent Gd-EOB-DTPA. Acta Radiol 2006;47:15-23.
31
14. Reimer P, Rummeny EJ, Shamsi K, Balzer T, Daldrup HE, Tombach B, et al. Phase II clinical evaluation of Gd-EOB-DTPA: dose, safety aspects, and pulse sequence. Radiology 1996;199:177-83.
15. Saito K, Kotake F, Ito N, Ozuki T, Mikami R, Abe K, et al. Gd-EOB-DTPA Enhanced MRI for Hepatocellular Carcinoma: Quantitative Evaluation of Tumor Enhancement in Hepatobiliary Phase. Magn Reson Med Sci 2005;4:1-9.
16. Schmitz SA, Haberle JH, Balzer T, Shamsi K, Boese-Landgraf J, Wolf KJ. Detection of focal liver lesions: CT of the hepatobiliary system with gadoxetic acid disodium, or Gd-EOB-DTPA. Radiology 1997;202:399-405. 17. Tsuda N, Okada M, Murakami T. Potential of gadolinium-ethoxybenzyl-diethylenetriamine pentaacetic acid (Gd-EOB-DTPA) for differential diagnosis of nonalcoholic steatohepatitis and fatty liver in rats using magnetic resonance imaging. Invest Radiol 2007;42:242-7.
18. Vogl TJ, Kummel S, Hammerstingl R, Schellenbeck M, Schumacher G, Balzer T, et al. Liver tumors: comparison of MR imaging with Gd-EOB-DTPA and Gd-Gd-EOB-DTPA. Radiology 1996;200:59-67.
19. Dahlstrom N, Persson A, Albiin N, Smedby O, Brismar TB. Contrast-enhanced magnetic resonance cholangiography with BOPTA and Gd-EOB-DTPA in healthy subjects. Acta Radiol 2007;48:362-8.
20. Dohr O, Hofmeister R, Treher M, Schweinfurth H. Preclinical safety evaluation of Gd-EOB-DTPA (Primovist). Invest Radiol 2007;42:830-41.
32
21. Schuhmann-Giampieri G, Mahler M, Roll G, Maibauer R, Schmitz S. Pharmacokinetics of the liver-specific contrast agent Gd-EOB-DTPA in relation to contrast-enhanced liver imaging in humans. J Clin Pharmacol 1997;37:587-96.
22. Huppertz A, Haraida S, Kraus A, Zech CJ, Scheidler J, Breuer J, et al. Enhancement of focal liver lesions at gadoxetic acid-enhanced MR imaging: correlation with histopathologic findings and spiral CT--initial observations. Radiology 2005;234:468-78.
23. Fujita M, Yamamoto R, Takahashi M, Tsuji T, Yamanaka T, Miyazawa T, et al. Paradoxic uptake of Gd-EOB-DTPA by hepatocellular carcinoma in mice: quantitative image analysis. J Magn Reson Imaging 1997;7:768-70. 24. Ni Y, Marchal G, Yu J, Muhler A, Lukito G, Baert AL. Prolonged positive
contrast enhancement with Gd-EOB-DTPA in experimental liver tumors: potential value in tissue characterization. J Magn Reson Imaging 1994;4:355-63.
25. Vogl TJ, Stupavsky A, Pegios W, Hammerstingl R, Mack M, Diebold T, et al. Hepatocellular carcinoma: evaluation with dynamic and static gadobenate dimeglumine-enhanced MR imaging and histopathologic correlation. Radiology 1997;205:721-8.
26. Edmondson HA, Steiner PE. Primary carcinoma of the liver: a study of 100 cases among 48,900 necropsies. Cancer 1954;7:462-503.
33
Mangafodipir trisodium-enhanced MRI of hepatocellular carcinoma: correlation with histological characteristics. Clin Radiol 2008;63:1195-204. 28. Fujita M, Yamamoto R, Fritz-Zieroth B, Yamanaka T, Takahashi M,
Miyazawa T, et al. Contrast enhancement with Gd-EOB-DTPA in MR imaging of hepatocellular carcinoma in mice: a comparison with superparamagnetic iron oxide. J Magn Reson Imaging 1996;6:472-7. 29. Narita M, Hatano E, Arizono S, Miyagawa-Hayashino A, Isoda H,
Kitamura K, et al. Expression of OATP1B3 determines uptake of Gd-EOB-DTPA in hepatocellular carcinoma. J Gastroenterol 2009;44:793-8.
30. Frericks BB, Loddenkemper C, Huppertz A, Valdeig S, Stroux A, Seja M, et al. Qualitative and quantitative evaluation of hepatocellular carcinoma and cirrhotic liver enhancement using Gd-EOB-DTPA. AJR Am J Roentgenol 2009;193:1053-60.
31. Grazioli L, Morana G, Caudana R, Benetti A, Portolani N, Talamini G, et al. Hepatocellular carcinoma: correlation between gadobenate dimeglumine-enhanced MRI and pathologic findings. Invest Radiol 2000;35:25-34. 32. Ding SJ, Li Y, Tan YX, Jiang MR, Tian B, Liu YK, et al. From proteomic
analysis to clinical significance: overexpression of cytokeratin 19 correlates with hepatocellular carcinoma metastasis. Mol Cell Proteomics 2004;3:73-81.
33. Zhuang PY, Zhang JB, Zhu XD, Zhang W, Wu WZ, Tan YS, et al. Two pathologic types of hepatocellular carcinoma with lymph node metastasis
34
with distinct prognosis on the basis of CK19 expression in tumor. Cancer 2008;112:2740-8.
34. Durnez A, Verslype C, Nevens F, Fevery J, Aerts R, Pirenne J, et al. The clinicopathological and prognostic relevance of cytokeratin 7 and 19 expression in hepatocellular carcinoma. A possible progenitor cell origin. Histopathology 2006;49:138-51.
35. Uenishi T, Kubo S, Yamamoto T, Shuto T, Ogawa M, Tanaka H, et al. Cytokeratin 19 expression in hepatocellular carcinoma predicts early postoperative recurrence. Cancer Sci 2003;94:851-7.
36. Wu F, Nishioka M, Fujita J, Murota M, Ohtsuki Y, Ishida T, et al. Expression of cytokeratin 19 in human hepatocellular carcinoma cell lines. Int J Oncol 2002;20:31-7.
37. Wu PC, Fang JW, Lau VK, Lai CL, Lo CK, Lau JY. Classification of hepatocellular carcinoma according to hepatocellular and biliary differentiation markers. Clinical and biological implications. Am J Pathol 1996;149:1167-75.
38. Lau SK, Prakash S, Geller SA, Alsabeh R. Comparative immunohistochemical profile of hepatocellular carcinoma, cholangiocarcinoma, and metastatic adenocarcinoma. Hum Pathol 2002;33:1175-81.
39. Chu PG, Ishizawa S, Wu E, Weiss LM. Hepatocyte antigen as a marker of hepatocellular carcinoma: an immunohistochemical comparison to
35
carcinoembryonic antigen, CD10, and alpha-fetoprotein. Am J Surg Pathol 2002;26:978-88.
40. Kumagai I, Masuda T, Sato S, Ishikawa K. Immunoreactivity to monoclonal antibody, Hep Par 1, in human hepatocellular carcinomas according to histopathological grade and histological pattern. Hepatol Res 2001;20:312-9.
41. Balci NC, Semelka RC. Contrast agents for MR imaging of the liver. Radiol Clin North Am 2005;43:887-98, viii.
42. Cui Y, Konig J, Nies AT, Pfannschmidt M, Hergt M, Franke WW, et al. Detection of the human organic anion transporters SLC21A6 (OATP2) and SLC21A8 (OATP8) in liver and hepatocellular carcinoma. Lab Invest 2003;83:527-38.
36
Abstract(in Korean)
간세포암에서 간담도 특이 조영제 gadoxetic acid를 이용한
자기공명영상과의 병리학적 상관관계
지도교수 김명진
연세대학교 대학원 의학과
최진영
목적: Gadoxetic acid-조영증강 간담도기 자기공명영상이 간세포암의 병리학적 인자들을 예측할 수 있는지 평가하고자 하였다. 대상 및 방법: 병리학적으로 확진된 51명의 간세포암 환자에서 53 예의 간세포 암을 대상으로 후향적으로 분석하였다. 모든 환자는 수술 전 gadoxetic acid-조 영증강 자기공명영상을 촬영하였다. 정성적 분석은 간담도기에서 종양의 신호강 도를 주변 간실질과 비교하여 고신호, 증신호, 저신호강도로 나누었다. 정량적 분석은 gadoxetic acid-조영증강 전과 20분 지연기 영상의 T1강조영상에서 시행 하였다. 조영증강 전후의 간담도기 영상에서 주변 간실질과 종양의 신호대 잡음 비 (signal-to-noise-ratio, SNR), 대조도 잡음비 (contrast-to-noise ratio, CNR)를 측정하였고 종양과 간실질의 조영증강 비(contrast enhancement ratio,37
CER), 대조도 잡음비의 차이 (CNR ratio)를 계산하고 병리학적 종양의 등급과 상관관계가 있는지 분석하였다. 또한 Hep Par-1, K7, K19의 면역반응도와 세포 밀도비율(cell density ratio)을 측정하여 간담도기 영상에서의 조영증강 비 (CER), 대조도 잡음비의 차이 (CNR ratio)와 비교하였다.
결과: 고분화도 간세포암 (n=8)의 조영증강 전후의 대조도 잡음비 차이 (CNR ratio)은 중등도 분화 (n=35)나 저분화 간세포암 (n= 10)에 비해 통계적으로 의 미있는 차이를 보였다 (P=0.032). CER값은 K19 양성군에서 음성군에 비해 통계 적으로 유의하게 낮았다 (P=0.015). CER, Hep par-1, K7에 대한 면역반응도, 세 포밀도비율은 대조도 잡음비 차이나 조영증강비 (CER)와 상관관계를 보이지 않 았다 (P>0.05). 결론: Gadoxetic acid-조영증강 자기공명영상의 간담도기 영상은 고분화도와 다 른 분화도의 (증등도 또는 저분화) 간세포암을 구별하는데 도움이 될 것이다. 간세포암의 조영증강 비는 K19에 대한 면역반응도와 상관 관계를 보인다.