I . Introduction
It is estimated that at least 2.2 billion people worldwide have visual impairments. Of these, at least 1 billion have visual impairments that could have been prevented or that resulted from inappropriate treatment (World Health Organization, 2019). In South Korea, the number of those officially registered as visually impaired increased significantly from 198,456 in 2005 to 266,823 in 2017 (Ministry of Health and Welfare, 2019), posing a serious social problem.
Criteria to determine visual impairment vary from country to country. Based on best-corrected visual acuity, the World Health Organization (2019) classifies an individual as blind if their best-corrected visual acuity is below 3/60, as having severe visual impairment if it is below 6/60, and as having moderate vision if it is below 6/18. Best-corrected visual acuity below 6/18 or above 3/60 is defined as low vision. In
South Korea, visual impairment is classified as severe or mild; best-corrected eyesight of 0.06 or less is considered severe, and best corrected eyesight of 0.1 or less is considered mild visual impairment (Ministry of Health and Welfare, 2019).
An acquired disability refers to not having a disability until a certain period of life and becoming disabled due to an accident or illness. One study reported that 92.4% of visual impairments were caused by acquired diseases or accidents, and that the incidence of such impairment increased rapidly in males aged over 50 years and in females aged over 60 years due to the high prevalence of chronic diseases, such as age-related ocular disease (particularly age-related macular degeneration), glaucoma, cataracts, and diabetic retinopathy in older adults (Chong, Jackson, Wolffsohn, & Bentley, 2016). Further, the incidence of visual impairment is expected to increase steadily due to the rising
Journal of Korean Public Health Nursing
Volume 35. No. 1, 149 - 164, April 2021 중심단어 : 중도 시각장애, 불건강, 동반 질병, 건강증진
Factors associated with Poor Self-Rated Health According
to Visual Impairment Severity
*
Jeon, Eunyoung
*** 본 연구는 2016년도 대구대학교 학술연구비 지원에 의한 것임(과제번호 20160321).
** 대구대학교 간호학과 교수(https://orcid.org/0000-0001-6791-2344) (교신저자 E-mail: [email protected]) ∙ Received: 7 January 2021 ∙ Revised: 24 March 2021 ∙ Accepted: 14 April 2021
∙ Address reprint requests to: Jeon, Eunyoung
Department of Nursing, Daegu University 33, Seongdangro 50gil, Namgu, Daegu, 42400 Tel: +82-53-650-8392 E-mail: [email protected]
numbers of older adults globally.
Visual impairment adversely affects quality of life, personal independence, and one’s ability to engage in social activities (Ni et al., 2020; Shim & Han, 2012). Since those with acquired visual impairments are required to re-establish their self-identity and restart their lives, they experience significant psychological stress. Consequently, the negative effects of visual impairment experienced by these affected individuals and their families have been considered to be significantly greater than those experienced by individuals who are congenitally visually impaired (Song & Oh, 2017).
Visual impairments are associated with an increased risk of death (La Forge, Spector, & Sternberg, 1992). The morbidity rate among disabled people in Korea (33.7%) is approximately twice that of the general population (17%). Understanding the nature and extent of comorbidities in this group would be likely to help inform decisions concerning how medical practice and healthcare services can be improved in relation to those with visual impairments. Causes of death, in particular, have been reported to vary according to the severity of visual impairment (Court, McLean, Guthrie, Mercer, & Smith, 2014; Park, Im, & Kim, 2018), which highlights the need to take health-related characteristics specific to varying levels of impairment severity into account when planning care for this population. In severe cases of visual impairment, direct causes of death have been attributed to malignant neoplasms, congenital abnormalities, diabetes mellitus, heart disease, and cerebrovascular disease, and, in mild cases of visual impairment, to malignant neoplasms, cardiovascular diseases, congenital abnormalities, injury and poisoning, and diabetes mellitus. Since these causes are preventable, the relevant
factors associated with patients’ health status should be identified. Furthermore, direct and indirect factors affecting remaining visual acuity need to be distinguished and managed to improve the health status of individuals with acquired visual impairment (World Health Organization, 2019), and the overall health of these individuals maintained to minimize further disability and complications.
Desirable changes in lifestyle can improve health. The Lalonde report (cited in Terris, 1984) suggested that biological, environmental, medicinal, and lifestyle factors determine health, disease, and death in human life. Consequently, many studies have been conducted to improve health and health promotion programs for various groups. However, despite the elevated health risks associated with visual impairments, programs to enhance the health-related needs of individuals with visual impairments are seldom undertaken. Past studies on individuals with acquired visual impairment have explored the characteristics of individuals with low visual acuity in relation to rehabilitative care (Chong et al., 2016; Ni, et al., 2020) and their health education needs (Jeon, 2019), as well as physical and mental comorbidities in older adults with visual impairment (Court et al., 2014), and perceived health and self-care of patients with diabetes mellitus and visual loss (Leksell, Sandberg, & Wikblad, 2004), but the health and predictors of health among individuals in relation to visual impairment severity have not been examined. In order to identify nursing problems in individuals with acquired visual impairment, the study which assessed factors associated with poor self-rated health through classifying into either severe or mild visual impairment groups using nationally representative data, is needed.
Therefore, this study aimed to investigate poor self-rated health and associated health-related factors in individuals with acquired visual impairment, through classifying individuals into severe and mild visual impairment groups, to facilitate more effective nursing and related healthcare interventions that consider the degree of visual impairment severity involved.
Ⅱ. Methods
1. Study designThis study was a descriptive survey and secondary analysis, using data obtained from the 2017 National Survey on Persons with Disabilities conducted by the Korea Institute for Health and Social Affairs, which aimed to identify the predictors of poor health in individuals with acquired visual impairment in relation to visual impairment severity.
2. Samples
The National Survey on Persons with Disabilities is conducted every three years in Korea. The 2017 National Survey on Persons with Disabilities involved 6,549 households that were determined using proportional stratified sampling of 45,180 sample households with registered individuals with disabilities in 17 cities and provinces. The Korea Institute for Health and Social Affairs conducted the 2017 National Survey on Persons with Disabilities after obtaining relevant institutional review board approval. We submitted a protocol for using raw data from that survey to the Korea Institute for Health and Social Affairs and obtained approval to conduct our study (Receipt No. 247, Oct 11, 2019).
Of the 6,549 households with registered
persons with disabilities selected in the 2017 National Survey on Persons with Disabilities in Korea, data from 629 individuals registered as having a visual impairment were first identified, from which 603 individuals with an acquired visual impairment were selected. From the selected data, 40 individuals with incomplete data (2 with no responses concerning health-related items, 38 with no responses to items concerning height and weight) were excluded, and data from 563 individuals were included in the final analysis.
3. Measures
Based on the Lalonde report (cited in Terris, 1984), poor self-rated health was considered as the dependent variable, and comorbidities, vision aids/health information, lifestyle, healthcare services, and sociodemographic characteristics were considered as independent variables.
1) Poor self-rated health.
This variable was assessed through determining the total score on five items concerning exercise ability, self-care, daily activities, pain/discomfort, and anxiety/depression, with each item rated on a 3-point Likert scale (1=no problem, 2=somewhat problematic, and 3=severely problematic). Higher scores indicated poorer self-rated health. The Cronbach's α of the tool was .83.
2) Comorbidities.
This variable referred to diseases related to visual impairment, including diabetes mellitus, hypertension, depression, cataracts, stroke, hyperlipidemia, and osteoarthritis.
3) Vision aids/health information.
This variable referred to the use of visual aids (glasses, electronic magnifiers, white canes,
braille information terminals), information and communication devices (smartphone, computer), and accessibility to health-related information (source of health information and needed health information categories).
4) Lifestyle.
This variable referred to information that was obtained on respondents’ smoking behavior, alcohol consumption, exercise, regularity of meal patterns, balanced diet, and body mass index (BMI). Obesity was defined using the Asian classification system of BMI (kg/m2) as follows:
underweight (BMI <18.5kg/m2), normal (18kg/m2
≤BMI <25kg/m2), obese (BMI ≥25kg/m2).
5) Healthcare services.
This variable included healthcare service use and health checkups. Both healthcare utilization and health checkups were classified in terms of either use “yes” or non-use “no”.
6) Sociodemographic characteristics.
This variable concerned information obtained on participants’ gender, age, education, occupation, household type, monthly income, and braille reading. Household income was based on the average monthly household income according to Statistics Korea as of 2017.
4. Data Analysis
Data were analyzed using SPSS 25.0 (SPSS Inc., Chicago IL, USA.), and a P value <0.05 was considered statistically significant. Differences in poor self-rated health according to demographic characteristics, comorbidities, vision aids/health information, lifestyle, and healthcare utilization and health checkups of individuals with severe visual impairment and of individuals with mild
visual impairment were analyzed using t-tests and analysis of variance (ANOVA). Variables with unequal variance were analyzed using a Welch test. A Scheffé test was used for post-hoc testing. The predictors of poor self-rated health in terms of acquired visual impairment severity were analyzed using multiple regression.
Ⅲ. Results
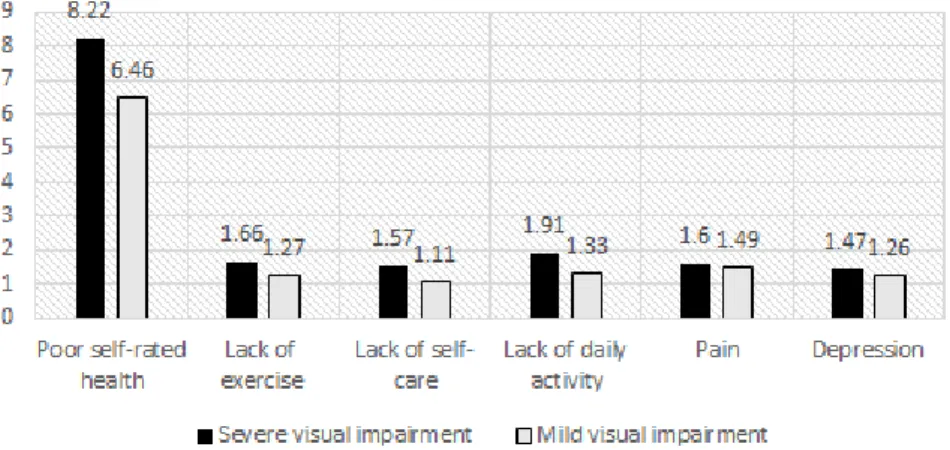
1. Respondents’ Poor Self-Rated Health Individuals with severe visual impairment had higher scores (8.22) of poor self-rated health than did those with mild visual impairment (6.46). The difference in scores between individuals with severe visual impairment and those with mild visual impairment was highest in relation to daily activities, followed by self-care, exercise ability, anxiety/depression, and pain (Figure 1).
2. Differences in Poor Self-Rated Health According to Respondents’ Sociodemographic Characteristics
The sociodemographic characteristics of the respondents in terms of visual impairment severity are shown in Table 1. Among these respondents with severe visual impairment, 52.9% were males and 47.1% were females. Most of these respondents (57.4%) were older adults, and the average age was 64.0 years. Regarding education level and employment status, most (52.9%) had below middle school education, and 76.5% did not have a job. Fifty percent of these respondents lived with children or relatives, and 25.0% lived alone. The average monthly household income was below 1.68 million Korean Won (KRW) for 52.9% of these respondents, and 82.4%
of these respondents could not understand Braille.
Among the respondents with mild visual impairment, 59.2% were males and 40.8% were females. Most of these respondents (55.6%) were older adults, and the average age was 63.4 years. Fifty-six percent of these respondents had below middle school education, and 47.3% were employed. Most of these respondents (38.4%) lived with a spouse. The average monthly household income for 46.1% of these respondents was below 1.68 million KRW, and 99.0% of these respondents could not understand braille.
Among the individuals with severe visual impairment, those without jobs scored significantly higher on poor self-rated health than did those with jobs (p=.006). There were no significant differences in the other variables. Among the individuals with mild visual impairment, those who scored higher on poor self-related health included: females (p<.001); individuals ≥ 65 years or older as opposed to minors, middle-aged, and late-middle-aged individuals (p<.001); middle school graduates or lower as opposed to high school or college graduates or higher (p<.001); those without jobs (p<.001); individuals who lived
alone as opposed to people who lived with another person (p=.001); and low-income individuals (1.68 million KRW per month) as opposed to individuals with an income of 1.69 million KRW or higher per month (p< .001).
3. Differences in Poor Self-Rated Health in terms of Comorbidities, Vision Aids, Lifestyle, Healthcare Service Usage and Health Status
Table 2 shows the differences in poor self-rated health in terms of comorbidities, vision aids, lifestyle, healthcare service usage, and health status.
Those in the severe visual impairment group with depression reported higher poor self-rated health than those without depression (p=.001). There were no significant differences in the other variables. Those in the mild visual impairment group with diabetes mellitus (p<.001), hypertension (p<.001), depression (p=.018), cataracts (p=.047), stroke (p=.014), hyperlipidemia (p<.001), and osteoarthritis (p<.001) scored higher on poor self-rated health.
Regarding the use of visual aids, those in the Figure 1. Level of respondents’ poor self-rated health
Ta bl e 1. P oo r Sel f-Ra te d He al th i n te rm s of D emog ra phi c Ch ar ac te rist ics (N=563) Di vi si on Sever e vi sual i m pai rm ent ( n=68 ) M ild v is ual i m pai rm ent ( n=495 ) n( % ) M ean± SD t or F /W el ch p Sch eff é n( % ) M ean± S D t or F /W el ch p S cheff é G end er M ale 3 6( 52 .9 ) 8.0 ± 1. 8 -0. 86 .390 293( 59. 2) 6. 2± 1. 6 -4 .0 2 <.0 01 Fem al e 3 2( 47. 1) 8. 4± 2. 0 202( 40. 8) 6. 8± 1. 8 A ge( yr ) Mi no r (≤ 18 ) 0 ( 0. 0) 1. 17 .325 4( 0 .8 ) 5.2 ± 0.5 b 18. 86 † <.0 01 a>b Y ou th ( 19 -3 4) 5 ( 7.4 ) 7.8 ± 1. 1 1 7( 3 .4 ) 6.1 ± 1.5 M iddl e-ag ed (3 5-49 ) 7( 10. 3) 7. 4± 2. 2 65( 13. 1) 5. 6± 1. 0 b Lat e m iddl e ag e (5 0 –6 4) 17( 25. 0) 7. 8± 1. 7 134( 27. 1) 5. 9± 1. 2 b O ld age (≥ 65) 39( 57. 3) 8. 5± 2. 0 275( 55. 6) 6. 9± 1. 9 a Me an ±S D /m ed ia n (m in -m ax) 64. 03± 16. 47 /66. 5( 24-90 ) 63. 4± 14. 8 /6 6. 0( 14-9 1) E ducat io n Be lo w m id dl e schoo l 36( 52. 9) 8. 4± 2. 0 1. 47 .236 277( 56. 0) 6. 8± 1. 8 a 17. 72 † <.0 01 a>b Hi gh schoo l 21( 30. 9) 7. 6± 1. 7 134( 27. 1) 6. 0± 1. 5 b A bo ve co lle ge 11( 16. 2) 8. 5± 1. 8 84( 17. 0) 5. 8± 1. 2 b Job Yes 16( 23. 5) 7. 0± 1. 4 8. 20 .006 234( 47. 3) 5. 7± 1. 1 26. 41 † <.0 01 No 52( 76. 5) 8. 5± 1. 9 261( 52. 7) 7. 0± 1. 9 Li vi ng s ta tu s Li vi ng a lo ne 17( 25. 0) 8. 5± 2. 0 1. 51 .227 111( 22. 4) 6. 9± 1. 8 a 7. 28 .0 01 a>b Li vi ng w ith spo use 17( 25. 0) 7. 5± 1. 5 190( 38. 4) 6. 4± 1. 8 O ther s 34( 50. 0) 8. 3± 2. 0 194( 39. 2) 6. 1± 1. 6 b To ta l m ont hl y incom e( 10, 00 0 w on) ≤ 16 8 36( 52. 9) 8. 1± 1. 7 1. 23 † .344 228( 46. 1) 6. 9± 1. 8 a 14. 05 † <.0 01 a>b 16 9 –328 18( 26. 5) 8. 1± 1. 5 150( 30. 3) 6. 1± 1. 4 b 32 9 –472 10( 14. 7) 7. 8± 2. 5 58 (11. 7) 6. 0± 1. 9 b ≥ 47 3 4( 5. 9) 10. 7± 2. 6 59 (11. 9) 5. 7± 1. 2 b Me an ±S D /m ed ia n( m in-m ax) 206. 2± 139. 9 /157. 5( 45-60 0) 234. 8± 17 9. 3 /19 0. 0( 0-11 70) Br ai lle deci pher m ent Po ssi bl e 12( 17. 6) 7. 3± 1. 4 3. 12 .082 5( 1 .0 ) 5.6 ± 0.8 1. 22 .2 69 Im possi bl e 56( 82. 4) 8. 4± 2. 0 490( 99. 0) 6. 4± 1. 7 † W el ch t es t
Ta bl e 2. D if fe renc es i n P oor S el f-R at ed Hea lt h in ter m s of C omo rb id it ie s, V is io n A id s/ H ea lt h In fo rm at io n, Life sty le , an d H ea lt hc ar e Ser vi ces (N =563 ) Var iab le s S evere v is ual i m pai rm ent (n= 68) M ild v is ua l im pa irm en t (n = 495 ) n( % ) M ean± S D t or F /W el ch p Sch eff é n(% ) M ean± S D t or F /W el ch p S cheff é C om or bid ity D ia be te s m ellitu s Y es 16 (23 .5 ) 7.8 ± 1.9 0. 91 .3 41 1 21( 2 4. 4) 6 .9 ± 1 .8 10. 06 <.0 01 No 52 (76 .5 ) 8.3 ± 1.9 37 4( 75 .6 ) 6 .3 ± 1 .7 H yperte nsi on Y es 29 (42 .6 ) 8.2 ± 1.8 0. 08 .9 19 2 12( 4 2. 8) 6 .9 ± 1 .8 4. 93 <. 00 1 No 39 (57 .4 ) 8.2 ± 2.0 28 3( 57 .2 ) 6 .1 ± 1 .5 D epressi on Yes 10(1 4. 7) 10. 1± 1. 8 7. 81 .0 01 22( 3. 2) 7 .5 ± 2 .0 4. 04 .0 18 No 58 (85 .3 ) 7.8 ± 1.8 47 3( 95 .6 ) 6 .4 ± 1 .7 C ata rac t Y es 3 ( 4.4 ) 8.3 ± 0.5 0. 28 .7 88 52 (10. 5) 6 .9 ± 1 .8 1. 99 .0 47 No 65 (95 .6 ) 8.2 ± 1.9 44 3( 89 .5 ) 6 .4 ± 1 .7 S trok e Y es 3 ( 4.4 ) 7.6 ± 1.1 -0. 50 .6 18 19( 3. 8) 8 .0 ± 2 .5 2. 71 .0 14 No 65 (95 .6 ) 8.2 ± 1.9 47 6( 96 .2 ) 6 .4 ± 1 .6 H yperl ip idem ia Y es 6 ( 8.8 ) 9.0 ± 2.2 1. 02 .3 08 7 2(14 .5 ) 7 .2 ± 1 .9 4. 24 <. 00 1 No 62 (91 .2 ) 8.1 ± 1.9 42 3( 85 .5 ) 6 .3 ± 1 .6 V is io n aid s/ he alth in for m at io n Gl as ses (c ont act l ens) Y es 21 (30 .9 ) 8.4 ± 2.1 0. 72 .4 73 2 64( 5 3. 3) 6 .3 ± 1 .5 -1 .6 5 .0 99 No 47 (69 .1 ) 8.1 ± 1.8 23 1( 46 .7 ) 6 .6 ± 1 .9 E lectroni c m agn if ie r Yes 7(10 .3 ) 8. 7± 2. 5 0. 08 .7 19 6( 1.2 ) 6. 5± 1. 9 -. 14 .83 3 No 61 (89 .7 ) 8.6 ± 2.3 48 9( 98 .8 ) 6 .6 ± 1 .8 W hi te cane Y es 30 (44 .1 ) 7.9 ± 1.7 -1. 21 .2 30 4( 0.8 ) 6. 7± 1. 5 0. 32 .7 45 No 38 (55 .9 ) 8.4 ± 2.0 49 1( 99 .2 ) 6 .4 ± 1 .7 B ra ille i nf or m atio n Y es 4 ( 5.9 ) 7.2 ± 1.5 -1. 02 .3 07 0 (0. 0) --No 64(9 4. 1) 8. 2± 1. 9 4 95(1 00. ) 6 .4 ± 1 .7 S m artp hone Y es 21 (30 .9 ) 7.0 ± 1.6 -3. 60 .0 01 2 74( 5 5. 4) 5 .9 ± 1 .2 -8 .1 2 <. 00 1 No 47 (69 .1 ) 8.7 ± 1.8 22 1( 44 .6 ) 7 .1 ± 2 .0 Com puter Y es 10 (14 .7 ) 7.2 ± 1.4 -1. 82 .0 72 1 62( 3 2. 7) 5 .6 ± 1 .0 -9 .3 8 <. 00 1 No 58 (85 .3 ) 8.4 ± 1.9 33 3( 67 .3 ) 6 .8 ± 1 .8 Sour ce of heal th inform at io n P ub lic off ic e 4 ( 5.9 ) 7.2 ± 2.0 1. 83 .0 97 15( 3. 0) 7 .4 ± 2 .4 4. 95 † <.001 a>b W el fare ce nter 2 ( 2. 9) 6. 0± 0. 0 6( 1. 2) 6 .3 ± 0 .8 M ed ical i nsti tuti on 14(2 0. 6) 9. 0± 1. 7 8 9(18 .0 ) 6 .3 ± 1 .8 TV /R ad io 26 (38 .2 ) 8.1 ± 2.0 24 8( 50 .1 ) 6. 4± 1. 6 Internet 2 ( 2. 9) 5. 5± 0. 7 48(9 .7 ) 5 .5 ± 1 .0 b Ne ighbors 16(2 3. 5) 8. 6± 1. 7 67 (13. 5) 6 .6 ± 1 .7 None 4(5 .9 ) 7. 3± 1. 5 16(3 .2 ) 7. 8± 2. 5 a
Ta bl e 2. D if fe renc es i n P oor S el f-R at ed Hea lt h in ter m s of C omo rb id it ie s, V is io n A id s/ H ea lt h In fo rm at io n, Life sty le , an d H ea lt hc ar e Ser vi ces (C on ti nu ed ) (N = 56 3) Var iab le s S evere vi sual i m pai rm ent (n= 68 ) M ild v is ua l im pa ir m en t (n = 49 5) n(% ) M ean± S D t or F /W el ch p S cheff é n(% ) M ean± S D t or F /W el ch p Sch eff é Sour ce of heal th inform at io n P ubl ic o ffi ce 4 ( 5 .9 ) 7. 2± 2. 0 1. 83 .09 7 15 (3. 0) 7 .4 ± 2 .4 4. 95 † <.001 a> b W el fare center 2 ( 2 .9 ) 6. 0± 0. 0 6(1. 2) 6 .3 ± 0 .8 M edi cal i nsti tuti on 14 (20. 6) 9. 0± 1. 7 8 9(18. 0 ) 6 .3 ± 1 .8 TV /R adi o 26 (38. 2) 8. 1± 2. 0 248 (50. 1) 6 .4 ± 1 .6 In te rn et 2 ( 2. 9) 5. 5± 0. 7 48(9 .7 ) 5. 5± 1. 0 b Nei ghbors 16 (23. 5) 8. 6± 1. 7 6 7(13. 5 ) 6 .6 ± 1 .7 None 4 (5. 9) 7. 3± 1. 5 16 (3. 2) 7. 8± 2. 5 a N ee ded heal th inform at io n categori es Heal thy lif e 19 (27. 9) 8. 0± 1. 8 0. 44 .81 8 173 (34. 9) 6 .3 ± 1 .7 1. 78 † .1 28 D isease 24 (35. 4) 8. 5± 2. 3 200 (40. 4) 6 .5 ± 1 .7 Preventi ve ch ecku p 12 (17. 6) 8. 3± 1. 3 7 1(14. 3 ) 6 .1 ± 1 .6 R eh ab ilita tio n 9(1 3. 2) 8.2 ± 1.8 21 ( 4.2 ) 7 .3 ± 1 .8 M edi cal i nsti tuti on 0( 0. 0) 11( 2. 2) 6 .0 ± 1 .5 H andi cappe d assi sti ve devi ce 4( 5 .9 ) 8.2 ± 2.5 7( 1.4) 6. 0± 1. 5 Li festyl e Smo ki ng Y es 13 (19. 1) 8. 4± 1. 5 0. 24 .62 3 92 (1 8.6) 6. 0± 1. 3 10 .6 2 .0 01 No 55 (80. 9) 8. 1± 2. 0 403 (81. 4) 6 .5 ± 1 .8 Dr in ki ng Y es 23 (33. 8) 7. 9± 1. 8 0. 63 .42 8 173 (34. 9) 5 .8 ± 1 .2 44 .7 2 <. 00 1 No 45 (66. 2) 8. 3± 1. 9 322 (65. 1) 6 .8 ± 1 .8 E xer ci se Y es 44 (64. 7) 8. 2± 1. 9 0. 29 .76 7 299 (60. 4) 6 .2 ± 1 .4 -3. 45 .00 1 No 24 (35. 3) 8. 1± 2. 0 196 (39. 6) 6 .8 ± 2 .0 R egu la r m eal s Y es 51 (75. 0) 8. 3± 2. 0 0. 94 .33 5 341 (68. 9) 6 .4 ± 1 .7 0. 63 .42 6 No 17 (25. 0) 7. 8± 1. 6 154 (31. 1) 6 .5 ± 1 .6 Bal anced di et Y es 27 (39. 7) 8. 3± 2. 4 0. 4 0 † .6 75 188 (38. 0) 6 .0 ± 1 .4 18. 3 6 † <.001 S ometi mes 34 (50. 0) 8. 2± 1. 6 242 (48. 9) 6 .5 ± 1 .7 N o 7( 10. 3) 7.7 ± 1.5 65 (1 3.1) 7. 6± 2. 1 BMI (k g/ m 2) <1 8. 0 5( 7 .4 ) 8.0 ± 2.2 0. 50 .68 4 31 (6. 3) 7 .5 ± 2 .5 2. 63 † .0 53 18. 0 –24. 9 39 (57. 3) 8. 6± 1. 9 341 (68. 9) 6 .4 ± 1 .7 ≥ 25 24 (35. 3) 7. 9± 1. 8 123 (24. 8) 6 .4 ± 1 .6 Heal th c ar e ser vi ces Heal th s er vi ce use Y es 65 (95. 6) 8. 2± 1. 9 1. 42 .15 9 485 (98. 0) 6 .4 ± 1 .7 -0. 06 .94 9 N o 3 ( 4. 4) 6.6 ± 2.0 1 0 ( 2.0) 6. 5± 2. 4 Heal th c heckup Y es 45 (66. 2) 8. 4± 1. 7 1. 60 .11 2 418 (84. 4) 6 .3 ± 1 .6 -3. 82 <.0 01 No 23 (33. 8) 7. 7± 2. 1 7 7(15. 6 ) 7 .3 ± 2 .1 † W el ch test
severe visual impairment group who did not use smartphones (p=.001) or the Internet (p=.031) scored higher on poor self-rated health. Individuals with mild visual impairment who did not use a smartphone, computers, and those who had no source of health information as opposed to those who obtained health information from the Internet (p<.001), scored higher on poor self-rated health.
There was no significant difference in the health status of the severe visual impairment group in terms of lifestyle. However, individuals in the mild visual impairment group who did not smoke (p=.001) or drink (p<.001) or exercise (p=.001) or have a balanced diet (p<.001) had significantly worse self-rated health scores. Not undergoing regular medical checkups was associated with worse self-rated health (p<.001).
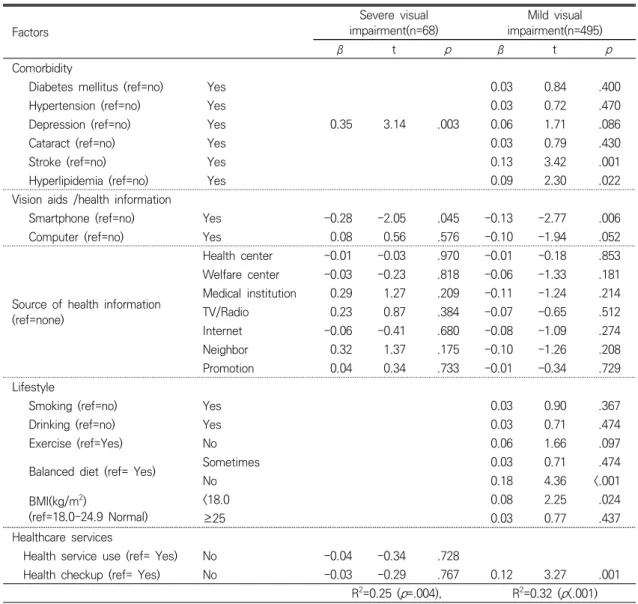
4. Factors Associated with Poor Self-Rated Health According to Acquired Visual Impairment Severity
A regression analysis of the significant variables was performed to identify the factors associated with the self-rated health status of individuals according to acquired visual impairment severity (Table 3).
Depression (p=.003) and smartphone use (p=.045) were associated with poor self-rated health in the severe visual impairment group. Depression worsened self-rated health, while smartphone use was associated with decreased poor self-rated health. The overall explanatory power of this model was 25% and it was statistically significant (p=.004).
Factors associated with poor self-rated health in the mild visual impairment group were stroke (p=.001), hyperlipidemia (p=.022), osteoarthritis (p<.001), smartphone use (ρ=.006), lack of access
to medical care (p=.020), balanced diet (p<.001), low weight (p=.024), and health checkups (p=.001), with lack of balanced diet, having osteoarthritis, stroke, or hyperlipidemia, not undergoing regular medical checkups, and lack of information concerning policies related to the medical care system found to be associated with worsened poor self-rated health, whereas smartphone use was associated with improved self-rated health. The overall explanatory power of this model was 32.3% and it was statistically significant (p<.001).
Ⅳ. Discussion
The approach to managing disability is shifting from a rehabilitation paradigm that emphasizes overcoming physical and mental limitations and utilizing residual ability to a self-reliance paradigm that encourages an individual with disability to carry out daily and social activities (Kempen et al., 2004).
In this study, the severe visual impairment group was found to have poorer self-rated health than the mild visual impairment group, especially in terms of daily activities, self-care, and exercise ability. Among individuals with visual impairments who are considered legally blind, there is a 78% likelihood they will face difficulty in activities of daily living (Sloan, Ostermann, Brown, & Lee, 2005), and these difficulties are a strong predictor of mortality outcomes (Wang, Mitchell, & Smith, 2000). In addition, individuals with severe visual impairment are believed to be more dependent on their sense of proprioception and vestibular system to maintain balance (Horvat et al., 2003). Consequently, if somatosensory system information causes confusion, and if sensitivity in relation to joint and muscle receptors changes, it can become
difficult to walk. Thus, those with acquired visual impairments have difficulty standing up or walking when they become blind, making them more dependent in conducting daily activities, and leading them to become more likely to experience depressive symptoms (Jang, An, & Kim, 2016; Jeon, 2019). Rehabilitation to improve balance should begin from the initial diagnosis
of visual impairment to facilitate the performance of daily activities and self-care without falling. Furthermore, it has been reported that horticulture (Kim, Kim, Lee, Huh, & Choi, 2014), walking (Ackley-Holbrook, Kang, & Morgan, 2016), and exercise (Kim & Lee, 2017) may reduce depressive symptoms in individuals with visual impairment. Interacting with individuals
Table 3. Factors Associated with Poor Self-Rated Health in Individuals according to Acquired Visual
Impairment Severity (N=563) Factors Severe visual impairment(n=68) Mild visual impairment(n=495) β t p β t p Comorbidity
Diabetes mellitus (ref=no) Yes 0.03 0.84 .400
Hypertension (ref=no) Yes 0.03 0.72 .470
Depression (ref=no) Yes 0.35 3.14 .003 0.06 1.71 .086
Cataract (ref=no) Yes 0.03 0.79 .430
Stroke (ref=no) Yes 0.13 3.42 .001
Hyperlipidemia (ref=no) Yes 0.09 2.30 .022
Vision aids /health information
Smartphone (ref=no) Yes -0.28 -2.05 .045 -0.13 -2.77 .006
Computer (ref=no) Yes 0.08 0.56 .576 -0.10 -1.94 .052
Source of health information (ref=none) Health center -0.01 -0.03 .970 -0.01 -0.18 .853 Welfare center -0.03 -0.23 .818 -0.06 -1.33 .181 Medical institution 0.29 1.27 .209 -0.11 -1.24 .214 TV/Radio 0.23 0.87 .384 -0.07 -0.65 .512 Internet -0.06 -0.41 .680 -0.08 -1.09 .274 Neighbor 0.32 1.37 .175 -0.10 -1.26 .208 Promotion 0.04 0.34 .733 -0.01 -0.34 .729 Lifestyle
Smoking (ref=no) Yes 0.03 0.90 .367
Drinking (ref=no) Yes 0.03 0.71 .474
Exercise (ref=Yes) No 0.06 1.66 .097
Balanced diet (ref= Yes) Sometimes 0.03 0.71 .474
No 0.18 4.36 <.001 BMI(kg/m2) (ref=18.0-24.9 Normal) <18.0 0.08 2.25 .024 ≥25 0.03 0.77 .437 Healthcare services
Health service use (ref= Yes) No -0.04 -0.34 .728
Health checkup (ref= Yes) No -0.03 -0.29 .767 0.12 3.27 .001
R2=0.25 (p=.004), R2=0.32 (p<.001)
with similar experiences, through sports, may help individuals with visual impairment become psychologically stable and facilitate a series of re-socialization processes (Nakade, Rohatgi, Bhatia, & Dhaliwal, 2017).
In this study, 42.6% of the individuals with severe visual impairment and 42.8% of the individuals with mild visual impairment had hypertension, which was much higher than the prevalence rate of hypertension (29.1%) among Korean adults aged over 30 years (Ministry of Health and Welfare, 2019). Hypertension and diabetes mellitus can cause retinal hemorrhage, leading to visual impairment, and bleeding and infarction of other organs, leading to major complications. One previous study (Court et al., 2014) suggested that the number of diseases an individual has is strongly related to self-rated health. Therefore, education on lifestyle improvement and medication is needed to manage hypertension and overall health, as well as to manage factors that may affect health beyond the direct influence of vision-related pathology.
In this study, smartphone use was found to be a common factor associated with being less likely to report poor self-rated health among both the severe visual impairment and the mild visual impairment groups. The number of individuals with visual impairment using smartphones has been increasing recently, as the speech synthesis feature in smartphones allows such individuals to read documents. According to recent studies (Chong et al., 2016; Kim & Song, 2014; Seo, Lee, & Han, 2018), smartphones are being widely used by individuals with visual impairment in South Korea for leisure, as well as to acquire and communicate a variety of information, including information related to health literacy. Health literacy involves a
cognitive social skill that reflects an individual’s ability and motivation to understand and apply health information in order to maintain their health (Nutbeam, 2000), and deficiencies in health literacy are considered a cause of health inequality. Since health literacy affects behavior, such as engaging in health check-ups, immunizations, and medication use, as well as one’s awareness and understanding of one’s own health status (Berkman, Sheridan, Donahue, Halpern, & Crotty, 2011), it is important to increase accessibility to health information. In this study, 30.9% of the severe visual impairment group and 55.4% of the mild visual impairment group who were using smartphones also reported better self-rated health. Smartphones can provide health-related information faster and more accurately. This study indicates that smartphone use is an effective means to increase access to health information and to facilitate interaction with other people among individuals with acquired visual impairment, with mediating effects on self-rated health. Therefore, easily -accessible health-related applications for individuals with visual impairment may help improve individuals’ health literacy and thereby, their health behavior.
Further, depressive symptoms were associated with poor self-rated health in the severe visual impairment group. Individuals with acquired visual impairment experience a painful process involving elements of despair and sadness after losing their vision (Kwon & Park, 2019), and experience restrictions in their daily activities, which can lead to such individuals feeling alienated from society. Those with acquired visual impairment who become blind tend to experience more stress compared to those with congenital visual impairment. They also tend to experience more difficulty managing their vision
loss, which brings about significant physical, psychological, social, and economic changes (Jones, Rovner, Crew, & Danielson, 2009; Song & Oh, 2017). In this study, 14.7% of the severe visual impairment group had depression. Leo, Hickey, Meneghel, and Cantor (1999) reported that the incidence of depression in those with severe visual impairment was 2–5 times higher than that in the general population. However, although the incidence of depression in those with visual impairment is higher than in those with other disabilities, the prevalence of psychiatric counseling to manage depression in those with visual impairment is reportedly lower (Shim & Han, 2012). Depression is a treatable condition and can be identified through screening (Jones et al., 2009). Thus, providing guidance and education to help individuals with visual impairment to manage their emotions, as well as educating family members on how to respond to the emotional needs of individuals with visual impairment, might help reduce the incidence of depression among this vulnerable population.
Comorbidities (stroke, hyperlipidemia, and osteoarthritis), unbalanced diet, and low weight were associated with poor self-rated health in the mild visual impairment group. Older adults with visual impairment, especially those who live alone, have difficulties in buying and preparing food, which may lead to nutritional problems. Moreover, for those with diabetes mellitus, a balanced diet is crucial along with medication to prevent diabetic retinopathy from worsening. In this study, 23.5% of the individuals with severe visual impairment and 24.4% of the individuals with mild visual impairment had diabetes mellitus, approximately twice the prevalence of diabetes (11.3%) within the general Korean population over 30 years of age. Park et al. (2018) reported that those with severe visual impairment have
the highest mortality rate from diabetes mellitus among those in their 30s. Individuals with diabetes mellitus must continuously manage their diet and blood sugar levels. One case study on the possibility of self-care among patients with diabetes mellitus who were totally blind (Villeneuve, McVey, & Steinberg, 1983) reported that these patients were capable of self-care through being educated on the importance of self-care, being given consistent encouragement, and being trained in the use of insulin injection through touch, as well as through undergoing cycle ergometer training, and repetitive diet training. Because individuals with acquired visual impairment have restricted capabilities in their roles, individual differences should be taken into consideration in their self-care (Jeon, 2019; Leksell et al., 2005). A blood glucose monitor for the visually impaired has been developed, which provides glucose measurement information verbally. Further, Flex-Pens or Mirio-Pens are available, which involve the use of labels or color codes to indicate different types of insulin for patients with low vision and, for individuals who are blind, braille or tactile codes can be used to help such individuals distinguish different types of hypoglycemic agents or insulin. In addition, individuals’ activities and exercise choices need to be assessed to help them exercise safely.
Furthermore, health checkups were associated with poor self-rated health in those with mild visual impairment. The health check-up rate among individuals with mild visual impairment was 84.4%, which was higher than that of the general Korean population (79.8%) over the age of 40 years in 2017 (Shim & Han, 2012). Since malignant neoplasms, heart diseases, and diabetes mellitus are the main causes of death for individuals with mild visual impairment (Park
et al., 2018), it is necessary to ensure that they undergo health checkups to detect and treat any such diseases.
This study, which assessed factors associated with poor self-rated health through classifying individuals with acquired visual impairment into either severe or mild visual impairment groups using nationally-representative data, has important implications. It provides valuable baseline findings to help devise more tailored healthcare policies for individuals with acquired visual impairment in consideration of their disability severity. It also reinforces the need for nurses and other healthcare professionals to provide detailed care for individuals with acquired visual impairment through assessing their comorbidities and lifestyle. However, this study has some limitations. First, the cross-sectional design of the study precludes causal inferences. Second, there may have been recall bias when individuals were responding to the items concerning their health behavior.
Ⅴ. Conclusion
As the self-rated health of the severe visual impairment group was found to be significantly poor, rehabilitation in relation to performing daily activities and self-care and interventions to improve exercise abilities are needed. Depression was confirmed as a serious challenge for those with severe visual impairment. Nurses and healthcare professionals in related fields need to be aware of how individuals are likely to be struggling due to their blindness and help such individuals manage their disability more effectively while remaining independent so that they can continue to engage in social activities.
For the mild visual impairment group, having a comorbidity, not having a balanced diet, not
undergoing regular medical checkups, and lack of health-related information were found to have a worsened effect on their self-rated health. Smartphone use, however, was associated with better self-rated health.
It was notable that smartphone use helped alleviate poor self-rated health in both groups. Although this cross-sectional study could not identify a causal relationship between these two variables, it would seem that smartphone use may predict improved health literacy. Therefore, an application that provides disease- and health -related information to encourage behavioral change may well improve accessibility to relevant information and promote health behavior. Lastly, an Internet-based educational platform for establishing social networks and fostering self-management is needed, since most individuals with acquired visual impairment were found not to know braille and to have reduced mobility.
References
Ackley-Holbrook, E., Kang, M., Morgan, D. W. (2016). Development and evaluation of the walk for health program: A physical activity intervention for adults with visual impairments. Journal of Visual Impairment & Blindness, 110(2), 103–114.
https://doi.org/10.1177/0145482X1611000204 Berkman, N. D., Sheridan, S. L., Donahue, K. E.,
Halpern, D. J., & Crotty, K. (2011). Low health literacy and health outcomes: An updated systematic review. Annals of Internal Medicine, 155(2), 97–107.
https://doi.org/10.7326/0003-4819-155-2-20 1107190-00005
Chong, M. F., Jackson, A., J., Wolffsohn, J. S., & Bentley, S. A. (2016). An update on the characteristics of patients attending the
Kooyong Low Vision Clinic. Clinical and Experimental Optometry, 99, 555-558. https://doi.org/10.1111/cxo.12395
Court, H., McLean, G., Guthrie, B., Mercer, S. W., & Smith, D. J. (2014). Visual impairment is associated with physical and mental comorbidities in older adults: A cross-sectional study. BMC Medicine, 12, 181-187.
https://doi.org/10.1186/s12916-014-0181-7 Horvat, M., Ray, C., Ramsey, V., Miszko, T., Keeney,
R., & Blasch, B. (2003). Compensatory analysis and strategies for balance in individuals with visual impairments. Journal of Visual Impairment & Blindness, 97(11), 695–703.
https://doi.org/10.1177/0145482X0309701103 Jang, H. Y., An, J. H., & Kim, J. H. (2016). The
effects of 8-weeks gym-ball exercise program on the body composition and health-related physical fitness and plantar foot pressure on female students with visual impairments. The Korean Journal of Physical Education, 55(5), 729–740.
Jeon, E. (2019). Needs assessment of health education for adults with lately visual impairments using focus group interview. Journal of Digital Convergence, 17(2), 319–328. https://doi.org/10.14400/JDC.2019.17.2.319 Jones, G. C., Rovner, B. W., Crew, J. E., &
Danielson, M. L. (2009). Effects of depression symptoms on health behavior practices among older adults with vision loss. Rehabilitation Psychology, 54(2), 164–172. https://doi.org/10.1037/a0015910
Kempen, J. H., Mitchell, P., Lee, K. E., Tielsch, J. M., Broman, A. T., Taylor, H. R., Ikram, M. K., Congdon, N. G, & O'Colmain, B. J. (2004). The prevalence of refractive errors among adults in the United States, Western Europe, and Australia. Archives of Ophthalmology, 122(4), 495–505.
https://doi.org/10.1001/archopht.122.4.495 Kim, H. C., & Lee, Y. M. (2017). The effect of a
12 week-yoga exercise on body composition, flexibility and gloom in the visually impaired elderly. Journal of the Korea Convergence Society, 8(3), 253–263.
https://doi.org/10.15207/JKCS.2017.8.3.253 Kim, K. S., & Song, B. S. (2014). Investigation of
mobile accessibility in accordance with the smartphone use for people with visual disabilities. The Korean Journal of Visual Impairment, 30(4), 109–125.
Kim, M. J., Kim, I., Lee, N., Huh, K. Y., & Choi, K. O. (2014). Effects of horticultural therapy on depression and self-esteem of elderly visual disabilities. Journal of Korean Society for People, Plants and Environment. 17(6), 433–440.
https://doi.org/10.11628/ksppe.2014.17.6.433 Kwon, J., & Park, S., (2019). A narrative study on
the experiences of facing and coping the crisis in the wives of men having impairment. Journal of Korean Public Health Nursing, 33(2), 242-257.
http://dx.doi.org/10.5932/JKPHN.2019.33.2.242 La Forge, R. G., Spector, W. D., & Sternberg, J.
(1992). The relationship of vision hearing impairment to one-year mortality and functional decline. Journal of Aging Health. 4, 126-148.
Leksell, J. K., Sandberg, G. E., & Wikblad, K. F. (2004). Self-perceived health and self-care among diabetic subjects with defective vision: A comparison between subjects with threat of blindness and blind subjects. Journal of Diabetes and its Complications, 19(1), 54-59.
https://doi.org/10.1016/j.jdiacomp.2004.04.002 Leo, D., Hickey, P. A., Meneghel, G., & Cantor,
and suicide. Psychosomatics, 40, 339-44. https://doi.org/10.1016/S0033-3182(99)71229-6 Ministry of Health and Welfare. (2019). Statistics
of Korean health. Retrieved November 20, 2020 from
http://www.index.go.kr/potal/main/EachDtlP ageDetail.do?idx_cd=1438
Ministry of Health and Welfare. (2019). Crireria for degree of disability. Retrieved January 11, 2020 from
http://www.mohw.go.kr/react/jb/sjb0406vw.j sp?PAR_MENU_ID=03&MENU_ID=030406&pa ge=1&CONT_SEQ=349906
Nakade, A., Rohatgi, J., Bhatia, M. S., & Dhaliwal, U. (2017). Adjustment to acquired vision loss in adults presenting for visual disability certification. Indian Journal of Ophthalmology. 65(3),228–232.
https://doi.org/10.4103/ijo.IJO_483_16 Ni, L., Li, K., Jiang, L., Chen, J., Chen, Y., Li, X.,
Lin, N., Thorn, F., & Deng, R. (2020). A nurse’s perspective on visual rehabilitation of outpatients with low vision in China. Rehabilitation Nursing, 45(1), 45-53. https://doi.org/10.1097/rnj.0000000000000178 Nutbeam, D. (2000). Health literacy as a public
health goal: A challenge for contemporary health education and communication strategies in the 21st century. Health Promotion International, 15(3), 259–267.
https://doi.org/10.1093/heapro/15.3.259 Park, J. W., Im, H. T., & Kim, D. W. (2018).
Compare of the etiology of motality and quality of life between visual impairments and other disabilities(NHIS-2019-2-019). Ilsan, South Korea: National Health Insurance Service Ilsan Hospital. Retrieved November 20, 2020 from www.alio.go.kr.
Seo, S. J., Lee, S. Y., & Han, D. I. (2018).
Experience analysis of a adolescent with visual impairment addiction use of smart phone. Journal of Special Education & Rehabilitation Science, 57(1), 85–105. Shim, J. W., & Han, S. H. (2012). Preventive
health examination, health behavior, and psychological health in visual disabilities. Journal of the Korean Ophthalmological Society, 53(12), 1870–1878.
https://doi.org/10.3341/jkos.2012.53.12.1870 Sloan, F. A., Ostermann, J., Brown, D. S., & Lee,
P. P. (2005). Effects of changes in self- reported vision on cognitive, affective, and functional status and living arrangements among the elderly. American Journal of Ophthalmology. 140(4), 618–627.
http://doi.org/10.1016/j.ajo.2005.01.019 Song, N., & Oh, S. (2017). The lived experience
of suffering from vision loss in adults with acquired visual impairment. Journal of Korean Association for Qualitative Research, 2, 45–55.
Terris, M. (1984). Newer perspectives on the health of Canadians: Beyond the Lalonde report. The Rosenstadt Lecture. Journal of Public Health Policy, 5(3), 327–337. https://doi.org/10.2307/3342158
Villeneuve, M. E., McVey, E., & Steinberg, F. (1983). Self care for the totally blind diabetic: it is possible. RN, 46(6), 38-9. Wang, J. J., Mitchell, P., & Smith, W. (2000).
Vision and low self-rated health: The Blue Mountains Eye Study. Investigative Ophthalmology & Visual Science. 41(1), 49-54.
World Health Organization. (2019). World report on vision. Retrieved October 19, 2020 from https://www.who.int/publications-detail/worl d-report-on-vision
ABSTRACT
Factors Associated with Poor Self-rated Health according to Visual
Impairment Severity
*Jeon, Eunyoung (Professor, Department of Nursing, Daegu University)
Purpose: To identify the factors associated with poor self-rated health in individuals with
acquired visual impairment through classification of such individuals into severe and mild visual impairment groups. Methods: This descriptive, cross-sectional, survey-based study analyzed data from 563 individuals with visual impairment due to acquired causes who had been recruited in the 2017 Korean National Survey on Persons with Disabilities. Results: Individuals with severe visual impairment reported poorer self-rated health. Mild depression (p=.003), and low smartphone use (p=.045) were associated with poorer self-rated health in those with severe visual impairment. The factors associated with poor self-rated health in those with mild visual impairment were comorbidities, low smartphone use (p=.006), needed health information (p=.020), unbalanced diet (p<.001), low weight (p=.024), and lack of health checkups (p=.001). Conclusion: Depression was found to be a predictor of poor self-rated health in individuals with severe visual impairment, which highlights the need for nursing and related healthcare intervention to lower depression in this specific population. Further, promoting social network building and providing health information using smartphones may serve to encourage appropriate health behavior in people with severe visual impairment who have reduced mobility and health literacy.
Key words : Acquired visual impairment, Poor health, Comorbidity, Health promotion * This work was supported by Daegu University Research Grant in 2016 (No. 20160321).