Environmental Science
Vol. 37, No. 1, pp. 25-34, March, 2021 https://doi.org/10.7747/JFES.2021.37.1.25
Coastal Afforestation Effect on Soil
Physiochemical Properties at Sitakunda Coast of
Chittagong, Bangladesh
Abdullah-Al Mamun1, Md. Humayain Kabir1,2,*, Mohammed Abdul Kader1 and Mohammed Kamal Hossain1 1Institute of Forestry and Environmental Sciences, University of Chittagong, Chittagong 4331, Bangladesh
2Wegener Center for Climate and Global Change, University of Graz, Graz 8010, Austria
Abstract
This study was conducted at Sitakunda coastal afforestation range, comprised of four beats- Bansbaria, Bakkhali, Baterkhil and Bogachattar, in Chittagong. Afforestation effects on soil physicochemical properties in comparison to adjacent barren land were analysed. In the study area, an area of 3277.33 ha was planted with Sonneratia apetala, Avecinnia officinalis,
Excoecaria agallocha, Bruguiera sexangula, Ceriops decandra from 1968 to 2011. We found positive soil physicochemical changes in plantations in comparison to adjacent barren land. Soil bulk density of plantation was lower than the adjacent barren land. Soil pH and soil salinity were significantly higher in barren land whereas soil organic matter, organic carbon, nitrogen, phosphorus, potassium of plantations were higher in afforested land. Soil texture ranged from clay loam to sandy loam in different depth of these two types of land. However, this study concludes that there is clear evidence that afforestation has positive impacts on all soil properties in different location and soil depths in the study area.
Key Words: coastal afforestation, coastal stabilization, physiochemical properties, soil analysis
Received: August 10, 2020. Revised: December 28, 2020. Accepted: December 28, 2020. Corresponding author: Md. Humayain Kabir
Institute of Forestry and Environmental Sciences, University of Chittagong, Chittagong 4331, Bangladesh Tel: +880312606144, Fax: +880312606014, E-mail: [email protected]
Introduction
Coastal area of Bangladesh is raised mainly due to de-posited sediments from three mighty rivers (The Ganges, The Bramaputra and The Meghna) and many smaller rivers. A total of 710 km long coastline in Bangladesh is divided into three distinct geographic regions- West zone, Central zone and East zone which lies in between latitude 21-23°N and longitude 89-93°E (Siddiqi 2001). Bangladesh, particularly in coastal area, frequently suffers from devas-tating floods, cyclones and tidal surge, tornadoes, riverbank erosion and drought as well as constituting a very high risk location for devastating seismic activity (Sarwar 2005;
Brammer 2014).
Plantation affects the soil texture in this coastal area. Studies indicate that soil texture along coast is directly in-fluenced by the vegetation type. Mangrove soils are neutral to slightly alkaline in reaction with high salt content (Pal et al. 1996). Soil texture in the coastal area of Bangladesh is commonly silty clay. Hasan (2000) stated that the west soil is mostly clayey with high quantity of silt; the beach in the southeastern (eg. Noakhali and Chittagong) part is sandy of Bangladesh. Kankra (Bruguiera gymnorrhiza) planta-tion in the coastal area binds the sediments with their spe-cial type of rooting system (Bandyopadhyay 1995). Soil pH varies 7.52 to 8.3 in various offshore islands and mainland
Fig. 1. Map of Sitakunda coastal area of Bangladesh (Source: Banglapedia).
of Bangladesh indicating that soil is slightly or moderately alkaline (Hasan 2000). This soil pH is one of the most im-portant soil factors influencing vegetation structure in the mangrove areas (Kusmana 1990). Cardona and Boetro (1998) found alkaline soil in the plantation of Baen (Avicennia officinalies in Tamil Naru, India while lower pH was in Choyla (Sonneratia caseolaris) plantation in the Caribbean coast of Colombia. Sukardjo (1978) conducted a study on the characteristics of Mangrove soil in Northern Coast of West java, Indonesia found that area covered with
Avicennia officinalis showed higher pH value (7.80) than
Avicennia marina (6.50). In Bangladesh, few studies have been done on the growth performance of mangrove planta-tion, regeneration status and its effect on soil properties in the coastal area (Haque et al. 2000; Siddiqi 2001; Zafar 2003; Kabir 2005; Saifullah et al. 2009). However, there is a significant research gap on the effects of coastal affor-estation in Sitakunda Range in Chittagong. Therefore, this study is aimed at assessing the effects of coastal plantations on soil physical and chemical properties in different land use. This study provides new information that will add val-ue for taking relevant policies to improve the soil pro-ductivity in the coastal area of Bangladesh.
Materials and Methods
Description of the study area
Sitakunda Coastal Afforestation Range belongs to Chittagong Coastal Afforestation division lead by Bangladesh Forest Department. This afforestation program was started in 1968. This afforestation project is situated between the Water and Power Development Authority (WAPDA) em-bankment and the Sandwip channel. There are four beats under Sitakunda Coastal Afforestation Range namely Bansbaria, Baterkhil, Bakkhali and Bogachattar. Till 2011, the total area of this range was about 3830.16 ha of which 3094.24 ha mangrove, 183.09 ha non-mangrove and 153.5 km strip plantation.
The vegetation of this coastal afforestation range com-prises of completely of planted tree species. It constitutes the plantation of different years from 1968 to 2012. The main mangrove tree species planted in this forest are
Sonneratia apetala, Avicennia officinalis, Excoecaria agallo-cha, Ceriops decandr. Besides, some on-mangrove tree
spe-cies such as Akashmoni (Acacia auriculiformis), Sissoo (Dalbergia sissoo), Babla (Acacia nilotica), Narikel (Cocos nucifera) are raised to evaluate their performance in the area. In the study area 80% has been planted with
Sonneratia apetala, 18% with Avicennia officinalis and the rest 2% with other mangrove and non mangrove species. The area is also covered with a number of undergrowth such as Hargoza (Acanthus ilicifolius), Nunia (Portulaca oleracea).
Sampling procedure
Coastal plantation and barren land of the study area (Fig. 1) were divided into three land strips called inland, middle and sea side. Each land strips were divided into three plots of 20 m×20 m size. Thus, 24 plots were created for each of the paired lands, e.g. plantation and barren site. From each plot 3 replicated samples were collected at a depth of 0-15 cm, 15-30 cm and 30-45 cm using augur and mixed togeth-er to make a composite sample. A total of 72 composite soil samples were collected. Collected samples were bought to the laboratory in appropriate labeled poly bags for the sub-sequent analyses. For the determination of bulk density, seventy two undisturbed soil samples were collected by us-ing core in the field from upper layer. The cores were driven
Ta bl e 1 . Soil te xture u nde r coastal pl antation and adjacent bar re n land across the three la nd strips at 0 -15 cm depth i n Si tak unda Coas tal A
fforestation Range, Chitta
gong coastal forest divisio
n Be at L an d us e Inl and Middl e Sea sh ore Sa nd (% ) Sil t (%) C la y (%) Te xt ur e Sa nd (%) Sil t (%) C la y (%) Te xtu re Sa nd (%) Sil t (%) C la y (% ) Te xt ur e Ban sb ar ia P la nt at io n 33. 18± 2. 32 54. 72± 2. 61 12 .10 ± 2. 26 Silty loam 49 .48 ± 2. 57 42. 5± 1. 33 8 .0 2± 1. 44 Lo am 35 .48 ± 2. 38 51 .08 ± 2. 13 13. 40± 1. 12 Si lt B ar re n 32. 16± 2. 15 52. 92± 1. 87 14 .92 ± 1. 16 Silt loam 58 .9 6± 1. 41 34 .2 3± 1. 64 6. 81±0. 68 Sa nd y lo am 53 .28 ± 2. 91 30 .52 ± 1. 50 16. 20± 1. 01 L oa m Bakkh al i P la nt at io n 55. 28± 1. 98 30. 52± 1. 68 14 .20 ± 1. 67 L oam 44 .29 ± 2. 06 34 .87 ± 1. 21 2 0. 84 ± 0. 52 Sa nd y cl ay 41 .89 ± 1. 29 33 .21 ± 1. 47 24. 90± 0. 77 Sa nd y cl ay B ar re n 47. 29± 2. 18 30. 87± 1. 39 21 .84 ± 2. 29 Sa nd y cl ay loam 50 .25 ± 1. 92 30 .50 ± 0. 76 19 .2 25 ± 1. 36 Lo am 40 .59 ± 1. 74 33 .60 ± 0. 96 24. 91± 0. 63 Sa nd y cl ay loam Bat er kh il P la nt at io n 58. 08± 2. 31 26. 35± 2. 42 15 .7± 0. 83 Sa nd y lo am 40 .5 9± 2.2 8 33 .6 0± 0.8 6 2 4. 91 ± 0. 98 Sa nd y cl ay loam 48 .06 ± 1. 36 34 .22 ± 1. 11 17. 72± 1. 16 Sa nd y cl ay loam B ar re n 66. 55± 2. 02 28. 26± 1. 83 5. 19± 0. 97 Sa nd y lo am 52 .4 4± 1.5 3 34 .1 3± 1.0 6 1 3. 43 ± 0. 53 Sa nd y lo am 40 .59 ± 1. 18 33 .60 ± 1. 30 24. 91± 1. 53 Sa nd y cl ay loam Boga ch at ta r P la nt at io n 61. 85± 2. 12 54. 21± 2. 06 23 .94 ± 1. 34 Silt loam 42 .44 ± 1. 43 44 .13 ± 1. 31 1 3. 43 ± 1. 23 Lo am 48 .08 ± 1. 45 44 .56 ± 2. 05 7. 36± 0. 34 C la y lo am B ar re n 62. 27± 1. 68 27. 15± 1. 69 10 .58 ± 1. 11 Sa nd y lo am 21 .08 ± 2. 12 68 .48 ± 2. 30 2 1. 84 ± 1. 34 Si lt 64 .26 ± 2. 30 28 .39 ± 0. 93 7. 35± 0. 38 C la y lo am Note : Ea ch v al ue is th e mea n of soil sa mp le un der diff er en t la nd uses at di ffe re nt loca tions.
Fig. 2. Bulk density (gm/cc) at three different land positions in Sitakunda coastal afforestation range.
vertically into the soil using a wooden hammer. The cores were then carefully dug out using a sharp knife and excess soil from the bottom end was removed before the soil for each core placed into a labeled plastic bag. Thus, both the ends of the cores were wrapped with two small pieces of cloths and rubber band and carried in a labeled plastic bag to the laboratory for subsequent analysis.
Soil analysis
Collected moist soil samples were first sieved through 10 mm mesh sieve to remove gravel, small stones and coarse roots, and then passed through 2 mm sieve. Then the sieved sample was mixed thoroughly and stored at room tem-perature. Field moist soil samples were used for determin-ing pH. Oven dry samples were used to determine organic carbon, organic matter, K, P, N, CEC. The sieved samples were then dried at 25°C to determine soil texture (Huque et al. 2005), pH (using digital pH meter TOA, Japan), and moisture content (oven dry method by Huque et al. 2005) and oven dried at 105°C for 8 h to analyze organic carbon (loss of ignition method by Ball 1964), particle density (Huque et al. 2005) and total nitrogen (Micro-Kjeldahl di-gestion procedure). Soil texture was assessed by hydro-meter method, moisture content, pH (1:2 soil water ratio), soil salinity, available P (Bray and Kurtz method), available N, K and Ca according to Huq et al. (2005) and Petersen (2002).
Results
Soil texture
Soil texture in the plantation and barren land in all the three land positions under Sitakunda coastal range were heterogeneous and it varied from silty clay loam to sandy
loam (Table 1). Clay content was higher in plantation in comparison to adjacent barren land. In the study area, planted sites had higher clay particle and lower sand particle compared to barren land. These findings conclude that planted soils captured some of clay particles suspended in water by the pneumatophores and other vegetative parts of the plantation species.
Soil density
Bulk density on the surface soil in barren land almost at all the land positions was slightly higher in comparison to adjacent plantation sites. In other words, soil under planta-tions and adjacent barren land did not show remarkable dif-ference in bulk density (Fig. 2)
Soil pH
In general, the barren coastal land shows higher soil pH in comparison to the adjacent coastal plantation site. Significant difference in soil pH was found with a few ex-ception at all the three depths at all the three land positions. In Bogachattar beat, at 0-15 cm depth soil pH was sig-nificantly higher (8.03) in barren land in comparison to ad-jacent plantations site (7.53) in sea shore. In Bakkhali beat, at 0-15 cm depth soil pH was significantly higher (8.27) in barren land in comparison to adjacent plantations site (8.0) in middle. At 15-30 cm and 30-45 cm depth no significant difference was found. The highest pH (8.27) was attained by 0-15 cm depth at middle barren land and lowest (8.0) was achieved by inland plantations at 15-30 cm depth and middle plantations at 0-15 cm and 15-30 cm depth (Table 2). In Baterkhil beat, the highest pH (8.33) was attained by 0-15 cm depth at middle barren land and lowest (7.47) was attained by middle barren land at 30-45 cm depth. In Bansbaria beat, soil pH was significantly higher in barren
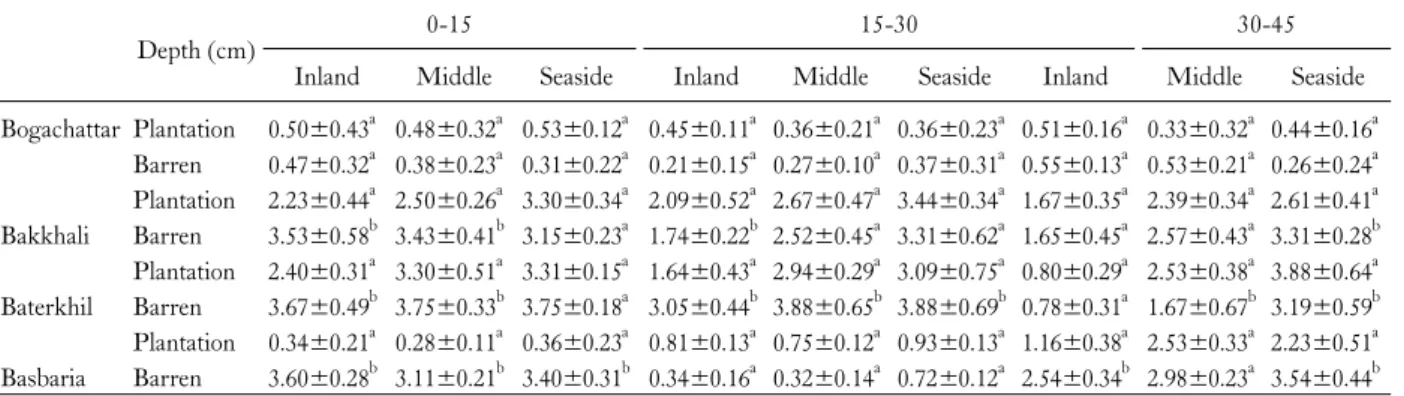
Table 3. Soil salinity at different depth of three different land positions in Sitakunda range
Depth (cm) 0-15 15-30 30-45
Inland Middle Seaside Inland Middle Seaside Inland Middle Seaside
Bogachattar Plantation 0.50±0.43a 0.48±0.32a 0.53±0.12a 0.45±0.11a 0.36±0.21a 0.36±0.23a 0.51±0.16a 0.33±0.32a 0.44±0.16a Barren 0.47±0.32a 0.38±0.23a 0.31±0.22a 0.21±0.15a 0.27±0.10a 0.37±0.31a 0.55±0.13a 0.53±0.21a 0.26±0.24a Plantation 2.23±0.44a 2.50±0.26a 3.30±0.34a 2.09±0.52a 2.67±0.47a 3.44±0.34a 1.67±0.35a 2.39±0.34a 2.61±0.41a Bakkhali Barren 3.53±0.58b 3.43±0.41b 3.15±0.23a 1.74±0.22b 2.52±0.45a 3.31±0.62a 1.65±0.45a 2.57±0.43a 3.31±0.28b Plantation 2.40±0.31a 3.30±0.51a 3.31±0.15a 1.64±0.43a 2.94±0.29a 3.09±0.75a 0.80±0.29a 2.53±0.38a 3.88±0.64a Baterkhil Barren 3.67±0.49b 3.75±0.33b 3.75±0.18a 3.05±0.44b 3.88±0.65b 3.88±0.69b 0.78±0.31a 1.67±0.67b 3.19±0.59b Plantation 0.34±0.21a 0.28±0.11a 0.36±0.23a 0.81±0.13a 0.75±0.12a 0.93±0.13a 1.16±0.38a 2.53±0.33a 2.23±0.51a Basbaria Barren 3.60±0.28b 3.11±0.21b 3.40±0.31b 0.34±0.16a 0.32±0.14a 0.72±0.12a 2.54±0.34b 2.98±0.23a 3.54±0.44b Note: Each value is the mean of soil sample under different landuses at different locations. The same lowercase letter within each soil depth indicates no significant difference (p<0.05).
Table 2. Soil pH at different depth of three different land positions in Sitakunda range.
Depth 0-15 cm 15-30 cm 30-45 cm
Inland Middle Seaside Inland Middle Seaside Inland Middle Seaside
Bogachattar Plantation 7.87±0.23a 8.07±0.45a 7.53±0.74a 8.27±0.55a 8.13±0.36a 8.13±0.22a 7.80±0.55a 8.13±0.53a 7.63±0.43a Barren 8.07±0.31b 8.03±0.51a 8.03±0.36b 8.40±0.43a 8.27±0.24a 8.20±0.28a 8.13±0.46b 8.13±0.34a 8.17±0.33b Bakkhali Plantation 8.00±0.28a 8.00±0.49a 8.07±0.57a 8.10±0.23a 8.00±0.34a 8.07±0.45a 8.13±0.33a 8.17±0.45a 8.07±0.37a Barren 8.10±0.24a 8.27±0.33a 8.23±0.45a 8.10±0.32a 8.17±0.67a 8.17±0.61a 8.10±0.27a 8.07±0.22a 8.10±0.44a Baterkhil Plantation 7.97±0.47a 7.70±0.36a 7.87±0.33a 7.97±0.49a 8.07±0.48a 7.93±0.54a 8.17±0.48a 7.97±0.35a 7.90±0.36a Barren 8.20±0.65b 8.33±0.73b 8.30±0.26b 8.20±0.29a 8.10±0.36a 8.17±0.45a 8.13±0.51a 7.47±0.61b 8.00±0.26a Basbaria Plantation 7.10±0.47a 7.10±0.83a 7.10±0.34a 8.00±0.65a 7.50±0.44a 7.60±0.29a 7.97±0.47a 7.90±0.68a 7.87±0.48a Barren 7.83±0.44a 8.10±0.67b 8.07±0.65b 8.03±0.27a 8.37±0.21b 8.77±0.34b 8.07±0.23a 7.93±0.44a 8.00±0.39a Note: Each value is the mean of soil sample under different landuses at different locations. The same lowercase letter within each soil depth indicates no significant difference (p<0.05).
land in comparison to adjacent plantation sites. The highest pH (8.77) was achieved by 15-30 cm depth at seashore bar-ren land and lowest (7.1) was achieved by 0-15 cm depth.
Soil salinity
In Bansbaria beat, at 0-15 cm depth inland barren showed significantly higher soil salinity (3.60 ds/m) in comparison to plantations site (2.34 ds/m) and middle plantation showed no significant difference and sea side plantations showed significantly higher soil salinity (4.03 ds/m) in comparison to adjacent barren land (3.40 ds/m). In Bakkhali beat, at 0-15 cm depth inland barren showed significantly higher soil salinity (3.53 ds/m) in comparison to plantations site (2.23 ds/m). Middle and sea side showed no significant difference. At 15-30 cm depth barren inland
showed significantly higher soil salinity (3.43 ds/m) in comparison to adjacent plantation site (2.50 ds/m). Seaside and middle showed no significant difference. At 30-45 cm depth, sea side plantation showed significantly higher soil salinity (5.60 ds/m) in comparison to adjacent barren land (5.31 ds/m) (Table 3). In Baterkhil beat, at 0-15 cm depth inland, middle and sea side barren showed significantly higher soil salinity (3.66 ds/m, 3.75 ds/m, 3.75 ds/m) in comparison to plantations site (2.40 ds/m, 3.30 ds/m and 3.31ds/m) respectively. At 15-30 cm depth barren barren middle showed significantly higher soil salinity (3.88 ds/m) in comparison to adjacent plantation site (2.64 ds/m). Seaside and inland showed no significant difference. At 30-45 cm depth, seaside plantation showed significantly higher soil salinity (3.61 ds/m) in comparison to adjacent
Table 5. Soil organic carbon (%) at different depth of three different land positions in Sitakunda range Depth
(cm)
0-15 15-30 30-45
Inland Middle Sea shore Inland Middle Sea shore Inland Middle Sea shore
Bogachattar Plantation 0.50±0.04 0.48±0.22 0.53±0.18 0.45±0.22 0.36±0.21 0.36±0.17 0.51±0.23 0.33±0.07 0.44±0.16 Barren 0.47±0.12 0.38±0.15 0.31±0.14 0.21±0.18 0.27±0.12 0.37±0.23 0.55±0.24 0.53±0.06 0.26±0.04 Plantation 0.24±0.21 0.36±0.23 0.22±0.12 0.29±0.17 0.40±0.18 0.43±0.12 0.23±0.16 0.32±0.12 0.34±0.17 Bakkhali Barren 0.29±0.18 0.30±0.18 0.22±0.17 0.28±0.10 0.42±0.21 0.41±0.21 0.29±0.15 0.27±0.14 0.28±0.24 Plantation 0.27±0.22 0.53±0.13 0.29±0.11 0.22±0.12 0.42±0.23 0.42±0.24 0.16±0.22 0.38±0.09 0.45±0.27 Baterkhil Barren 0.34±0.19 0.44±0.12 0.31±0.06 0.27±0.22 0.30±0.17 0.30±0.09 0.10±0.12 0.16±0.04 0.21±0.22 Plantation 0.51±0.09 0.39±0.21 0.39±0.12 0.25±0.17 0.49±0.26 0.26±0.11 0.34±0.07 0.49±0.23 0.53±0.31 Basbaria Barren 0.45±0.06 0.32±0.26 0.46±0.26 0.23±0.07 0.30±0.22 0.26±0.13 0.15±0.03 0.17±0.04 0.24±0.15 Note: Each value is the mean of soil sample under different landuses at different locations. The same lowercase letter within each soil depth indicates no significant difference (p<0.05).
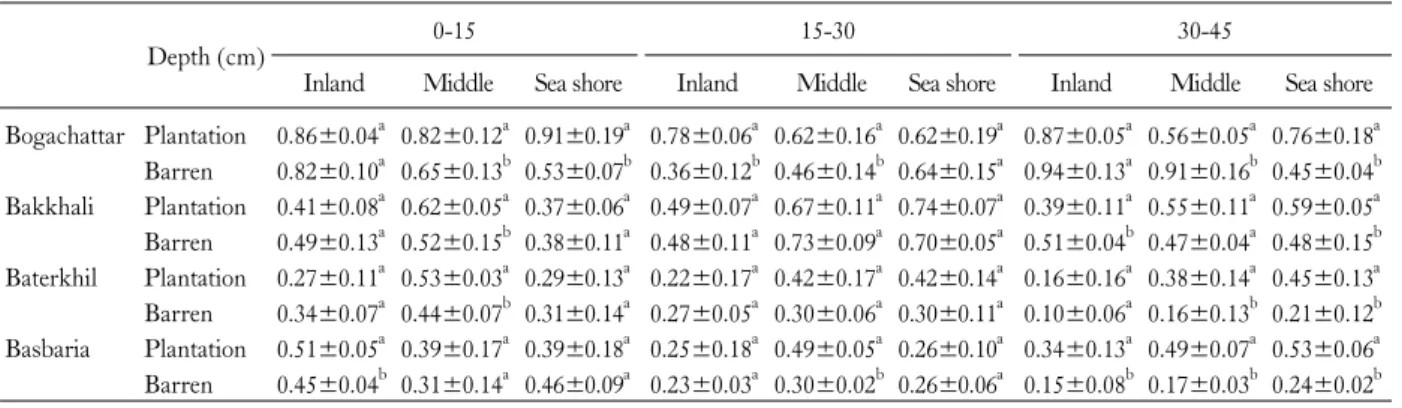
Table 4. Soil organic matter (%) at different depth of three different land positions in Sitakunda range
Depth (cm) 0-15 15-30 30-45
Inland Middle Sea shore Inland Middle Sea shore Inland Middle Sea shore Bogachattar Plantation 0.86±0.04a 0.82±0.12a 0.91±0.19a 0.78±0.06a 0.62±0.16a 0.62±0.19a 0.87±0.05a 0.56±0.05a 0.76±0.18a Barren 0.82±0.10a 0.65±0.13b 0.53±0.07b 0.36±0.12b 0.46±0.14b 0.64±0.15a 0.94±0.13a 0.91±0.16b 0.45±0.04b Bakkhali Plantation 0.41±0.08a 0.62±0.05a 0.37±0.06a 0.49±0.07a 0.67±0.11a 0.74±0.07a 0.39±0.11a 0.55±0.11a 0.59±0.05a Barren 0.49±0.13a 0.52±0.15b 0.38±0.11a 0.48±0.11a 0.73±0.09a 0.70±0.05a 0.51±0.04b 0.47±0.04a 0.48±0.15b Baterkhil Plantation 0.27±0.11a 0.53±0.03a 0.29±0.13a 0.22±0.17a 0.42±0.17a 0.42±0.14a 0.16±0.16a 0.38±0.14a 0.45±0.13a Barren 0.34±0.07a 0.44±0.07b 0.31±0.14a 0.27±0.05a 0.30±0.06a 0.30±0.11a 0.10±0.06a 0.16±0.13b 0.21±0.12b Basbaria Plantation 0.51±0.05a 0.39±0.17a 0.39±0.18a 0.25±0.18a 0.49±0.05a 0.26±0.10a 0.34±0.13a 0.49±0.07a 0.53±0.06a Barren 0.45±0.04b 0.31±0.14a 0.46±0.09a 0.23±0.03a 0.30±0.02b 0.26±0.06a 0.15±0.08b 0.17±0.03b 0.24±0.02b
Note: Each value is the mean of soil sample under different landuses at different locations. The same lowercase letter within each soil depth indicates no significant difference (p<0.05).
barren land (3.46 ds/m) inland and middle showed no sig-nificant difference. In Bogachattar beat, at 0-15 cm soil depth seaside plantation showed significantly higher soil salinity (3.88 ds/m) in comparison to adjacent plantation site (2.28 ds/m). Inland and middle shows no significant difference. At 15-30 cm depth barren inland and sea side showed significantly higher soil salinity (3.43 ds/m and 3.41 ds/m) in comparison to adjacent plantation site (2.71 ds/m and 3.41 ds/m). Middle showed no significant difference.
Soil organic matter ad soil organic carbon
In general, the coastal plantations showed higher soil or-ganic matter comapred to the adjacent barren coastal land. Significant difference in soil organic matter was found with
a few exception at all the three depths at all the three land positions. In Bogachattar beat, the highest Soil organic matter (0.94%) was attained by 30-45 cm depth at inland barren and lowest (0.0.36%) was attained by inland barren land at 15-30 cm depth (Table 4). In Bakkhali beat, at 0-15 cm depth inland barren shows significantly higher organic matter (0.49%) in comparison to plantation sites (0.41%) and middle plantation shows significantly higher organic matter (0.62%) in comparison to barren land (0.52%) but sea side showed no significant difference. In Baterkhil beat, at 0-15 cm depth soil organic matter was significantly high-er (0.59%) in barren land in comparison to plantation sites (0.47%) and middle plantation shows significantly higher organic matter (0.90%) in comparison to barren land (0.74%) but sea side showed no significant difference.
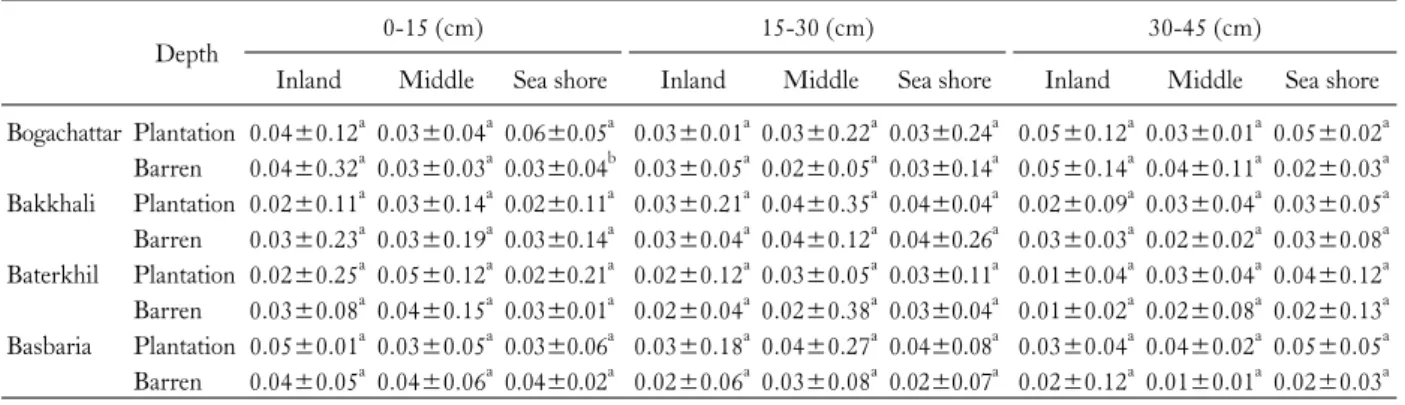
Table 6. Nitrogen (%) at different depth of three different land positions in Sitakunda range
Depth 0-15 (cm) 15-30 (cm) 30-45 (cm)
Inland Middle Sea shore Inland Middle Sea shore Inland Middle Sea shore
Bogachattar Plantation 0.04±0.12a 0.03±0.04a 0.06±0.05a 0.03±0.01a 0.03±0.22a 0.03±0.24a 0.05±0.12a 0.03±0.01a 0.05±0.02a Barren 0.04±0.32a 0.03±0.03a 0.03±0.04b 0.03±0.05a 0.02±0.05a 0.03±0.14a 0.05±0.14a 0.04±0.11a 0.02±0.03a Bakkhali Plantation 0.02±0.11a 0.03±0.14a 0.02±0.11a 0.03±0.21a 0.04±0.35a 0.04±0.04a 0.02±0.09a 0.03±0.04a 0.03±0.05a Barren 0.03±0.23a 0.03±0.19a 0.03±0.14a 0.03±0.04a 0.04±0.12a 0.04±0.26a 0.03±0.03a 0.02±0.02a 0.03±0.08a Baterkhil Plantation 0.02±0.25a 0.05±0.12a 0.02±0.21a 0.02±0.12a 0.03±0.05a 0.03±0.11a 0.01±0.04a 0.03±0.04a 0.04±0.12a Barren 0.03±0.08a 0.04±0.15a 0.03±0.01a 0.02±0.04a 0.02±0.38a 0.03±0.04a 0.01±0.02a 0.02±0.08a 0.02±0.13a Basbaria Plantation 0.05±0.01a 0.03±0.05a 0.03±0.06a 0.03±0.18a 0.04±0.27a 0.04±0.08a 0.03±0.04a 0.04±0.02a 0.05±0.05a Barren 0.04±0.05a 0.04±0.06a 0.04±0.02a 0.02±0.06a 0.03±0.08a 0.02±0.07a 0.02±0.12a 0.01±0.01a 0.02±0.03a
Note: Each value is the mean of soil sample under different landuses at different locations. The same lowercase letter within each soil depth indicates no significant difference (p<0.05).
In four forest beat, plantation soil showed higher content of organic carbon. At 0-15 cm soil depth, sea shore sig-nificantly higher amount of soil organic carbon compared to adjacent barren lands. Similarly, at both the 15-30 cm and 30-45 cm soil depth sea shore showed a significant amount of organic carbon sequestration (Table 5).
Nitrogen
In Bogachattar beat Nitrogen percentage was highest (0.059%) in plantation on seaside at 0-15 cm depth and lowest (0.023%) at 30-45 cm soil depth in barren land. There was no significant difference found between planta-tion and barren land in all the three land posiplanta-tions (Table 6). In Bakkhali beat, Nitrogen percentage content at 0-15 cm depth in different land positions between plantations and adjacent barren land showed significant difference. On the other hand, at 15-30 cm and 30-45 cm soil depth Nitrogen percentage show no significant difference. In Baterkhil beat, there was significant difference in soil nitrogen per-centage between plantation and barren land at all soil depth on all the three land positions except 0-15 cm depth at sea side. In Basbaria beat, there was significant difference in soil nitrogen percentage between plantation and barren land at all soil depth on all the three land positions except 0-15 cm depth at sea side. Higher nitrogen percentage (0.0477%) was found at 30-45 cm depth sea side plantation and lowest (0.0157%) was at 15-30 cm depth in inland barren.
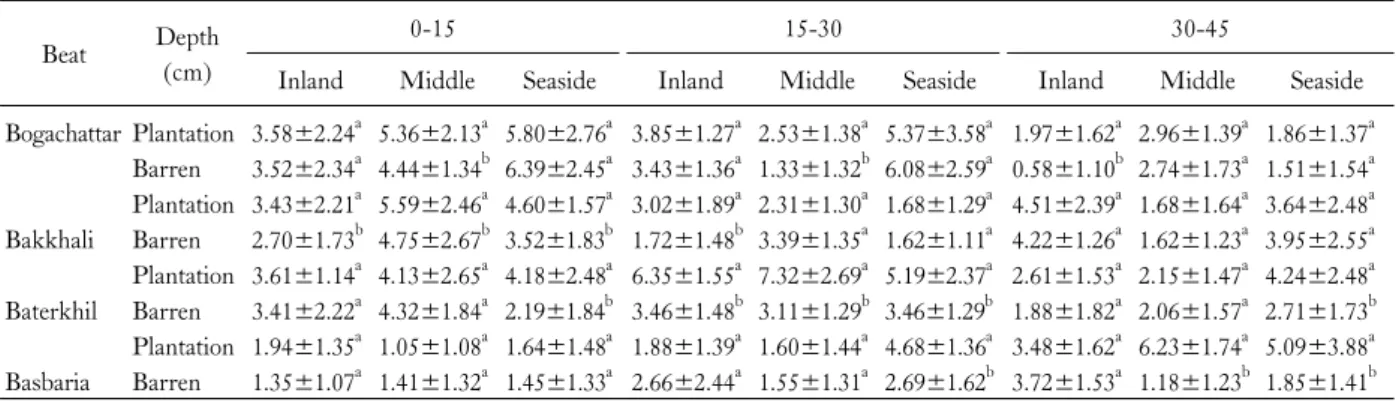
Phosphorus
Phosphorus (P) content of soil in both the plantations at all the three depths of all the land positions was significantly higher compared to the adjacent barren lands. In Bogachattar beat available P was higher (6.394 ppm) in barren land on seaside at 0-15 cm depth and lowest (0.579 ppm) at 30-45 cm soil depth in inland barren. Phosphorus is significantly higher compared to barren land except in sea side at 0-15 cm and 15-30 cm (Table 7). In Bakkhali beat, P content at 0-15 cm depth in different land positions be-tween plantations and adjacent barren land showed sig-nificant difference. On the other hand at 15-30 cm and 30-45 cm soil depth Phosphorus show no significant difference. In Baterkhil beat, there was no significant dif-ference in available P between plantation and barren land at 0-15 cm soil depth except sea side and again at 15-30 cm and 30-45 cm soil depth there was significance difference except 30-45 cm depth middle plantation. In Basbaria beat, there was significant difference in phosphorus between plantation and barren land at all soil depth on all the three land positions except 15-30 cm depth at sea side and 30-45 cm depth inland. Highest amount of phosphorus (6.229 ppm) was found at 30-45 cm depth middle plantation and lowest (1.049 ppm) was at 0-15 cm depth in middle plantation.
Potassium (K)
Table 7. Phosphorus (ppm) at different depth of three different land positions in Sitakunda range
Beat Depth
(cm)
0-15 15-30 30-45
Inland Middle Seaside Inland Middle Seaside Inland Middle Seaside
Bogachattar Plantation 3.58±2.24a 5.36±2.13a 5.80±2.76a 3.85±1.27a 2.53±1.38a 5.37±3.58a 1.97±1.62a 2.96±1.39a 1.86±1.37a Barren 3.52±2.34a 4.44±1.34b 6.39±2.45a 3.43±1.36a 1.33±1.32b 6.08±2.59a 0.58±1.10b 2.74±1.73a 1.51±1.54a Plantation 3.43±2.21a 5.59±2.46a 4.60±1.57a 3.02±1.89a 2.31±1.30a 1.68±1.29a 4.51±2.39a 1.68±1.64a 3.64±2.48a Bakkhali Barren 2.70±1.73b 4.75±2.67b 3.52±1.83b 1.72±1.48b 3.39±1.35a 1.62±1.11a 4.22±1.26a 1.62±1.23a 3.95±2.55a Plantation 3.61±1.14a 4.13±2.65a 4.18±2.48a 6.35±1.55a 7.32±2.69a 5.19±2.37a 2.61±1.53a 2.15±1.47a 4.24±2.48a Baterkhil Barren 3.41±2.22a 4.32±1.84a 2.19±1.84b 3.46±1.48b 3.11±1.29b 3.46±1.29b 1.88±1.82a 2.06±1.57a 2.71±1.73b Plantation 1.94±1.35a 1.05±1.08a 1.64±1.48a 1.88±1.39a 1.60±1.44a 4.68±1.36a 3.48±1.62a 6.23±1.74a 5.09±3.88a Basbaria Barren 1.35±1.07a 1.41±1.32a 1.45±1.33a 2.66±2.44a 1.55±1.31a 2.69±1.62b 3.72±1.53a 1.18±1.23b 1.85±1.41b Note: Each value is the mean of soil sample under different landuses at different locations. The same lowercase letter within each soil depth indicates no significant difference (p<0.05).
Table 8. Potassium (meq/100 g) at different depth of three different land positions in Sitakunda range
Depth 0-15 15-30 30-45
Inland Middle Seaside Inland Middle Seaside Inland Middle Seaside
Bogachattar Plantation 0.47±0.32a 0.47±0.55a 1.08±0.67a 0.59±0.45a 0.51±0.21a 0.62±0.37a 0.89±0.34a 0.43±0.27a 1.02±0.93a Barren 0.46±0.34a 0.46±0.46a 0.51±0.24b 0.40±0.36a 0.50±0.34a 0.45±0.54a 0.96±0.53a 1.00±1.21b 0.95±0.78a Plantation 0.41±0.54a 0.39±0.37a 0.41±0.75a 0.43±0.41a 0.51±0.37a 0.45±0.32a 0.41±0.26a 0.50±0.26a 0.53±0.34a Bakkhali Barren 0.48±0.65a 0.56±0.65b 0.59±0.44a 0.38±0.27a 0.46±0.32a 0.44±0.26a 0.41±033a 0.44±0.37a 0.52±0.32a Plantation 0.51±0.31a 0.56±0.35a 0.44±0.83a 0.41±0.36a 0.54±0.42a 0.63±0.26a 0.38±0.37a 0.46±0.44a 0.58±0.47a Baterkhil Barren 0.47±0.44a 0.60±0.31a 0.44±0.25a 0.41±0.54a 0.45±0.48a 0.54±0.35a 0.34±0.27a 0.39±0.35a 0.46±0.37b Plantation 0.21±0.23a 0.17±0.33a 0.19±0.31a 0.15±0.15a 0.18±0.15a 0.12±0.22a 0.30±0.31a 0.50±0.43a 0.48±0.46a Basbaria Barren 0.40±0.37b 0.50±0.12b 0.50±0.22b 0.25±0.21b 0.31±0.33b 0.31±0.41b 0.35±0.27a 0.40±0.38b 0.42±0.51a
Note: Each value is the mean of soil sample under different landuses at different locations. The same lowercase letter within each soil depth indicates no significant difference (p<0.05).
positions of both the plantations increased very significantly compared to the adjacent barren lands. In Bogachattar beat K was higher (1.08 meq/100 g) in plantation on seaside at 0-15 cm depth and lowest (0.40 meq/100 g) at 15-30 cm soil depth in inland barren. The available K content de-creased from surface to soil depth in both the plantations and barren land and the sea side showed the highest avail-able K compared to inland and middle (Tavail-able 8). In Bakkhali beat, K content in different land positions between plantations and adjacent barren land showed significant dif-ference except 0-15 cm depth. Highest K content (0.59 meq/100 g) was found at 0-15 cm depth in seaside barren land and lowest (0.38 meq/100 g) was found at 30-45 cm depth in inland barren. In Baterkhil beat, there was no sig-nificant difference in available K content between plantation
and barren land except 0-15cm depth. Highest amount of K (0.63 meq/100 g) was found at 15-30 cm depth seashore plantation and lowest (0.34 meq/100 g) was found at 30-45 cm depth in inland barren. In Basbaria beat, there was sig-nificant difference in available K content between plantation and barren land at all soil depth on all the three land positions. The result shows no trend in Basbaria beat. This may be due to rooting system and litter accumulation on the ground.
Discussion
The finding of soil texture property in our study is com-parable with some other studies. Shaifullah et al. (2009) worked in the coastal area (12- and 17-year-old Sonneratia
apetala) of four char land at Hatia and did not found differ-ence in most of soil depths between plantation and adjacent barren land, proportion of sand particle was significantly lower and silt particle significantly in the plantations higher than that in their adjacent barren lands. Kabir (2005) found sand, silt and clay contents 51.23%, 42.19% and 6.58% in inland, 64.51%, 29.79% and 5.7% in middle part and 69.85%, 27.46% and 5.39% in sea side respectively, under Keora (Sonneratia apetala) plantation compared to the ad-jacent barren land in Chittagong. Sukardjo (1978) found higher silt proportion and lower proportion of sand in man-grove forest of Java, Indonesia.
Siddiqi (1992) stated that soil pH in Sunderban varies from 7.7-8.2 at less saline zone, 6.7-8.1 at moderately saline zone and 7.7-8.2 at strong saline zone. Shaifullah et al. (2009) worked in the coastal plantations (12- and 17-year-old
Sonneratia apetala) at Char Rehania, Char Alim, Char Piya and Char Nurul Islam in Hatia and found higher pH in plantationsin comparison to adjacent barren lands which is similar to our findings. Hossain (2002) also found higher soil pH in coastal plantations at Teknaf and at Maheshkhali. He found pH values increased with depth of soil at both sites. Gill and Abrol (1990) recorded higher pH in coastal sandy soil compared to the adjacent agricultural land in Andhra Pradesh; India. They also found that pH increased from surface to subsurface. Tam and Wong (1998) also found higher soil pH under coastal soil studying in a sub-tropical mangrove ecosystem in Hong Kong.
Similar results were found in other studies conducted in the coastal plantation (12- and 17-year-old Sonneratia ape-tala) of various char lands (Hossain 2002; Kabir 2005; Shaifullah et al. 2009). In another study, Khan et al. (1998) also found higher organic matter in the mixed plantations of Keora (Sonneratia apetala) and Gewa (Excoecaria agallo-cha) which gradually declined from inland to seaside as well as with depths. This finding has a strong agreement with Akhtaruzzaman et al. (2020).
In general, the coastal plantations show higher soil or-ganic carbon in comparison to the adjacent barren coastal lands. We found a significant difference in soil organic car-bon at all the three depths at all the three land positions. Lacerda et al. (1995) stated that accumulation of mangrove stem, leaf litter increase organic carbon in the surface and death of roots adds organic carbon to the soil at varying
depths. Shaifullah et al. (2009) working in the coastal plan-tation (12- and 17-year-old Sonneratia apetala)of various char and found higher organic matter in plantation than ad-jacent barren land. Again Shaifullah et al. (2008) found higher organic carbon under keora (Sonneratia apetala) plantation compared to the adjacent barren land in Lakshimipur. They also found higher organic carbon at the surface soil which gradually declined with depth.
Results depict that plantation soils have higher nitrogen percentage than barren land. This may be due to rooting system and litter accumulation on the ground. Hossain (2002) found that higher N content in the inland which gradually declined towards sea side in mangrove forest of Teknaf compared with Maheshkhali in Bangladesh. Shaifullah et al. (2009) found also found the same trend of N contents in coastal plantation and barren land at Hatia in Bangladesh.
We found that plantation soils have higher phosphorus than barren land. This may be due to rooting system and litter accumulation on the ground. Shaifullah et al. (2009) also found higher available in plantation in Hatia compared ti adjacent barren lands. Siddiqi (2001) reported that phos-phorus along the shoreline of Bangladesh varies 15-20 ppm at less saline zone, 15-20 ppm at moderately saline zone and 10-15 ppm at strongly saline zone.
Our results shows higher amount K content is plantation sites. This result supported by other similar studies. Kabir (2005) found higher K content in Keora plantation com-pared to the adjacent barren land in Chittagong. However, Vedivelu et al. (1993) also found that K content gradually declined with depth. Shaifullah et al. (2009) found higher K in plantation compared than adjacent barren land in four char lands of Hatia. Siddiqi (2001) claimed that Potassium along the shoreline of Bangladesh varies 200-300 ppm at less saline zone, 200-250 ppm at moderately saline zone and 150-250 ppm at strongly saline zone.
Conclusion
Positive changes in soil physicochemical properties were observed in Sitakunda Coastal Afforestation Range due to coastal plantation. Organic matter and carbon accumu-lation, total N, available P and K was significantly higher in plantation in comparison to barren land with some exception.
Soil pH and salinity was decreased by coastal plantation compared to barren land. These findings justify the goals of coastal afforestation for stabilizing the newly accreted land and to reduce destructions from natural calamities such as cyclone, tidal surges and tornado occurring frequently in Bangladesh. We encourage to do further study on carbon sequestration, nutrients uptake by the planted trees to pro-vide strong epro-vidence of soil productivity and soil quality in this study area.
References
Akhtaruzzaman M, Roy S, Mahmud MS, Shormin T. 2020. Soil Properties Under Different Vegetation Types in Chittagong University Campus, Bangladesh. J For Environ Sci 36: 133-142.
Ball DF. 1964. Loss‐on‐Ignition as an Estimate of Organic Matter and Organic Carbon in Non‐Calcareous Soils. J Soil Sci 15: 84-92.
Bandyopadhyay AK. 1997. Coastal Soils and Their Management. International Book Distributors, Dehradun, 170 pp.
Banglapedia. 2019. Sitakunda Upazila. http://en.banglapedia.org/ index.php?title=File:SitakunduUpazila.jpg. Accessed 11 Aug 2019.
BFD. 2012. Bangladesh Forest Department, Chittagong Coastal Forest Division (North), Nandan Kanaon, Chittagong. Brammer H. 2014. Bangladesh’s dynamic coastal regions and
sea-level rise. Clim Risk Manag 1: 51-62.
Cardona P, Botero L. 1998. Soil Characteristics and Vegetation Structure in a Heavily Deteriorated Mangrove Forest in the Caribbean Coast of Colombia. Biotropica 30: 24-34.
Gill HS, Abrol IP. 1990. Evaluation of coastal sandy soils and their saline ground waters for afforestation: a case study from India. New For 4: 37-53.
Haque SMS, Hossain MK, Kabir MA. 2000. Performance of some common mangrove species in Sitakunda and Mirersarai Forest Ranges under Chittagong Coastal Afforestation Division. Chittagong Univ J Sci 24: 1-10.
Hasan MM. 2000. Soils and problem soils of Bangladesh. Obs Mag 5: 23-24.
Hossain MM. 2002. Soil nutrients and plant growth in sea side and estuarine mangrove plantations at Cox’s Bazar. Inst For Environ Sci Univ Chittagong 30: 125.
Huq SI, Alam MD. 2005. A Handbook on Analyses of Soil, Plant
and Water. University of Dhaka, Dhaka, 246 pp.
Kabir FMA. 2005. Coastal afforestation effects on soils at Kattali, Chittagong. University of Chittagong, Chittagong, pp 70-72. Khan ZH, Husain MS, Muzumdar AR. 1998. Properties of soils
from the offshore islands of Bangladesh. Bangladesh J For Sci 27: 114-120.
Kusmana C. 1990. Soil as a Factor Influencing the Mangrove Forest Communities in Talidendang Besar, Riau. Biotropia 4: 9-18.
Lacerda LD, Ittekkot V, Patchineelam SR. 1995. Biogeochemistry of Mangrove Soil Organic Matter: a Comparison Between Rhizophora and Avicennia Soils in South-eastern Brazil. Estuar Coast Shelf Sci 40: 713-720.
Pal D, Das AK, Gupta SK, Sahoo AK. 1996. Vegetation pattern and soil characteristics of some mangrove forest zones of the Sunderbans, West Bengal. Indian Agric 40: 71-78.
Petersen L. 2002. Analytical Methods: Soil, Water, Plant Material, Fertilizer. Soil Resource Development Institute, Dhaka, pp 17-19.
Sarwar GM. 2005. Impacts of sea level rise on the coastal zone of Bangladesh. MS thesis. Lund University, Lund, Sweden. (in English)
Shaifullah KM, Mezbahuddin M, Sujauddin M, Haque SMS. 2008. Effects of coastal afforestation on some soil properties in Lakshmipur coast of Bangladesh. J For Res 19: 32-36. Shaifullah KM, Sirajul Haque SM, Sujauddin M, Karmakar S.
2009. Coastal afforestation effects on soil properties at Hatiya in Bangladesh. J For Res 20, 243-248.
Siddiqi NA, Khan MAS, Islam MR, Hoque AKF. 1992. Underplanting- a means to ensure sustainable mangrove planta-tions in Bangladesh. Bangladesh J For Sci 21: 1-6.
Siddiqi NA. 2001. Mangrove Forestry in Bangladesh. Institute of Forestry and Environmental Sciences, University of Chittagong, Chittagong, 201 pp.
Sukardjo S. 1978. Characteristics of mangrove soils of Java. Rimba Indonesia 16: 141-150.
Tam NFY, Wong YS. 1998. Variations of Soil Nutrient and Organic Matter Content in a Subtropical Mangrove Ecosystem. Water Air Soil Pollut 103: 245-261.
Vadivelu S, Muralidharan A, Bandyopadhyay AK. 1993. Soils of Lakshadweep islands. CARI Bull 9: 83.
Zafar MA. 2003. Problems and prospects of Kutubdia coastal plan-tations under Chittagong Coastal Forest Division. Project paper. Institute of Forestry and Environmental Sciences, University of Chittagong, Chittagong. 21-23 pp.