Speech Segregation based on Pitch Track
Correction and Music-Speech Classification
Han-Gyu KIM1, Gil-Jin JANG2, Jeong-Sik PARK3, Ji-Hwan KIM4, and Yung-Hwan OH1
1
Korea Advanced Institute of Science and Technology (KAIST), Daejeon, 305-701, South Korea 2
Ulsan National Institute of Science and Technology (UNIST), Ulsan, 689-798, South Korea 3
Mokwon University, Daejeon, 302-729, South Korea 4
Sogang University, Seoul, 121-742, South Korea [email protected]
1
Abstract—A novel approach for pitch track correction and music-speech classification is proposed in order to improve the performance of the speech segregation system. The proposed pitch track correction method adjusts unreliable pitch estimates from adjacent reliable pitch streaks, in contrast to the previous approach using a single pitch streak which is the longest among the reliable pitch streaks in a sentence. The proposed music and speech classification method finds continuous pitch streaks of the mixture, and labels each streak as music-dominant or speech-dominant based on the observation that music pitch seldom changes in a short-time period whereas speech pitch fluctuates a lot. The speech segregation results for mixtures of speech and various competing sound sources demonstrated that the proposed methods are superior to the conventional method, especially for mixtures of speech and music signals.
Index Terms—Source separation, Speech processing, Speech analysis, Signal denoising, Noise cancellation.
I. INTRODUCTION
In natural environments, various sound sources are mixed together when collected by a digital microphone. Human listeners are able to focus on a single target source so that they can understand what other people are saying even in very noisy atmospheres. This phenomenon is called the cocktail party effect [1]. The human ability to selectively pay attention to a specific acoustic stream is enabled by excluding background noise with the help of auditory cues in the spectro-temporal domain. The purpose of source segregation is to implement the above-mentioned human auditory process as accurately as possible in a computed environment.
When a mixture of N source signals is given, the input mixture is expressed by:
) ( ) ( ) ( ) (t 1x1 t 2x2 t x t y
N N , (1)where xi(t) is the ith source signal, and i is its gain which is affected by various factors such as energy, location, and direction. The problem of source segregation is to find the best estimates of using only. The source segregation system is applicable to a variety of tasks including automatic music transcription, speech recognition, and audio-text alignment
) (t i
x y(t)
[2]-[4].
1This work was supported by Basic Science Research Program through the National Research Foundation of Korea (NRF) funded by the Ministry of Education, Science and Technology (No. 2010-0025642), and by the 2010 Research Fund of the UNIST (Ulsan National Institute of Science and Technology). Corresponding author is Gil-Jin Jang.
Many researchers have made tremendous efforts to the monaural source segregation where the sources are recorded by a single microphone. The comb filtering technique extracts the target sound from the mixture via a comb-shaped filterbank whose harmonic structure is built from the estimated pitch value [5]. There are a number of methods based on masking in the spectro-temporal region, such as using the factorial HMM [6] and independent component analysis [7]. Nonnegative matrix factorization (NMF) [9] based source segregation method split the spectrogram of the mixture signal into several components via an iterative matrix computation where the redundancy of the source is exploited [2].
One of the most popular sources in source segregation is speech. In order to extract clean speech from various noisy environments, amplitude modulation by pitch frequencies is proposed [8]. Decent segregation performance was obtained with ordinary noise sources, but speech mixed with music was not extracted well. NMF based speech segregation from polyphonic music extracts vocals from music-vocal mixture well but the algorithm cannot separate speech from other kinds of noise [10].
II. SPEECH SEGREGATION ALGORITHM
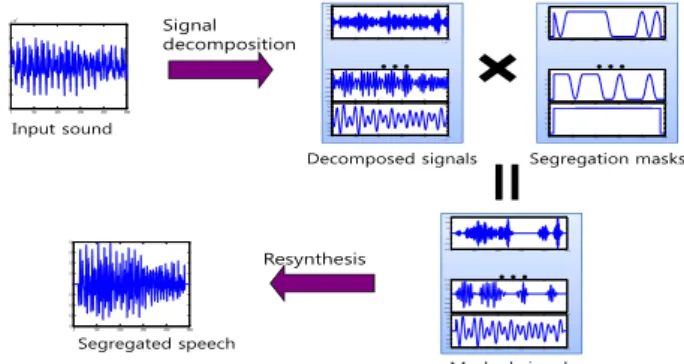
The proposed speech segregation technique is based on the classification of segments in time and frequency domain as speech or non-speech, and filtering out the non-speech segments. The input signal is decomposed into a number of subband signals, and the segregation is implemented by selectively masking these signals [8]. In the following subsections, the subband masking algorithm is introduced, and the full procedures for the proposed pitch track correction using adjacent reliable pitch streaks and music and speech classification are explained.
Signal decomposition 0 500 1000 1500 2000 2500 -3 -2 -1 0 1 2 3x 10⁴ 0 500 1000 1500 2000 2500 -0.4 -0.3 -0.2 -0.1 0 0.1 0.2 0.3 0.4 Resynthesis Decomposed signals 1 1. 05 1. 1 1. 15 1.2 x 1041. 25 -400 -300 -200 -100 0 100 200 300 4001 1. 05 1. 1 1. 15 1.2 x 1041. 25 -8000 -6000 -4000 -2000 0 2000 4000 6000 1 1. 05 1. 1 1. 15 1.2 x 1041. 25 -2000 -1500 -1000 -500 0 500 1000 1500 2000
…
Segregation masks 0 500 1000 1500 2000 2500 0 0.2 0.4 0.6 0.8 1 0 500 1000 1500 2000 2500 0 0.2 0.4 0.6 0.8 1 0 500 1000 1500 2000 2500 0 0.2 0.4 0.6 0.8 1…
Masked signals 0 500 1000 1500 2000 2500 -1500 -1000 -500 0 500 1000 1500 0 500 1000 1500 2000 2500 -8000 -6000 -4000 -2000 0 2000 4000 6000 0 500 1000 1500 2000 2500 -400 -300 -200 -100 0 100 200 300 400…
Input sound Segregated speechFigure 1. Speech segregation based on subband masking.
A. Basics of Subband Masking
The main idea of subband masking is to decompose the mixed signal into a number of subband signals and construct a new source by selectively reweighting the subbands
) (t
y bi(t)
[6]. For a single source extraction, it is described as follows: ) ( ) ( ) ( ) ( ) ( ) ( ) (t 1 t b1 t 2 t b2 t t b t s n n , (2)
where
i(t) is the separation mask for the subband signal , and is the separated signal of the target source. The whole process of the masking is shown in Fig. 1. This method is considered to be an inversion of the mixing in Equation 1, and the performance is dependent on how precisely the subband decomposition splits the input mixture. In an ideal case, the mask) (t bi s(t) ) (t i should be mutually exclusive.
Recently, Hu and Wang proposed a speech segregation system based on subband masking where the segregation mask was modulated by the estimated pitch values, and the segregation system demonstrated good performance for various simple noise sources [8]. The gammatone filterbank is used for the subband decomposition in Equation 2 as it is recognized as a good match to the function of the human cochlea [11]. The pitch period of a short-time segment is estimated from the autocorrelation functions of the subband signals, . When a part of the original signal has sufficient energy at F0 and harmonics corresponding to the estimated pitch, this part of the signal is selected. The selected signals are resynthesized into the segregated speech using Weintraub’s method
) (t
bi
[12].
The estimated pitch may come from either the background noise or the target speech. In the system proposed by Hu and Wang, the reliability of estimated pitch was measured and the reliable pitch streaks which are composed of continuous reliable pitch periods were selected. The estimated pitch was classified as unreliable if it did not belong to the longest reliable streak, and it was corrected using the longest reliable streak. In this way, the pitch of the background noise can be removed efficiently.
B. Pitch Track Correction Using Adjacent Reliable Streaks
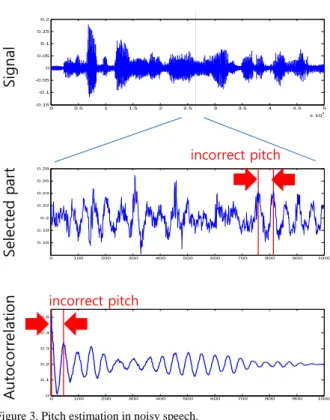
When there is no noise in the speech signal, pitch value is easily estimated as shown in Fig. 2. However, in noisy environment, pitch is not easy to be estimated because the autocorrelation function is distorted by the noise signal, which is shown in Fig. 3. Therefore, pitch correction error is not avoidable.
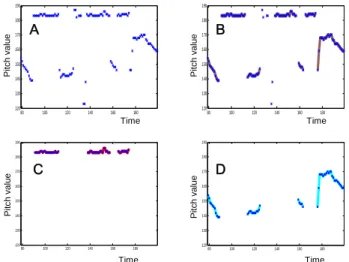
Hu and Wang’s pitch track correction algorithm assumes that only the longest reliable pitch streak is correct. All other pitch periods are recomputed from each end of the longest reliable pitch streak until the end or the beginning of the input sentence. As a result, the correction error of the pitch may propagate from the longest streak. For example, in Fig. 4-B, a correction error occurs near the longest reliable streak and then all pitch periods corrected after this point have incorrect values. In order to solve the problem, a pitch track correction technique using adjacent reliable pitch streaks is proposed. In this method, all reliable pitch streaks are used for the correction.
0 0.5 1 1.5 2 2.5 3 3.5 4 4.5 5 x 10⁴ -0.15 -0.1 -0.05 0 0.05 0.1 0.15 0.2 0 100 200 300 400 500 600 700 800 900 1000 0.1 0.15 0.2 0.25 0.3 0.35 0.4 0 100 200 300 400 500 600 700 800 900 1000 0.16 0.17 0.18 0.19 0.2 0.21 0.22 0.23 0.24 0.25 0.26 Si gn al Se le ct ed par t Aut oc or rela tion correct pitch correct pitch
Figure 2. Pitch estimation in clean speech.
0 0.5 1 1.5 2 2.5 3 3.5 4 4.5 5 x 10⁴ -0.15 -0.1 -0.05 0 0.05 0.1 0.15 0.2 0 100 200 300 400 500 600 700 800 900 1000 0 0.1 0.2 0.3 0.4 0.5 0 100 200 300 400 500 600 700 800 900 1000 0.16 0.18 0.2 0.22 0.24 0.26 0.28 Si gnal Se le ct ed par t Au to corr el ation incorrect pitch incorrect pitch
Figure 3. Pitch estimation in noisy speech.
The proposed pitch track correction algorithm operates as follows:
1) Estimate pitch periods from the mixture signal, and find the continuous streaks.
2) Label each streak as music-dominant or speech-dominant using the music and speech classification algorithm proposed in Section II-B.
120 125 130 135 140 145 150 155 160 165 170 120 125 130 135 140 145 150 155 160 Reliable 160 streaks 120 125 130 135 140 145 150 155 160 165 170 120 125 130 135 140 145 150 155 Hu & Wang’s: Correction using longest reliable streak
120 125 130 135 140 145 150 155 160 165 170 120 125 130 135 140 145 150 155 160 120 125 130 135 140 145 150 155 160 165 170 120 125 130 135 140 145 150 155 160 Proposed: Time Pi tc h v al ue Time Time Time A B C D Pi tc h v al ue Pi tc h v a lu e Pi tc h v a lu e Correction using closest reliable streaks
Although Hu and Wang’s speech segregation system works well on simple noises, it is less effective in speech and music mixtures. In the estimated pitch of music and speech mixtures, both music pitch and speech pitch exist. However, it is difficult to discriminate between them because music and speech have similar characteristics. The music pitch may compose reliable pitch streaks and possibly some of them are even longer than any other streak of the speech pitch. In this case, Hu and Wang’s method is more likely to track the sequence of the music pitch rather than that of the speech.
Figure 4. An example of pitch track correction: (A) estimated pitch periods and reliable pitch streaks; (B) pitch track correction using the longest reliable pitch streak; (C) correction using adjacent reliable pitch streaks; (D) hand-labeled pitch periods.
3) Find the reliable pitch streaks from
speech-dominant region. The remaining pitch streaks in the speech-dominant region are labeled as “unreliable”. 4) Correct the pitch values in the unreliable pitch
streaks:
a) If the unreliable pitch streak has two adjacent reliable pitch streaks on both sides, the unreliable pitch values are corrected using the longer adjacent reliable pitch streak.
b) If the unreliable streak has only one adjacent reliable pitch streak, the unreliable pitch values are corrected using the reliable streak.
c) If the unreliable streak has no adjacent reliable pitch streak, all the pitch periods in the streak are set to 0.
We used the pitch track correction algorithm proposed in Hu and Wang’s method [8]. In the process described above, the longer reliable pitch streak is used for correction because generally the longer one is more reliable. The unreliable pitch in music-dominant region is not corrected as the speech pitch in that region is usually difficult to estimate and estimation errors may finally affect the whole segregation result.
C. Music and Speech Classification
Initial pitch estimation
Find continuous pitch streaks
Streak variance > Threshold
Yes No
Speech pitch Music pitch
Pitch track correction
Figure 5.Block diagram of music and speech classification.
80 100 120 140 160 180 120 130 140 150 160 170 180 190 80 100 120 140 160 180 120 130 140 150 160 170 180 190 80 100 120 140 160 180 120 130 140 150 160 170 180 190 80 100 120 140 160 180 120 130 140 150 160 170 180 190 Time Pit c h val u e Time Time Time Pi tc h va lue Pit c h val u e Pit c h val u e A B C D
Figure 6.Example of music and speech classification: (A) estimated pitch; (B) continuous pitch streaks; (C) obtained music-dominant regions via music and speech classification; (D) remaining speech-dominant regions.
The proposed music and speech classification method identifies music pitch streaks and excludes music-dominant regions. Since music is generally composed of a series of notes, the pitch of music generally changes less frequently than that of speech [13]. Hence, a variance of continuous pitch streaks is used to measure the rate of change in the pitch periods.
Fig. 5 shows the block diagram of music and speech classification algorithm. The detailed process of identifying music pitch is as follows:
1) Estimate pitch periods from the mixture using the autocorrelation function (Fig. 6-A)
2) Find continuous pitch streaks from the sequence of the pitch periods (Fig. 6-B).
3) Compute the variance of the pitch periods in each streak. If the variance is less than a prescribed threshold value, the pitch streak is classified as music-dominant (Fig. 6-C); otherwise, the streak is classified as speech-dominant (Fig. 6-D).
The music-dominant streaks are excluded from all subsequent procedures such as the computation of the pitch reliability and resynthesizing the original speech signals.
III. EXPERIMENTAL RESULT
In order to verify the effectiveness of the proposed methods, four different configurations were compared: Hu and Wang’s segregation system (“Baseline” in following tables), “Baseline” with pitch track correction using adjacent reliable pitch streaks (“Correction”), “Baseline” with music and speech classification (“Classification”), and with the combination of proposed methods (“Both”). Speech data spoken by eight different speakers in clean environments were selected from the TIMIT speech database. Six types of music data from different instruments were used (M1: played by piano, drum, and bass; M2: electric guitar, drum, and bass; M3: piano; M4: piano; M5: acoustic guitar; M6: acoustic guitar). Six types of simple noise data were used (N1: 1-kHz pure tone; N2: white noise; N3: noise bursts; N4: cocktail party noise; N5: siren; N6: trill telephone) [8]. The inputs of the segregation systems were generated by mixing one of the eight clean speech signals with one of six music or six noise sounds, resulting in 48 (8×6) music-speech mixtures and 48 noise-music-speech mixtures. The sampling rate of all sound files was 16 kHz, and the mixing SNR was set to 0 dB for all mixtures.
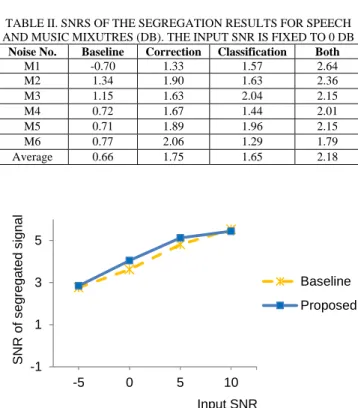
TABLE I shows the SNRs of the segregation results for the noise-speech mixtures. Each value in rows 1 through 6 is the average SNR for the mixtures of a specific noise and eight speech sounds, and the value in the last row is the average of all 48 mixtures. In terms of the total average SNR, adding “Correction” to “Baseline” is most effective, and adding “Classification” slightly lowers the segregation performance, although the difference is minuscule. This is because the interfering sounds are all simple noises, so the proposed music-speech classification has almost no effect. TABLE II shows the SNRs for the music-speech mixtures. When compared with the results in TABLE I, the Baseline performance was significantly worse because the interfering sound is music. Each of the proposed methods significantly improved the Baseline system. Moreover, combining the two methods provided a significant improvement compared with using the individual methods alone.
The segregation experiments for noise mixed speech signal with different SNRs are also implemented. Fig. 7 shows that the proposed system works slightly better than Hu and Wang’s system for speech and noise mixtures with different SNRs. Fig. 8 shows that the proposed system works much better for speech and music mixtures, when compared to the results for speech and noise mixtures.
TABLE I. SNRS OF THE SEGREGATION RESULTS FOR SPEECH AND NOISE MIXUTRES (DB). THE INPUT SNR IS FIXED TO 0 DB
Noise No. Baseline Correction Classification Both
N1 3.39 4.36 3.50 4.07 N2 3.92 4.59 3.92 4.59 N3 2.99 3.51 2.70 3.19 N4 1.67 2.42 1.67 2.42 N5 3.94 4.31 4.28 4.38 N6 5.84 6.41 5.47 5.63 Average 3.62 4.27 3.59 4.05
TABLE II. SNRS OF THE SEGREGATION RESULTS FOR SPEECH AND MUSIC MIXUTRES (DB). THE INPUT SNR IS FIXED TO 0 DB
Noise No. Baseline Correction Classification Both
M1 -0.70 1.33 1.57 2.64 M2 1.34 1.90 1.63 2.36 M3 1.15 1.63 2.04 2.15 M4 0.72 1.67 1.44 2.01 M5 0.71 1.89 1.96 2.15 M6 0.77 2.06 1.29 1.79 Average 0.66 1.75 1.65 2.18 -1 1 3 5 -5 0 5 10 Baseline Proposed Input SNR SNR of s e gr eg at ed s ig nal
Figure 7. Average SNRs of segregation results for various input SNR levels. The inputs are speech and noise mixtures.
-1 1 3 5 -5 0 5 10 Baseline Proposed Input SNR SNR of s e gr ega te d s ign al
Figure 8. Average SNRs of segregation results for various input SNR levels. The inputs are speech and music mixtures.
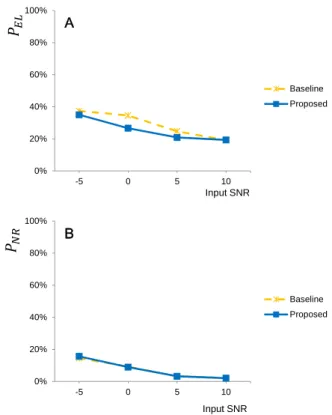
Hu and Wang introduced two other measures in order to evaluate the performance of the segregation systems: and EL P EL P NR P NR
P [8]. “EL” is short for energy loss, and hence, indicates the percentage of target speech excluded from segregated speech. “NR” stands for noise residue, and indicates the percentage of interference included in the segregated speech. By definition, both numbers are inversely proportional to the segregation performance, implying that lower numbers are better. Those numbers are
computed by the ratios of the produced segregation mask to the ideal binary mask. Let be the resynthesized signal by the segregation system, be the signal resynthesized using the ideal binary mask, be the resynthesized signal present in but missing from , and be the resynthesized signal present in S but missing from
. Then and are computed as follows: ) (t S ) (t I e1(t) ) (t I P ) (t S ) t ) ( 2 t e ( ) (t I PEL NR 0% 20% 40% 60% 80% 100% -5 0 5 10 Baseline Proposed 0% 20% 40% 60% 80% 100% -5 0 5 10 Baseline Proposed A B Input SNR Input SNR , ) ( ) ( 2 2 1 t t t I t e
EL P (3) . EL P P ) ( ) ( 2 2 2 t t t S t e NR P
NR P (4)The ideal binary mask is obtained by comparing clean speech and noise signal: if the speech has larger energy than noise in a part of signal, the ideal mask at that part is set to 1; otherwise 0. Theoretically speaking, the ideal binary mask gives the highest performance that any automated segregation system can get.
TABLE III shows the average and for speech and noise mixtures, and
NR
P
EL
P
P
TABLE IV shows the average and for speech and music mixtures. The input SNRs are fixed to 0 dB. In the case of 6 noise signals used in Hu and Wang’s work, the maximum difference in is 12% (N4), and the minimum performance gain is 2% (N6), resulting in average gain 8%. The numbers are almost even, resulting in the difference of the average numbers by 0.29% (9.24%-8.95%). However, in the case of speech and music mixtures shown in Table IV, the proposed method is always better than the baseline. The maximum and minimum improvements are 48% (M1) and 15% (M2), resulting in average gain 25%.
EL
P Figure 9. Average PEL and PNR of segregation results for various input SNR levels. The inputs are speech and noise mixtures.
NR P 0% 20% 40% 60% 80% 100% -5 0 5 10 Baseline Proposed 0% 20% 40% 60% 80% 100% -5 0 5 10 Baseline Proposed A B Input SNR Input SNR
TABLE III. THE MEASURED EL(%) AND NR(%) OF SEGREGATION RESULT FOR SPEECH AND NOISE MIXTURES. .
THE INPUT SNRS ARE FIXED TO 0 DB
Baseline Correction Classification Both Noise No. PEL PNR PEL PNR PEL PNR PEL PNR N1 36.83 3.79 22.17 8.33 32.84 2.37 25.15 6.25 N2 34.32 5.51 23.70 2.77 34.32 5.51 23.70 2.77 N3 29.07 28.57 16.36 29.87 36.24 21.39 22.86 28.10 N4 60.21 14.73 48.31 6.40 60.05 14.50 48.31 6.40 N5 31.69 2.53 24.24 9.57 25.27 2.54 26.44 4.44 N6 15.52 0.30 10.41 0.51 18.13 0.29 13.41 5.74 Avg. 34.61 9.24 24.20 9.57 34.47 7.77 26.65 8.95
Figure 10. Average PEL and PNR of segregation results for various input SNR levels. The inputs are speech and music mixtures.
TABLE IV. THE MEASURED PEL(%) AND NR(%) OF SEGREGATION RESULT FOR SPEECH AND MUSIC MIXTURES.
THE INPUT SNRS ARE FIXED TO 0 DB P
We also compared the segregation results with various SNR levels. Fig. 9 and 10 shows the average and in percent (%) for six noises and six music signals, with varying mixing SNR levels from -5 dB to 10 dB. In the case of speech and noise mixtures shown in Fig. 9, the performance improvements in are about 0~10%, and almost no difference in . However, in the case of music
EL P PNR EL P NR P
Baseline Correction Classification Both Noise No. PEL PNR PEL PNR PEL PNR PEL PNR M1 95.51 92.71 53.67 42.76 63.97 7.95 47.73 7.66 M2 69.18 15.37 62.21 13.65 64.14 15.51 54.81 12.74 M3 72.63 20.89 64.50 12.78 57.48 6.17 56.07 7.73 M4 74.03 38.39 45.58 35.51 65.41 16.71 48.18 21.70 M5 77.47 53.07 54.53 29.87 58.51 20.01 54.14 13.02 M6 74.60 31.72 50.38 24.92 64.36 22.58 54.36 23.56 Avg. 77.24 42.02 55.15 26.58 62.31 14.82 52.55 14.40
mixtures shown in Fig. 10, the improvements in both and measures are 10%~20% for all mixing SNR levels. These results show that our proposed methods are very effective in speech segregation, especially for the speech and music mixtures.
EL
P
NR
P
IV. CONCLUSION
We presented the pitch track correction and the music and speech classification techniques in order to improve the performance of the speech segregation system [8] for speech and music mixtures. The proposed pitch track correction method uses all reliable pitch streaks instead of the longest one to improve the accuracy and robustness of the pitch track correction. The proposed music and speech classification is based on the property that music signals generally have relatively stationary pitch when compared with that of speech. The combined system demonstrated significantly better segregation performance for speech and music mixtures than Hu and Wang’s method, and the performance for speech and noise mixtures was also compromisable. Future work includes analyzing the characteristics of more complicated types of music and natural sound sources.
REFERENCES
[1] A. S. Bregman, Auditory Scene Analysis: The Perceptual Organization of Sound. MIT Press, Cambridge MA, 1990.
[2] P. Smaragdis and J. C. Brown, “Non-negative matrix factorization for polyphonic music transcription,” IEEE workshop on applications of signal processing to audio and acoustics, pp. 177–180, 2003. [Online]. Available: http://ieeexplore.ieee.org/xpls/abs_all.jsp?arnumber= 1285860&tag=1
[3] S. Choi, A. Cichocki, H.-M. Park, and S.-Y. Lee, “Blind source separation and independent component analysis: A review,” Neural Information Processing - Letters and Reviews, vol. 6, 1 2005. [Online]. Available: http://citeseerx.ist.psu.edu/viewdoc/download? doi=10.1.1.81.9655&rep=rep1&type=pdf
[4] B. Raj, T. Virtanen, S. Chaudhuri, and R. Singh, “Non-negative matrix factorization based compensation of music for automatic speech recognition,” in Proc. INTERSPEECH, pp. 717–720, 2010.
[Online]. Available: http://www.isca-speech.org/archive/ interspeech_2010/i10_0717.html
[5] A. Nehorai and B. Porat, “Adaptive comb filtering for harmonic signal enhancement,” IEEE Transactions on Acoustics, Speech, and Signal Processing, vol. 34, no. 5, pp. 1124–1138, 1986. [Online]. Available: http://ieeexplore.ieee.org/xpls/abs_all.jsp?arnumber= 1164952
[6] S. T. Roweis, “One microphone source separation,” Advances in Neural Information Processing Systems, vol. 13, pp. 793–799, 2001. [Online]. Available: http://citeseerx.ist.psu.edu/viewdoc/download? doi=10.1.1.67.3986&rep=rep1&type=pdf
[7] G.-J. Jang, T.-W. Lee, and Y.-H. Oh, “Single channel signal separation using time-domain basis functions,” IEEE Signal Processing Letters, vol. 10, pp. 168–171, 6 2003. [Online]. Available: http://ieeexplore.ieee.org/xpls/abs_all.jsp?arnumber=1198666 [8] G. Hu and D. Wang, “Monaural speech segregation based on pitch
tracking and amplitude modulation,” IEEE Transactions on Neural Networks, vol. 15, no. 5, pp. 1135–1150, 2004. [Online]. Available: http://ieeexplore.ieee.org/xpls/abs_all.jsp?arnumber=1333078 [9] D. D. Lee and H. S. Seung, “Algorithms for non-negative matrix
factorization,” Advances in Neural Information Processing Systems, vol. 13, pp. 556–562, 2001. [Online]. Available: http://citeseerx.ist.psu.edu/viewdoc/download?doi=10.1.1.31.7566&re p=rep1&type=pdf
[10] T. Virtanen, A. Mesaros, and M. Ryynänen, “Combining pitch-based inference and non-negative spectrogram factorization in separating vocals from polyphonic music,” in Proc. ITRW on Statistical and Perceptual Audio Processing, pp. 17–22, 2008. [Online]. Available: http://www.isca-speech.org/archive_open/archive_papers/sapa_2008/ sap8_017.pdf
[11] R. D. Patterson, I. Nimmo-Smith, J. Holdsworth, and P. Rice, “An efficient auditory filterbank based on the gammatone function,” tech. rep., Annex B of the SVos Final Report: The auditory filterbank, APU Report 2341, 1988. [Online]. Available: http://www.pdn.cam.ac.uk/ groups/cnbh/research/publications/pdfs/SVOS%20Annex%20B%201 988.pdf
[12] M. Weintraub, “A theory and computational model of auditory monaural sounds separation,” ph.d. thesis, Stanford University, 1985. [Online]. Available: http://dl.acm.org/citation.cfm?id=912498 [13] M. P. Ryynänen and A. P. Klapuri, “Automatic transcription of
melody, bass line, and chords in polyphonic music,” Computer Music Journal, vol. 32, no. 3, pp. 72–86, 2008. [Online]. Available: http://www.mitpressjournals.org/doi/abs/10.1162/comj.2008.32.3.72 [14] D. L. Wang and G. J. Brown, “Separation of speech from interfering
sounds based on oscillatory correlation,” IEEE transactions on neural networks, vol. 10, no. 3, pp. 684-697, 1999. [Online]. Available: http://ieeexplore.ieee.org/xpls/abs_all.jsp?arnumber=761727
[15] Ray Meddis, “Simulation of auditory-neural transduction: further studies,” Acoustical society of America, vol. 83, pp. 1056-1063, 1988. [Online]. Available: http://dx.doi.org/10.1121/1.396050