Removal of Phosphorus from an Aqueous Solution by Nanocalcium
Hydroxide Derived from Waste Bivalve Seashells: Mechanism and
Kinetics
Mohd D. Khan, Thannaree Chottitisupawong, Hong H. T. Vu, Ji W. Ahn,
*
and Gwang M. Kim
*
Cite This:ACS Omega 2020, 5, 12290−12301 Read Online
ACCESS
Metrics & More Article Recommendations*
sı Supporting InformationABSTRACT: Excessive supply of phosphorus, a vital macronutrient for all organisms, can cause unwanted environmental consequences such as eutrophication. An increase in agricultural and industrial activities has created a considerable imbalance in the phosphorus
cycle with continuing adverse effects on sustainability and ecosystem health, thereby
stipulating/postulating the significance of phosphorus removal. A unique and sustainable
concept for the removal of phosphorus through the utilization of waste bivalve seashells was proposed in the present study. Flat-surfaced and hexagonally shaped nanocalcium hydroxide
particles (∼96% purity) with size ranging from 100 to 400 nm have been synthesized, and
phosphorus from its aqueous solution is treated via precipitation. An optimization study has
been conducted using the Box−Behnken design of response surface methodology, which
highlights that with a calcium/phosphorus mass ratio, pH, and temperature of 2.16, 10.20,
and 25.48°C, a phosphorus removal efficiency of 99.33% can be achieved in a residence
time of 10 min. Also, under the same conditions, diluted human urine was analyzed and
phosphorus removal efficiency of ∼95% was observed. Through experimental results, semiquantitative phase analysis, and
transmission electron microscopy, it has been found that the reaction was diffusion-controlled, which was further confirmed through
shrinking core diffusion modeling. The present study manifests the promising potential of waste seashell-derived nanocalcium
hydroxide for phosphorus treatment and its precipitation in the form of value-added hydroxyapatite.
■
INTRODUCTIONPhosphorus (P) is referred to as a limiting nutrient in the context of water degradation through eutrophication. Excess P concentration can trigger abnormal growth of aquatic plants,
particularly, algae.1 Many researchers have provided evidence
highlighting the acceleration of eutrophication when P
concentration exceeds 0.02 mg L−1.2 The United States
Environmental Protection Agency endorses a total P
concentration of <0.05 mg L−1for each stream entering any
natural reservoir.3 The European Union has more stringent
legislation and recommends threshold limits for P
concen-tration as <0.01 mg L−1 (nonrisk) and >0.1 mg L−1 (risk
condition) in lakes and other natural reservoirs.3According to
the Water Framework Directive, the permissible limit for P
concentration has been reduced to 0.1 mg L−1, which was
earlier set to 1−2 mg L−1.4 Various chemical, biological, and
physical approaches have been developed for effective P
removal, such as chemical precipitation, ion exchange,
electrochemical adsorption, membrane filtration, and
crystal-lization.5−8 Most of these methods possess some limitations,
such as high cost, complex operation, low purity, and secondary wastes, while crystallization is mainly referred to as an economically viable method exhibiting a considerable recovery rate, helping in production of valuable products and
minimization of environmental risks.8,9
Recently, the use of wastes, such as steel slag,9 calcite,10
eggshell,11 red mud,12 seashells,13,14 and lime mud,15 for P
removal has been actively attempted, since these materials have low cost and wide availability. Bivalves are one such group of waste available in abundance and are generally dumped either
in open fields or in landfills.16 The Food and Agriculture
Organization (2016) reported that Europe, Japan, South Korea, and Thailand are among the leading producers of bivalves with the estimated quantity of 632 000, 377 000, 347 000, and 210 000 tonnes, respectively. Above all, China itself dumped annually more than 10 million tonnes of bivalve
waste in landfills.16,17It has been reported in previous studies
that the adverse effects of bivalves, such as evolution of
hazardous gases, including ammonia, amines, and hydrogen
sulfide, and health issues, like malaria, diarrhea, and cholera,
could occur when dumped in public waters and openfields.14
Being rich in calcium, these bivalve wastes can be valorized into desired calcium products, which can be utilized in the Received: March 5, 2020
Accepted: April 14, 2020
Published: May 21, 2020
Article
http://pubs.acs.org/journal/acsodf
copying and redistribution of the article or any adaptations for non-commercial purposes.
removal of P. This can simultaneously eliminate three problems: (i) waste management of bivalve shells; (ii) treatment of P-contaminated wastewater; (iii) reutilization of P in the form of value-added products.
Till date, most of the studies on P removal utilizing bivalves and other calcium-rich waste materials have been providing contradicting results. For example, some studies emphasized
the adsorption of P as the major removal mechanism,9,18,19
while some other studies stressed on a precipitation
mechanism.5,20,21Their treatment time in the previous studies
ranged from several minutes to days. In addition, none of those studies focused on any sustainable technique to reduce the resultant high pH of water after P removal. There is ample literature available on the removal of P by the golden standard of activated carbons through adsorption, but those studies either focused on low-P-concentrated aqueous solutions or provided considerably low performance with
high-P-concen-trated waters.22,23 Therefore, for the removal of
high-P-concentrated wastewater, development of new sustainable P removal agents is required. Only few studies on the removal of P from wastewater with seashells were found but, to the best of our knowledge, none with the seashell-derived nanocalcium hydroxide (N-CH).
Thus, there is an urgent need to address these voids and to
provide a more sustainable solution that can effectively treat P
from wastewater and form a valuable product without causing
any secondary effects to the environment. Therefore, the
objectives of the present work are as follows: (i) valorization of bivalves, such as abalone, mussel, scallop, oyster, and Manila
clam shells, into N-CH with similar physicochemical proper-ties; (ii) performance of P removal by synthesized N-CH; (iii)
the influence of various parameters on P removal efficiency;
and (iv) elucidation of a unique and distinctive formation mechanism of the product formed with the interaction of P and N-CH (i.e., hydroxyapatite) through batch experiments, spectroscopic investigations (Fourier transform infrared (FTIR) spectroscopy), semiquantitative phase analysis (X-ray
diffraction (XRD)), and shrinking core modeling (SCM).
■
RESULTS AND DISCUSSIONPhysicochemical Characterization of Synthesized N-CH. The elemental compositions of raw bivalve seashells were
determined by X-rayfluorescence (XRF) and were compared
with that of natural limestone, as depicted inTable S1. The
obtained elemental compositions of raw bivalves were found analogous to that of natural limestone. The semiquantitative phase analyses of raw bivalves and synthesized N-CH were carried out by XRD analysis. All of the peaks of each raw
sample were identified to be of calcium carbonate. The two
major phases of raw bivalves in the present study were the
rhombohedral calcite phase having a space group R3̅c (space
group no. 167; PDF card no. 86-0174) and the orthorhombic
aragonite phase having a space group Pm̅ cn (space group no.
62; PDF card no. 05-0453), which are calcium carbonates
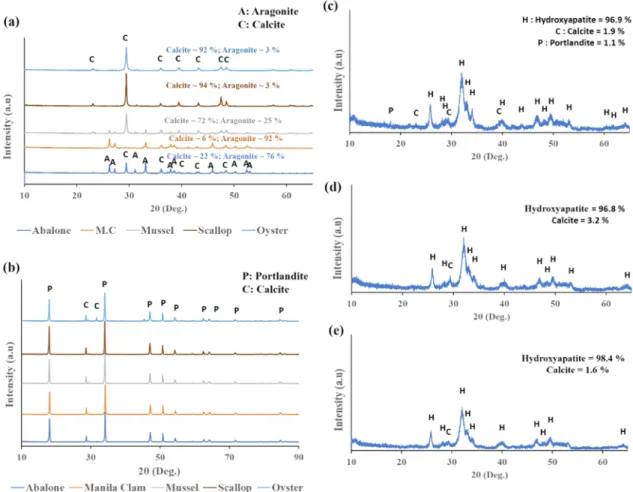
presented inFigure 1a. However, the proportion of the calcite
and the aragonite phases varies depending on the type of bivalve. For abalone, the amounts of aragonite and calcite phases were approximately 76 and 22%, respectively. Similar
Figure 1.XRD patterns and a semiquantitative phase amount of (a) all of the raw bivalve seashells, (b) synthesized N-CH from respective seashells, and of post P-treated N-CH after (c) 1 min, (d) 2 min, and (e) 5 min.
trends in the case of Manila clam were observed. That is, the amounts of aragonite and calcite phases were around 92 and 6%, respectively. For mussel, scallop, and oyster, the calcite phase dominates with around 72, 94, and 92%, respectively, whereas the amounts of the aragonite phase were around 25, 3, and 3%, respectively. Similar XRD patterns for bivalve seashells, particularly oyster and mussel shells, were reported
in recent studies, confirming the dominant phase of calcite in
oyster vs a mixture of aragonite (62%) and calcite (38%) in
mussel shells.24,25
The XRD patterns of the synthesized N-CH with different
bivalves are shown in Figure 1b. The patterns of the
synthesized N-CH with different bivalves showed peaks due
to the hexagonal portlandite phase having a space group P3̅m1
(space group no. 164; PDF card no. 87-0674) and the vestigial calcite phase (space group no. 167; PDF card no. 86-0174) that pre-existed as residual (unreacted calcite remnants during N-CH synthesis) along with calcite formation due to carbonation during the synthesizing processes. It was also reported that the small amount of calcite can also be formed
due to instantaneous carbonation during the drying process.25
This signifies that the crystalline characteristics of synthesized
N-CH particles with different bivalves were mostly identical.
To determine the amount (%) of the phase of calcium hydroxide in the synthesized N-CH, N-CH particles from respective shells were mixed in equal proportion by weight and a semiquantitative phase analysis was performed. The results showed a high proportion of calcium hydroxide in the resultant
N-CH (∼96%) along with calcite (∼3%) and halite (∼1%) as
minor impurities, depicted in Figure S1. The added value of
this mixing procedure includes the determination of any possible deviation in the proportion of calcium hydroxide and P removal performances by N-CH derived from each shell.
The functional groups of bivalve seashells and synthesized
N-CH were characterized by FTIR, as shown inFigure 2. For
bivalve shells, as shown inFigure 2a, spectra were corroborated
with XRD analysis, confirming the vibration modes of C−O
bonds in CO32−groups and highlighting the presence of both
calcite and aragonite phases. Aragonite exhibits characteristic
bands at 1083 cm−1 (ν1 symmetric stretching) and at ∼856
cm−1(out-of-plane bending-ν2) in its spectrum. Interestingly,
for aragonite, ν1 symmetric stretching at 1083 cm−1 is both
infrared- and Raman-active, whereas in the case of calcite, it is
only Raman-active. Thus, the peak at∼1080 cm−1is generally
used to determine aragonite from a blend of aragonite and
calcite.26In addition,ν2vibrations (out-of-plane bending) are
infrared-active for both phases but possess characteristic shifts.
For instance, for aragonite,ν2vibrations emerge at∼855 cm−1,
whereas for calcite, this vibration turns up at∼875 cm−1. Other
bands that were attributed to aragonite are a doublet at 712
(in-plane bending, ν4a) and 701 cm−1 (ν4b) and another
doublet at 1464 (asymmetric stretching,ν3a) and 1448 (ν3b).
For calcite characteristic shifts forν3andν4, vibrations appear
at∼1453 and ∼713 cm−1, respectively. Overall, the presented
data are also in agreement with those from Ferraz et al.26,27
The minor absorption bands in a range of 2350−2400 cm−1
denote the adsorbed carbon dioxide from the surrounding
environment on the surface of the particles.28For synthesized
N-CH as shown inFigure 2b, the sharp peak of the absorption
band at 3643 cm−1 corresponds to the OH− stretching,
confirming the presence of calcium hydroxide.29Other minor
absorption peaks defining the CO32− groups formed due to
carbonation during the synthesis of N-CH.27
The morphological analysis of synthesized N-CH was
carried out through field emission scanning electron
microscopy (FE-SEM). A hexagonal nanoplate (∼100−400
nm) derived from respective shells forming a compact layered structure through multiple self-attachments was observed in Figure 3. The morphologies of synthesized N-CH samples
were analogous, thereby confirming the concordance of similar
morphology. Similar results have also been reported in the
recent literature, confirming the production of calcium
hydroxide with a similar shape and crystal size range.30,31
Brunauer−Emmett−Teller (BET) analysis was carried out
to identify the specific surface area of synthesized N-CH. The
specific surface areas were very low for all N-CH and fell in the
Figure 2. FTIR patterns for (a) the raw bivalve seashells, (b) synthesized N-CH, and (c) N-CH collected post P removal experiment.
range of 4.5−5.0 m2 g−1. Similar results were obtained in previous studies where the specific surface area of the calcium hydroxide nanoparticles synthesized with calcium nitrate
decahydrate in an aqueous medium was approximately 8 m2
g−1.32,33Also, from FE-SEM microimages (Figure 3), it can be
noticed that the nanoparticle surfaces were considerably flat
with compact layers that justify the occurrence of low surface
area.32
Precipitation Performance of Phosphorus. The
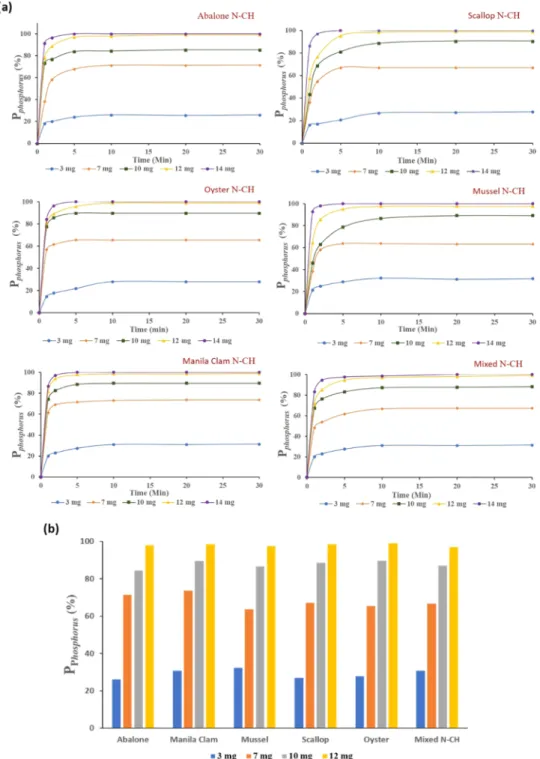
de-tailed experimental results for PPhosphorus with seashell-derived
nanocalcium hydroxide (N-CH) are displayed inFigure 4a. It
was observed in the phosphorus removal tests that P removal rates were spontaneous in the initial 60 s and then gradually reached equilibrium conditions in approximately 10 min. The initial spontaneity can be due to the wide accessibility of
N-CH’s surface area for phosphate ions’ contact to persuade a
chemical reaction.15 This probability might gradually reduce
due to saturation (discussed in a later section) and thereby considerably reduce the reaction rate prior to achieving an
equilibrium state. The precise differences in the PPhosphorusat 10
min by the N-CH derived from different shells are illustrated in
Figure 4b. The minor differences of PPhosphorus observed with
each shell-derived N-CH can be a resultant effect of diminutive
differences in surface areas and variabilities in contact between
N-CH and phosphate ions. The optimum Ca−P mass ratio for
maximum PPhosphorus in the present study was approximately
2.16, as shown in Figure 5. The obtained experimental data
showed a close similarity in the patterns of PPhosphorus
representing a comparable performance of synthesized N-CH
irrespective of the source shell. To confirm this behavior, equal
portions by weight of N-CH derived from each shell were mixed and identical experiments were conducted, and the
results were found in correspondence with those conducted with individual shell-derived N-CH. This result indicates that
the PPhosphorus of synthesized N-CH is not dependent on the
source shell.
Since other anions and cations are also present in wastewater, it is important to analyze the competing precipitation between P and other ions to N-CH; therefore, a human (male) urine sample was chosen to test for P removal. Table S2 illustrates the average composition of ureolyzed
human (male) urine.Figure 6demonstrates the experimental
results with the real urine sample compared with only P in an
aqueous medium. A slight dip (∼3.5%) in PPhosphorus was
observed with the urine sample when compared with an aqueous solution at the equilibrium condition. This drop can
be explained with the presence of SO42− ions, as these ions
possess a tendency to form calcium sulfate.34It has also been
reported that with high sulfate concentration (SO42−/PO43−>
10) sulfate considerably inhibits P removal.34Co-precipitation
of SO42−and PO43−on calcium nanoparticle surface with the
solution containing both SO42−and PO43−was also evident in
the recent study, thereby inhibiting P removal.35 This overall
performance highlights the potential of N-CH with high selectivity toward P over other anions.
Optimization through the Box−Behnken
Method-ology. Table 1illustrates the range of independent variables
for investigating the effect on a dependent variable, i.e.,
PPhosphorus. The ranges for X1, X2, and X3were decided on the basis of preliminary experimental results and relevant
literature.21,36 It is critical to consider the change in the pH
value of a phosphorus solution due to addition of N-CH as it
modifies the solution pH due to release of -OH ions.
Therefore, “E” refers to pH at an equilibrium state after
Figure 3.FE-SEM images of synthesized nanocalcium hydroxide derived from (a) abalone shell, (b) Manila clam shell, (c) mussel shell, (d) scallop shell, and (e) oyster shell.
adding N-CH, whereas “I” refers to the initial pH before adding N-CH. The variations in the pH value of the solutions
on addition of N-CH particles is shown in Figure S2. The
experiment with conditions at the center point (1.35, 8.47E,
25) was repeatedfive times and similar results were obtained,
indicating the repeatability and reproducibility of the data. The implementation of response surface methodology (RSM) provides an empirical relationship between independ-ent variables and the response function of a system. A mathematical relationship in terms of a quadratic polynomial equation can be developed, which represents the complex
correlations between independent and dependent variables. MINITAB 16, a statistical and regression software, was used to
determine the response function coefficients for a dependent
variable through the correlation of experimental outcomes. The selected dependent and independent values along with
obtained experimental data for PPhosphorus are illustrated in
Table S3. The obtained quadratic polynomial equation
representing the response function, i.e., PPhosphorus, is presented
as follows
Figure 4.Experimental results of (a) P treatment through N-CH from the respective sea shell; an equal amount of mixed N-CH was also tested, (b) comparison bar graph for experimental results of P treatment through N-CH from the respective seashell after 10 min. (Experimental conditions: P concentration = 20 mg L−1; volume = 150 mL; pH (prior to the addition of N-CH) =∼7.5; temperature = 21 °C; and stirring rate = 300 rpm.).
= − + + + − − − + = = = P X X X X X X X X R R R (%) 243.26 10.96 49.92 1.58 18.21 2.90 0.03 8.01 value 0.9897; (pred) 0.9015; (adj) 0.9817 Phosphorus 1 2 3 12 22 32 1 2 2 2 2 (1)
The R2value was determined as 0.9897. The predicted results
obtained through eq 1 are contiguous to the experimental
outcome, which represents the prediction capability (R2 =
0.9015) of the software used. The coefficients in eq 1
demonstrate that PPhosphorusincreases with the Ca−P mass ratio
(X1), pH (X2), and temperature (X3). The Ca−P mass ratio
and pH values have a dominant effect on PPhosphoruscompared
with temperature. FromTable S3, it can be observed that all of
the experiments at a low pH (pH = 5.76E) provided negligible
efficiencies since solubilities of calcium products are
consid-erably high in low-pH solutions and therefore unable to
precipitate.37An efficiency of 97.1% was achieved at values for
Ca−P mass ratio, pH, and temperature as 2.16, 11.17E, and 25
°C, respectively. The extent of the influence of temperature is
considerably low and can be seen when the Ca−P mass ratio
and pH are kept constant at 2.16 and 8.47E, respectively, and
with a temperature rise from 10 to 40 °C, with PPhosphorus
incremented by only∼4%.
For extended influences of these independent variables on
PPhosphorus, analysis of variance (ANOVA) was carried out and
the results are depicted in Table 2. Response function
predictions were in correspondence with the obtained
experimental results (R2 > 0.90). A comparison between
model variance and residual variance can be made through ANOVA by F-test. Similar variances resemble a ratio near unity, which indicates a narrow possibility of variables to have
any significant influence on the response function. The
inconsistency and lack of fit are evident if the probability of
the F value represented by the p value is very small (<0.05). The p value in the present modeling refers to the probability of obtaining the observed F value in the case of a true null hypothesis. Smaller p values (<0.05) therefore illustrate the need for repudiation of the null hypothesis. The resultant data
fromeq 1are significant, as confirmed by the F-value test and
ANOVA by fitting the independent variable’s data with the
response function quadratic polynomial model. It was found
that all of the coefficients ineq 1have a p value less than 0.05
(significant), except those for X1X3 and X2X3 (insignificant).
The linear effect of coefficients for the Ca−P mass ratio X1(p
< 0.039), pH X2(p < 0.000), and temperature X3(p < 0.010)
is significant, indicating direct proportionality to PPhosphorus. In
addition, the interactive effect of the Ca−P ratio and pH (p <
0.000) is significant, while those of the Ca−P mass ratio and
temperature (p < 0.687) and pH and temperature (p < 0.790)
are insignificant. These insignificant terms do not have an
influential effect on PPhosphorus, therefore being ignored ineq 1.
The p values of the coefficients of quadratic terms, i.e., the Ca−
Figure 5.P removal efficiency with a changing Ca−P mass ratio. The Ca−P mass ratio onward, P removal efficiency was found to be maximum (∼97%).
Figure 6. Experimental results of P treatment in a diluted urine sample and an aqueous solution through mixed N-CH. (Experimental conditions: P concentration in urine∼22 mg L−1; P concentration in an aqueous solution∼21 mg L−1; volume = 150 mL; pH (prior to the addition of N-CH) =∼7.5; temperature = 21 °C; and stirring rate = 300 rpm.).
Table 1. Independent Factors and the Level forPPhosphorus
Optimization Study
range and levels
factors lower center upper
Ca−P ratio (X1) 0.54 1.35 2.16
pH (X2) 2I 5.5I 9I
5.76E 8.47E 11.17E
temperature (°C) (X3) 10 25 40
IInitial pH value.EpH value at the equilibrium state.
Table 2. Analysis of Variance (ANOVA) Test for the
Response FunctionPPhosphorus
source
sum of
squares Df
mean
square F value p value
regression 16 605.8 7 2372.26 123.55 0.000 X1Ca−P 15.1 1 15.11 7.9 0.039 X2pH 1801.4 1 1801.35 93.81 0.000 X3temperature 202.7 1 202.65 10.55 0.010 X12 601.3 1 601.27 31.31 0.000 X22 1901.3 1 1901.32 99.02 0.000 X32 199.0 1 199.01 10.36 0.010 X1X2 1232.0 1 1232.01 64.16 0.000 X1X3 2.2 1 2.25 0.08 0.687a X2X3 1.8 1 1.82 0.06 0.790a residual error 172.8 9 19.20 lack offit 168.5 5 33.70 31.35 0.003 pure error 4.3 4 1.08 total 16 778.6 16 aInsignificant value.
P mass ratio X12 (p < 0.000), pH X
22 (p < 0.000), and
temperature X32 (p < 0.010), are also significant. For the
quadratic model expressed ineq 1, ANOVA provided an R2
value of 0.9897; F value, 123.55; a probability of∼0.90; and a
coefficient of variation (CV) of 4.3, indicating a high potency
of the model and highlighting the accuracy and reliability of
experiments (Table 2).
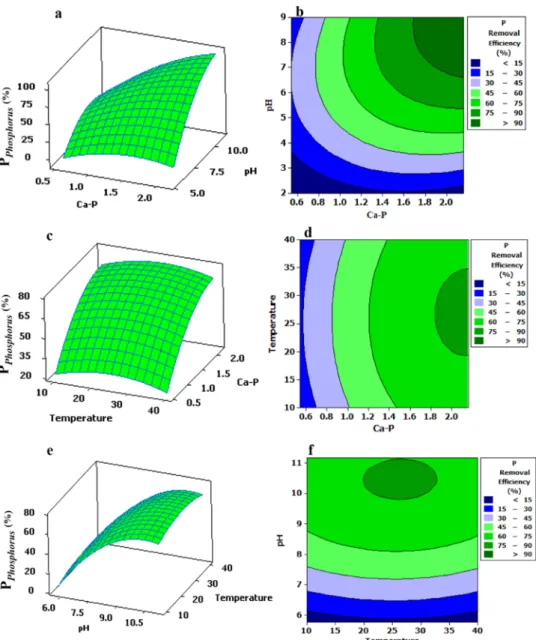
Figure 7illustrates the response surface plots depicting the
relationship between the Ca−P mass ratio, pH, and
temper-ature over PPhosphorus. The influence of the Ca−P mass ratio
with respect to pH and temperature is shown inFigure 7a−d.
It was observed that PPhosphorusincreases with the Ca−P ratio
till it reaches a maximum value of 2.16 (Ca−P molar ratio =
1.69), beyond which PPhosphorus nearly remained constant,
representing a linear relationship, also shown in Figure 5.
Figure 7b depicts the maximum PPhosphorus, which falls in the
Ca−P mass ratio range of ∼1.8−2.16.Figure 7d also confirms
a similar range of the Ca−P mass ratio for the maximum
attainable PPhosphorus. A similar study was conducted where the
maximum removal of phosphorus (98.85%) was achieved with
the Ca−P molar ratio of 2.07, which is much higher compared
with the present case, i.e., 1.69.38 Another recent study also
reported that the Ca−P molar ratio of 1.667 was suitable for
the formation of hydroxyapatite that is a highly stable and
practically insoluble form of Ca−P product in an aqueous
medium (solubility product (Ksp) = 3.7× 10−58).36,39 In the
present case also, the hydroxyapatite phase was observed as a precipitated product (discussed later in detail). However, if the Ca−P mass ratio is greater than the stoichiometric ratio of hydroxyapatite, calcium hydroxide can be formed in addition
to hydroxyapatite.40
The effect of temperature on PPhosphorus is presented in
Figure 7c−f. Unorthodox results were observed as the PPhosphorus value at around 25 °C was comparatively higher
than that at 10 and 40 °C, respectively. A reasonable
explanation behind this unorthodoxy can be made using two phenomena that can occur simultaneously: (a) solubility of N-CH and (b) nucleation of hydroxyapatite. Both of these
phenomena can be significantly influenced by small variations
in temperature.21,41At low temperatures, the solubility of
N-Figure 7.Three-dimensional (3-D) response surface plot for the effect of (a, b) Ca−P and pH, (c, d) temperature and pH, and (e, f) Ca−P and temperature on PPhosphorus.
CH (Ksp = 4.7 × 10⁻⁶ at 25 °C) is comparatively high and
decreases gradually as the temperature increases (Ksp= 7.83×
10−7at 100°C).41Here, the Kspat high temperatures is lower
because of Le Chatelier’s principle, i.e., heat is one of the
products of the N-CH solubility reaction affecting the
reactivity; therefore, the system tends to shift in the reverse direction, making N-CH less soluble. The case with nucleation of hydroxyapatite is exactly reverse. That is, a relatively higher temperature is favorable for the formation of hydroxyapatite as
its formation in the present case is endothermic (ΔH = 195.4,
283, and 305.8 kJ mol−1with PO43−, HPO42−, and H2PO4−,
respectively), depending on the form of phosphate present in
the solution, which, in turn, depends on the solution pH.42For
example, it was reported in previous studies that there is considerable acceleration in the rate of formation of hydroxyapatite with temperature. For instance, the formation
of pure phase hydroxyapatite takes place in 24 h at 25 °C,
while it takes only 5 min at 60°C.21Therefore, the coupled
effect of these two phenomena holds the tendency to
compensate each other to an extent, thereby providing slightly
higher PPhosphorusat a temperature of ∼25 °C.
The pH of the solution was one of the most influential
parameters in practical P treatment operations from
waste-water in the present study, as it can significantly affect the
physicochemical properties of the precipitant (N-CH), nature
of contaminants (such as H2PO4−, PO43−, and HPO42−), and
even the precipitated product (hydroxyapatite). Specifically,
the pH value can significantly influence the solubility of N-CH,
as at low pH, the dissolution of Ca2+ ions is comparatively
higher, which gradually decreases with increasing pH.18 The
dissolved Ca2+ ions then initiate to precipitate at pH > 12.4
due to the saturation of water with calcium hydroxide.43
Additionally, the pH value significantly alters the existing form
of phosphate in solutions because of its polyprotic nature. The phosphate dissociation equilibrium in an aqueous solution with
respective pK values is depicted in the following equations44
↔ − + +[ K ∼ ] H PO3 4 H PO2 4 H p 1 2.2 (2) + ↔ + [ ∼ ] − + − + K H PO2 4 H HPO42 2H p 2 7.3 (3) + ↔ + [ ∼ ] − + − + K HPO42 2H PO43 3H p 3 12.3 (4)
At pH < 2.2, phosphate was present in the form of H3PO4due
to very high acidity, and thereby the precipitation in the form of hydroxyapatite was not possible. When 2.2 < pH < 7.3, the
dominant form was mostly H2PO4− and could form a
precipitated product. With pH > 7.3, the dominant form of
phosphate was HPO42−, and as the result suggests inFigure 7,
it can be the form of phosphate most suited for the nucleation
with Ca2+ions to form the precipitated product. Finally, when
the pH value was approximately 12.3, PO43−was a dominant
form.34Finally, the solubility of hydroxyapatite also followed a
behavior similar to that of calcium hydroxide. Its solubility is much higher at low pH, which gradually decreases and almost
becomes insoluble at pH > 7.4 with Ksp ∼ 10−59 at 25 °C.45
This is the reason that even with high solubility of N-CH at low pH, hydroxyapatite cannot be precipitated, providing
negligible PPhosphorus. Thus, as per the explanation, the reaction
for the formation of hydroxyapatite can be expressed as
follows36,42
+ ↔ +
+ − +
10Ca2 6HPO42 Ca (PO ) (OH)10 4 6 2 6H (5)
+ + ↔
+ − −
5Ca2 3PO43 OH Ca (PO ) OH5 4 3 (6)
The resultant PPhosphorusis the outcome of the synergistic effect
of the Ca−P mass ratio, pH, and temperature. Conditions
favoring one variable resulted in thwarting another. This causes the origination of an elliptical bubble representing a region
with a parallel effect of the most favorable conditions shown in
Figure 7d,f. A continuous drop of 0.033 pH unit °C−1 with increasing temperature was also reported, highlighting the
interdependency of these variables.46 The accurate values of
optimized conditions achieving the maximum PPhosphorus
(99.33%) for the Ca−P mass ratio, pH, and temperature
were 2.16, 10.20E, and 25.48 °C, respectively (illustrated in
Figure S5). Similar pH was also observed by a study suggesting
a pH range of 9−11 at room temperature for considerably
better crystallization of the thermodynamically most stable
form of calcium phosphates, i.e., hydroxyapatite.19,36
Finally, with stringent environmental regulations, treated water with such a high pH cannot be discharged into surface waters. Thus, the carbonation method has been applied to
control the pH of the treated water. One hundred and fifty
milliliters of treated water was further processed with
accelerated carbonation having a CO2 injection rate of 100
mL min−1with a continuous stirring rate of 300 rpm for 2 min.
The resulting pH abruptly reduced from 11.17 to 6.71 in only
2 min due to the formation of carbonic acid. A pH∼6.5−7.5 is
considered safe for discharging treated water into surface
waters.47
Mechanism and Kinetic Studies. The calcareous precipitation containing treated P was found to be
hydrox-yapatite, as confirmed by XRD and FTIR presented inFigures
1c−e and 2c, respectively. Minor impurities in the form of
calcite (2−3%) were also observed due to atmospheric
carbonation during the treatment process. It seems to be a simple chemical reaction between phosphate ions and calcium ions, but this overall reaction mechanism is rather more
sophisticated. Depending on the Ca−P mass ratio and reaction
time, other reactions are accompanied during the formation of hydroxyapatite. Previous studies provided evidence for the
formation of octacalcium phosphatefirst (Ca−P molar ratio =
1.33), which is highly unstable and transforms into amorphous
calcium phosphate (Ca−P molar ratio = 1.5).21In later stages,
this amorphous calcium phosphate first mutates to
calcium-deficient hydroxyapatite [Ca10−x(HPO4)x(PO4)6−x(OH)2−x·
nH2O], which almost instantaneously transforms into most
stable hydroxyapatite [Ca10(PO4)6(OH)2].21 This overall
transformation is very rapid and can be understood by “successive transformation” or Ostwald’s rule of stages for achieving the most thermodynamically stable form, as shown
in eq 5.48 The transmission electron microscopy (TEM)
nanoimages provided a visual and compositional testimony of the newly developed crystalline phase alteration during the P
removal experiment, comparable to the previous study.21The
texture of the mellowlyfine nanostructure is shown inFigure
S4, indicating hydroxyapatite as homogeneous aggregates.
The kinetic studies of P removal or hydroxyapatite formation through calcium hydroxide were rather more
conflicting in previous studies. For instance, a study found
the hydroxyapatite formation reaction as of the first order
while some studies suggested the need for further
inves-tigation.21To converge this void, a series of experiments were
conducted along with semiquantitative phase analysis by XRD to identify the kinetics behind the genesis of synthesized
hydroxyapatite. A 500 mL P solution having a concentration of
209 mg L−1was treated with N-CH having a Ca−P mass ratio
of 2.16. This implies the presence of 104.5 mg of P in 500 mL of the solution. The precipitated particles at 1, 2, and 5 min were separated and semiquantitative XRD analysis was carried
out, as depicted inFigure 1c−e. It was observed that 96.9% of
N-CH was converted into hydroxyapatite after a residence time of 1 min, whereas only 44.12 mg (42.22%) of phosphorus was
utilized. Theoretically, for this amount of hydroxyapatite,∼110
mg of P is required. This unorthodox result can be understood
with the fact that XRD can only provide the crystal’s surface
analysis. After 2 and 5 min of residence time, the N-CH conversions were 96.8 and 98.4%, respectively, which are almost similar to N-CH conversions in 1 min. However, a
significant increment in the amount of P removal (50.08 and
64.19 mg) was observed and continued with residence time, as
shown inTable S4. A possible theoretical explanation of the
observed results can be phosphate ions’ diffusion into N-CH,
resulting in a stretching front of the reacted material surrounding an inner core of nonreacted N-CH; brief steps
regarding the description of the diffusion mechanism are
provided in Figure S5. According to previous studies, the
shrinking core model (SCM) for the present reaction behavior
can be the best suited kinetic model.49,50They also suggested
that film diffusion control, surface chemical reaction, and
internal diffusion process can be responsible for the slowest
step, controlling the system. To confirm that the reaction rate
is controlled by a chemical reaction or diffusion, the respective
kinetic modeling was performed. Equation 7 expressed the
integral rate equation for the chemical process and as the
rate-controlling step. If diffusion is considered as the
rate-controlling step where diffusion is taking place through an insoluble core (a solid layer) surrounding the unreacted core,
eq 7can be rewritten as shown ineq 849
− −x =K t 1 (1 )1/3 CP (7) − x− − x =K t 1 2 3 (1 ) 2/3 D (8)
where KCP and KD refer to the chemical rate constant and
diffusion rate constant, respectively; x is the fraction reacted;
and t is the reaction time. As pereqs 7and8, the plot of [1−
(1− x)1/3] vs t is a straight line if the rate-controlling step is a
chemical process, whereas if the plot of [1 − 2/3x − (1 −
x)2/3] vs t is a straight line, this confirms the diffusion process
as the rate-controlling step of the system.Figure 8a presents
the linear plot of [1− 2/3x − (1 − x)2/3] vs t with K
D= 0.010
and an R2value of 0.983.Figure 8b illustrates a linear plot of [1
− (1 − x)1/3] vs t with K
CP= 0.032 and an R2value of 0.843.
Here, the rate constant (KD) was found to be the best SCMfit,
based on the correlation coefficient (R2 = 0.983 > 0.843) of
kinetic data. Therefore, it can be conferred that diffusion is the dominant rate-controlling mechanism for P removal or formation of hydroxyapatite.
■
CONCLUSIONSIn the present work, N-CH was synthesized from waste bivalve seashells through a chemical precipitation method followed by
efficient P removal from an aqueous solution. The synthesized
N-CH from each type of seashell possessed corresponding physicochemical properties (hexagonal shape with a size range
of 350−400 nm), which highlights wide availability and
reutilization potential of the wastes as a valuable raw material. The study conducted by response surface methodology explained the complex dependency of independent variables on PPhosphorusand within each other. The optimized parameters
for a maximum PPhosphorusvalue (99.33%) were identified as the
Ca−P mass ratio, pH, temperature, and time values of 2.16,
10.20E, 25.48°C, and 10 min, respectively. Ureolyzed diluted
urine was also treated at the same experimental conditions, and
the resulting PPhosphorusvalue of∼95% highlights the extent of
selectivity for P removal by N-CH. A significant extension in
the mechanism and kinetic studies has been made by providing
experimental and SCM modeling (R2= 0.983 and K
D= 0.010)
evidence exhibiting diffusion as the rate-controlling step. This
unique mechanism was rarely discussed before in the context of removal of P from the aqueous solution. However, additional research is required to estimate the feasibility of the N-CH treatment process in pilot or full-scale water treatment plants.
■
EXPERIMENTAL SECTIONMaterials. Abalone, Manila clam, mussel, scallop, and oyster shells were collected from a local supplier in Daejeon,
South Korea. Hydrochloric acid (35−37% concentration) and
sodium hydroxide (97% purity) were purchased from Junsei Chemical Ltd., South Korea. A stock solution with P
concentration of 500 mg L−1 was prepared by dissolving
potassium phosphate dibasic (K2HPO4) in distilled water,
while other lower concentration solutions were prepared by the dilution method. All mentioned chemicals were of analytical grade, and raw materials were used without any
further purification.
Human urine was collected from the male toilet of Mineral Resources Research Division (Korea Institute of Geoscience and Mineral Resources, Daejeon, South Korea). The unequally
diluted and ureolyzed (4 days) urine (withflushing in urinals) was diluted further to meet the desired initial P concentration before the experiment. The average composition of ureolyzed
urine is illustrated inTable S2.
Synthesis of Nanocalcium Hydroxide (N-CH). The
shells were separately washed and dried at 105°C for 4 h in an
oven. The shells were then pulverized with a vibrating cup mill
(TMC, Fritsch, Germany), and sieved particles (<75μm) were
used for the experiments. For the elimination of carbon dioxide
and volatile impurities, sieved shells were calcinated at 900°C
for 2 h.14 Twenty grams of the calcinated shell was then
carefully mixed with 250 mL of hydrochloric acid (1 M) at a constant stirring rate of 300 rpm. The solution was then filtered (MF-Millipore membrane filter, mixed cellulose ester,
0.2 μm) and heated to 90 °C since the solubility of
atmospheric CO2in water is minimum at this temperature.14
This temperature also greatly favors the origination of a perfect
hexagonal calcium hydroxide nanoparticle.30Finally, 250 mL
of the sodium hydroxide solution (1 M) was added dropwise
to thefiltered solution at the same stirring rate. The mixture
slowly turned milky in color, which confirms the synthesis of
N-CH. These particles were then separated throughfiltration
and carefully washed to remove any trace amount of HCl and NaOH. The synthesized N-CH were stored in a desiccator
after drying at 105 °C for 4 h. This process was repeated to
synthesize N-CH particles from all five bivalve shells, i.e.,
abalone, Manila clam, mussel, scallop, and oyster shells. A schematic diagram for the synthesis of N-CH from bivalve
shells is illustrated inFigure S6.
Test Methods. Batch Experiments. The experiments to
investigate the effect of Ca−P mass ratios, pH, contact time,
and temperature on the P removal from P stock solution were performed in a series of batch experiments. The pH adjustments were made through HCl (1 M) and NaOH (1
M). The experiments were performed with a fixed P
concentration of 20 mg L−1at 21 °C with constant stirring
at 300 rpm. P stock solutions of 150 mL were treated with 3, 7, 10, 12, and 14 mg of N-CH, respectively, while phosphorus
removal efficiency (PPhosphorus) was recorded at designated time
intervals until the equilibrium was obtained. For minimizing
the sample turbidity, each sample wasfiltered (MF-Millipore
membrane filter, mixed cellulose ester, 0.2 μm). Figure S7
represents a schematic diagram of P removal from stock solution with bivalve-derived N-CH.
Chemical Analysis. Total phosphorus, total chemical
oxygen demand (COD), and ammonia analyzing kits
“HS-TP-L” (range: 0.01−3 mg L−1), “HS-COD-Mn-L” (range:
0.6−20 mg L−1), and“HS-NH3(N)-L” (range: 0.2−6 mg L−1)
in accordance with the standard ascorbic acid, Nessler, and reactor digestion spectrophotometric method, respectively, have been used to evaluate the P, total COD, and ammonia
concentrations in the required experiments through a UV−vis
spectrophotometer (Humas Co., Ltd., South Korea).51Sulfate,
chloride, and nitrate were determined by ion chromatography (881 compact IC pro, Switzerland). The measurements for P, total COD, and ammonia were conducted at 880, 540, and 415 nm wavelengths, respectively, which correspond to the
maximum absorbance. The P efficiency was calculated as
follows9
= C −C ×
C
phosphorus removal efficiency (%) ( 0 ) 100
0
(9)
where C0and C denote initial and terminal concentrations of P
in the solution with N-CH.
Optimization through Response Surface Methodology.
The effects of the three independent variables, i.e., Ca−P mass
ratio (X1), pH (X2), and temperature (X3), on phosphorus
removal efficiency (PPhosphorus) were investigated through the
Box−Behnken statistical experiment design of response surface
methodology (RSM). The optimization method includes response analyzation of statistically designed combinations,
identification of coefficients best fitted for the experimental
data of that response function, prediction of response for the fitted model, and analyzing the model adequacy. A mathematical relationship in terms of a quadratic polynomial equation was developed, which represents the complex correlations between independent and dependent variables. Thiseq 10can be expressed as
= + + + + + + + + + Z l l X l X l X l X X l X X l X X l X l X l X i i o 2 2 3 3 12 1 2 13 1 3 23 2 3 11 21 22 21 33 2 (10)
where “lij” is the coefficient of independent variables and Z
denotes the response function.
Crystalline Characteristics. The phase identification and structural analysis of raw shells and produced N-CH were
investigated by powder X-ray diffraction (XRD) operating at
40 kV and 30 mA employing Cu Kα radiation (λ = 1.54 Å) in a
range of 2θ from 10 to 90° (BD2745N, Rigaku, Tokyo, Japan).
Semiquantitative phase analysis (X’Pert MPD, Philips,
Nether-lands) was used for investigation of sample purity and kinetic study. A Fourier transform infrared (FTIR) spectroscopy
analysis (6700 FTIR, Thermo Scientific Nicolet,
Massachu-setts) was conducted in the range of 400−4000 cm−1for the
identification of characteristic functional groups. The specific
surface area was obtained using a Brunauer−Emmett−Teller
(BET) analysis through Quadrasorb SI, Quantachrome Instruments, Florida. For microstructural analysis, samples were distributed on aluminum stubs followed by platinum
coating through a sputter coater. A field emission scanning
electron microscopy (FE-SEM) analysis (D1627, Sirion, Eindhoven, Netherlands) was then conducted to investigate the microstructural characteristics of synthesized N-CH. Transmission electron microscopy (TEM) analysis (JEM 2100, JEOL, Japan) was conducted to determine the nanostructural characteristics of the product formed after P removal (i.e., hydroxyapatite).
■
ASSOCIATED CONTENT*
sı Supporting InformationThe Supporting Information is available free of charge at https://pubs.acs.org/doi/10.1021/acsomega.0c00993.
XRF analysis of the raw bivalve seashells used and compared with natural limestone; composition of stored unequally diluted human (male) ureolyzed urine; comparison of the observed and predicted P removal
efficiencies, resulting P efficiencies and corresponding
concentration of P removed with time (PDF)
■
AUTHOR INFORMATIONCorresponding Authors
Ji W. Ahn− Center for Carbon Mineralization, Mineral
Resources Research Division, Korea Institute of Geosciences and Mineral Resources (KIGAM), Daejeon 34132, South Korea;
orcid.org/0000-0002-8621-7483; Email:ahnjw@ kigam.re.kr
Gwang M. Kim− Center for Carbon Mineralization, Mineral
Resources Research Division, Korea Institute of Geosciences and Mineral Resources (KIGAM), Daejeon 34132, South Korea;
Email:[email protected]
Authors
Mohd D. Khan− Resources Recycling Department, University of
Science and Technology (UST), Daejeon 34113, South Korea; Center for Carbon Mineralization, Mineral Resources Research Division, Korea Institute of Geosciences and Mineral Resources (KIGAM), Daejeon 34132, South Korea
Thannaree Chottitisupawong− Department of Chemical and
Biomolecular Engineering, Korea Advanced Institute of Science and Technology, Daejeon 34141, South Korea
Hong H. T. Vu− Center for Carbon Mineralization, Mineral
Resources Research Division, Korea Institute of Geosciences and Mineral Resources (KIGAM), Daejeon 34132, South Korea Complete contact information is available at:
https://pubs.acs.org/10.1021/acsomega.0c00993 Notes
The authors declare no competingfinancial interest.
■
ACKNOWLEDGMENTSThis work was supported by the National Strategic Project-Carbon Mineralization Flagship Center of the National Research Foundation of Korea (NRF) funded by the Ministry of Science and ICT (MSIT), the Ministry of Environment (ME), and the Ministry of trade, Industry and Energy (MOTIE) (2019M3D8A2112963).
■
ABBREVIATIONSP, phosphorus; N-CH, nanocalcium hydroxide; PPhosphorus,
phosphorus removal efficiency (%); Ca−P,
calcium/phospho-rus
■
REFERENCES(1) Zhao, S.; Xiao, J.; Zheng, T.; Liu, M.; Wu, H.; Liu, Z. Highly selective and sensitive detection of PO43−ions in aqueous solution by
a luminescent terbium metal-organic framework. ACS Omega 2019, 4, 16378−16384.
(2) Heathwaite, L.; Sharpley, A. Evaluating measures to control the impact of agricultural phosphorus on water quality. Water Sci. Technol. 1999, 39, 149−155.
(3) Loganathan, P.; Vigneswaran, S.; Kandasamy, J.; Bolan, N. S. Removal and recovery of phosphate from water using sorption. Crit. Rev. Environ. Sci. Technol. 2014, 44, 847−907.
(4) Shepherd, J. G.; Sohi, S. P.; Heal, K. V. Optimising the recovery and re-use of phosphorus from wastewater effluent for sustainable fertiliser development. Water Res. 2016, 94, 155−165.
(5) Cid, C. A.; Jasper, J. T.; Hoffmann, M. R. Phosphate recovery from human waste via the formation of hydroxyapatite during electrochemical wastewater treatment. ACS Sustainable Chem. Eng. 2018, 6, 3135−3142.
(6) Dai, H.; Lu, X.; Peng, Y.; Yang, Z.; Zhu, H. Effects of supersaturation control strategies on hydroxyapatite (HAP) crystal-lization for phosphorus recovery from wastewater. Environ. Sci. Pollut. Res. 2017, 24, 5791−5799.
(7) Hutnik, N.; Kozik, A.; Mazienczuk, A.; Piotrowski, K.; Wierzbowska, B.; Matynia, A. Phosphates (V) recovery from phosphorus mineral fertilizers industry wastewater by continuous struvite reaction crystallization process. Water Res. 2013, 47, 3635− 3643.
(8) Monetti, J.; Ledezma, P.; Virdis, B.; Freguia, S. Nutrient recovery by bio-electroconcentration is limited by wastewater conductivity. ACS Omega 2019, 4, 2152−2159.
(9) Barca, C.; Gerente, C.; Meyer, D.; Chazarenc, F.; Andres, Y. Phosphate removal from synthetic and real wastewater using steel slags produced in Europe. Water Res. 2012, 46, 2376−2384.
(10) Karageorgiou, K.; Paschalis, M.; Anastassakis, G. N. Removal of phosphate species from solution by adsorption on calcite used natural adsorbent. J. Hazard. Mater. 2007, 139, 447−452.
(11) Mezenner, N. Y.; Bensmaili, A. Kinetics and thermodynamic study of phosphate adsorption on iron hydroxide-eggshell waste. Chem. Eng. J. 2009, 147, 87−96.
(12) Huang, W.; Wang, S.; Zhu, Z.; Li, L.; Yao, X.; Rudolph, V.; Haghseresht, F. Phosphate removal from wastewater using red mud. J. Hazard. Mater. 2008, 158, 35−42.
(13) Jeon, D. J.; Yeom, S. H. Recycling wasted biomaterial, crab shells, as an adsorbent for the removal of high concentration of phosphate. Bioresour. Technol. 2009, 100, 2646−2649.
(14) Khan, M. D.; Ahn, J. W.; Nam, G. Environmental benign synthesis, characterization and mechanism studies of green calcium hydroxide nano-plates derived from waste oyster shells. J. Environ. Manage. 2018, 223, 947−951.
(15) Vu, H. H. T.; Khan, M. D.; Chilakala, R.; Lai, T. Q.; Thenepalli, T.; Ahn, J. W.; Park, D. U.; Kim, J. Utilization of lime mud waste from paper mills for efficient phosphorus removal. Sustainability 2019, 11, No. 1524.
(16) Yao, Z.; Xia, M.; Li, H.; Chen, T.; Ye, Y.; Zheng, H. Bivalve shell: not an abundant useless waste but a functional and versatile biomaterial. Crit. Rev. Environ. Sci. Technol. 2014, 44, 2502−2530.
(17) FAO: Food and Agricultural Organization of the United Nations. The State of World Fisheries and Aquaculture. Contributing to Food Security and Nutrition for All; FAO: Rome, Italy, 2016.
(18) Xiong, J.; Qin, Y.; Islam, E.; Yue, M.; Wang, W. Phosphate removal from solution using powdered freshwater mussel shells. Desalination 2011, 276, 317−321.
(19) Namasivayam, C.; Sakoda, A.; Suzuki, M. Removal of phosphate by adsorption onto oyster shell powderkinetic studies. J. Chem. Technol. Biotechnol. 2005, 80, 356−358.
(20) Gu, C.; Zhang, C.; Li, Y.; Zhou, Q. Phosphorus recovery from sludge fermentation broth by cow-bone powder-seeded crystallization of calcium phosphate. Chin. J. Environ. Eng. 2015, 9, 3127−3133.
(21) Liu, C.; Huang, Y.; Shen, W.; Cui, J. Kinetics of hydroxyapatite precipitation at pH 10 to 11. Biomaterials 2001, 22, 301−306.
(22) Mahardika, D.; Park, H.-S.; Choo, K.-H. Ferrihydrite-impregnated granular activated carbon (FH@GAC) for efficient phosphorus removal from wastewater secondary effluent. Chemosphere 2018, 207, 527−533.
(23) Braun, J. C. A.; Borba, C. E.; Godinho, M.; Perondi, D.; Schontag, J. M.; Wenzel, B. M. Phosphorus adsorption in Fe-loaded activated carbon: Two-site monolayer equilibrium model and phenomenological kinetic description. Chem. Eng. J. 2019, 361, 751−763.
(24) Monneron-Gyurits, M.; Joussein, E.; Soubrand, M.; Fondaneche, P.; Rossignol, S. Valorization of mussel and oyster shells toward metakaolin-based alkaline activated material. Appl. Clay Sci. 2018, 162, 15−26.
(25) Chakrabarty, D.; Mahapatra, S. Aragonite crystals with unconventional morphologies. J. Mater. Chem. 1999, 9, 2953−2957.
(26) Ferraz, E.; Gamelas, J. A. F.; Coroado, J.; Monteiro, C.; Rocha, F. Recycling waste seashells to produce calcitic lime: Characterization and wet slaking reactivity. Waste Biomass Valorization 2019, 10, 2397−2414.
(27) Liu, T.; Zhu, Y.; Zhang, X.; Zhang, T.; Zhang, T.; Li, X. Synthesis and characterization of calcium hydroxide nanoparticles by hydrogen plasma-metal reaction method. Mater. Lett. 2010, 64, 2575−2577.
(28) Cheng, Z. H.; Yasukawa, A.; Kandori, K.; Ishikawa, T. FTIR study of adsorption of CO2 on the nanstoichiometric calcium
(29) Asikin-Mijan, N.; Taufiq-Yap, Y. H.; Lee, H. V. Synthesis of clamshell derived Ca(OH)2 nano-particles via simple
surfactant-hydration treatment. Chem. Eng. J. 2015, 262, 1043−1051.
(30) Madrid, J. A.; Lanzon, M. Synthesis and morphological examination of high-purity Ca(OH)2 nanoparticles suitable to
consolidate porous surfaces. Appl. Surf. Sci. 2017, 424, 2−8. (31) Darroudi, M.; Bagherpour, M.; Hosseini, H. A.; Ebrahimi, M. Biopolymer-assisted green synthesis and characterization of calcium hydroxide nanoparticles. Ceram. Int. 2016, 42, 3816−3819.
(32) Samanta, A.; Chanda, D. K.; Das, P. S.; Ghosh, J.; Mukhopadhyay, A. K.; Dey, A. Synthesis of nano calcium hydroxide in aqueous medium. J. Am. Ceram. Soc. 2016, 99, 787−795.
(33) Samanta, A.; Podder, S.; Ghosh, C. K.; Bhattacharya, M.; Ghosh, J.; Mallik, A. K.; Dey, A.; Mukhopadhyay, A. K. ROS mediated high antibacterial efficacy of strain tolerant layered phase pure nano-calcium hydroxide. J. Mech. Behav. Biomed. Mater. 2017, 72, 110−128. (34) Li, Y.; Xie, Q.; Hu, Q.; Li, C.; Huang, Z.; Yang, X.; Guo, H. Surface modification of hollow magnetic Fe3O4@NH2-MIL-101(Fe)
derived from metal-organic frameworks for enhanced selective removal of phosphates from aqueous solution. Sci. Rep. 2016, 6, No. 30651.
(35) Tlili, M. M.; Ben Amor, M.; Gabrielli, C.; Joiret, S.; Maurin, G.; Rousseaua, P. Study of electrochemical deposition of CaCO3 by in
situ raman spectroscopy II. Influence of the solution composition. J. Electrochem. Soc. 2003, 150, C485−C493.
(36) Cichy, B.; Kuzdzal, E.; Krzton, H. Phosphorus recovery from acidic wastewater by hydroxyapatite precipitation. J. Environ. Manage. 2019, 232, 421−427.
(37) Kaufman, H. W.; Kleinberg, I. Studies on the incongruent solubility of hydroxyapatite. Calcif. Tissue Int. 1979, 27, 143−151.
(38) Hosni, K.; Moussa, S. B.; Chachi, A.; Amor, M. B. The removal of PO43− by calcium hydroxide from synthetic wastewater:
optimization of the operating conditions. Desalination 2008, 223, 337−343.
(39) Moreno, E. C.; Gregory, T. M.; Brown, W. E. Preparation and solubility of hydroxyapatite. J. Res. Natl. Bur. Stand., Sect. A 1968, 72A, 773−782.
(40) Ansari, M.; Naghib, S. M.; Moztarzadeh, F.; Salati, A. Synthesis and characterization of hydroxyapatite-Calcium hydroxide for dental composites. Ceram.-Silik. 2011, 55, 123−126.
(41) Euler, W. B.; Kirschenbaum, L. J.; Ruekberg, B. Determination of Ksp,ΔG0,ΔH0, andΔS0. J. Chem. Educ. 2000, 77, 1039.
(42) Prakash, K. H.; Kumar, R.; Ooi, C. P.; Cheang, P.; Khor, K. A. Apparent solubility of hydroxyapatite in aqueous medium and its influence on the morphology of nanocrystallites with precipitation temperature. Langmuir 2006, 22, 11002−11008.
(43) Pourbaix, M. Establishment and Interpretation of Potential-pH Equilibrium Diagrams. In Atlas of Electrochemical Equilibria in Aqueous Solution; Muylder, J. V.; Pourbaix, M., Eds.; National Association of Corrosion Engineers: Houston, 1974; p 153.
(44) Zhang, J.; Shen, Z.; Shan, W.; Mei, Z.; Wang, W. Adsorption behavior of phosphate on lanthanum (III)-coordinated diamino functionalized 3D hybrid mesoporous silicates material. J. Hazard. Mater. 2011, 186, 76−83.
(45) Van Kemenade, M. J. J. M.; de Bruyn, P. L. A kinetic study of precipitation from supersaturated calcium phosphate solutions. J. Colloid Interface Sci. 1987, 118, 564−585.
(46) Teoh, Y. Y.; Athanassiadis, B.; Walsh, L. J. The influence of aqueous and PEG 400 solvent vehicles on hydroxyl ion release from calcium hydroxide medicaments. Int. Dent. 2016, 11, 42−50.
(47) Guidelines for Water Reuse 600/R-12/618; Environmental Protection Agency: Washington, DC, 2012.
(48) Chen, Z. F.; Darvell, B. W.; Leung, V. W. Hydroxyapatite solubility in simple inorganic solutions. Arch. Oral Biol. 2004, 49, 359−367.
(49) Levenspiel, O. Chemical Reaction Engineering; John Wiley: New York, 1972; pp 361−371.
(50) Mashifana, T.; Ntuli, F.; Okonta, F. Leaching kinetics on the removal of phosphorus from waste phosphogypsum by application of shrinking core model. S. Afr. J. Chem. Eng. 2019, 27, 1−6.
(51) Method 365.3. Phosphorus all forms (Colorimetric, Ascorbic Acid, Two Reagent); United States Environmental Protection Agency, 1978 (accessed March 14, 2019).