INTRODUCTION
Bronchiectasis is defined as a localized, irreversible dilata-tion of the bronchial tree (1). Currently, high-resoludilata-tion com-puted tomography (HRCT) is commonly used to grade sever-ity and extent in bronchiectasis (2, 3). The seversever-ity of airflow obstruction was found to be related to the extent of bronchi-ectatic segments as demonstrated on HRCT (4-6). Exten-sive bronchiectatic changes result in a restrictive defect due to a reduction in vital capacity (7), whereas productive sputum causes obstructive impairment through mucosal thickening and sputum retention (6, 8). Moreover, exacerbations of bronchiectasis precipitated by frequent infection may accel-erate the deterioration of lung function (9, 10). However, few published data are available concerning the assessment of physi-ologic status with respect to the radiphysi-ologic degree of bronchiec-tasis and a positive bacterial culture based on objective and simplified measurements (4, 11, 12). We have carried out a retrospective study on the relationship between the extent and severity on HRCT, pulmonary function and bacterio-logy in stable bronchiectasis.
MATERIALS AND METHODS
Subjects
Forty-nine patients with bronchiectasis, confirmed with HRCT, were included in the study.‘Stable’bronchiectasis was defined where symptoms of acute exacerbation were absent. Symptoms of acute exacerbation of bronchiectasis were change in sputum production, increased dyspnea, increased cough, hemoptysis, fever (body temperature, ≥37.5℃), increased wheezing, reduced lung function, radiographic changes con-sistent with a new pulmonary process, and changes in chest sounds (1, 13). Patients with secondary bronchiectasis due to post-tuberculous sequelae, patients with recent lower respi-ratory tract infection, patients with a history of significant dust exposure, and patients with pleural change or heart disease affecting lung function were excluded. The study was approved by the Ethics Committee at our hospital.
HRCT scanning
The CT scans were performed using a HiLight Advantage scanner (GE medical system, Milwaukee, WI, U.S.A.). Patients
Jin-Hwa Lee, Yoo-Kyung Kim*, Hyon-Ju Kwag*,�
, Jung-Hyun Chang
Departments of Internal Medicine and Diagnostic Radiology*, Medical Research Center, College of Medicine, Ewha Womans University, Seoul; Department of Radiology�
, Kangbuk Samsung Hospital, Sungkyunkwan University School of Medicine, Samsung Medical Center, Seoul, Korea
Address for correspondence
Jung-Hyun Chang, M.D.
Department of Internal Medicine, Ewha Womans University Mokdong Hospital, 911-1 Mokdong, Yangcheon-gu, Seoul 158-710, Korea Tel : +82.2-2650-5686, Fax : +82.2-2655-2076 E-mail : [email protected]
62
Relationships between High-Resolution Computed Tomography, Lung
Function and Bacteriology in Stable Bronchiectasis
To determine the relationship between high-resolution computed tomography (HRCT) findings, lung function, and bacteriology in bronchiectasis, we conducted a retrospec-tive study of 49 Korean patients with stable bronchiectasis. To quantify the extent and severity of bronchiectasis, we used a CT scoring system consisting of bronchial dilatation, bronchial wall thickening, the number of bronchiectatic segments, the number of bulla, and the number of emphysema segments. The presence of air-fluid levels and lung consolidation were also evaluated. The results of CT scoring, spirom-etry and sputum culture were analyzed. Patients with cystic bronchiectasis had high-er CT score, more dilated lumen and lowhigh-er forced vital capacity (FVC), forced expi-ratory volume in 1 sec (FEV1), and FEV1/FVC than patients with cylindrical
chiectasis. Patients with mixed ventilatory impairment had larger number of bron-chiectatic segments than patients with obstructive ventilatory impairment. CT score and the number of bronchiectatic segments were significantly associated with FVC and FEV1, while CT score and the number of emphysema segments were
signifi-cantly associated with FEV1/FVC. Twenty-one patients of 49 patients showed a
pos-itive sputum culture including 15 cases of Pseudomonas aeruginosa. The CT score was the most important predictor of lung function. The presence of air-fluid levels predicted bacterial colonization.
Key Words : Bronchiectasis; Tomography, X-ray Computed; Respiratory Function Tests; Bacteriology
Received : 31 July 2003 Accepted : 22 September 2003
were scanned during full suspended inspiration from the lung apex to the diaphragm, and 1.5 mm sections were obtained at 20 mm intervals. A high spatial frequency algorithm was used for image reconstruction. The high-resolution images obtained were displayed at a window level of -700 HU and at a window width of 1,500 HU, as appropriate for lung paren-chyma.
CT scoring
Two chest radiologists independently reviewed the CT scans in random order. Any differences in readings were resolved by consensus. Bronchiectasis was defined as cylindrical when the bronchial lumen had a smooth tubular outline, as varicose when the lumen had a variable diameter producing a beaded appearance, and as cystic when the dilated bronchi had the appearance of rings or clusters of cysts.
The CT scoring system, a modification of that described by Bhalla et al. (11), was used to quantify the severity and the extent of bronchiectasis. CT scoring was performed by con-sensus between two chest radiologists, consisted of bronchial dilatation, peribronchial wall thickening, the number of
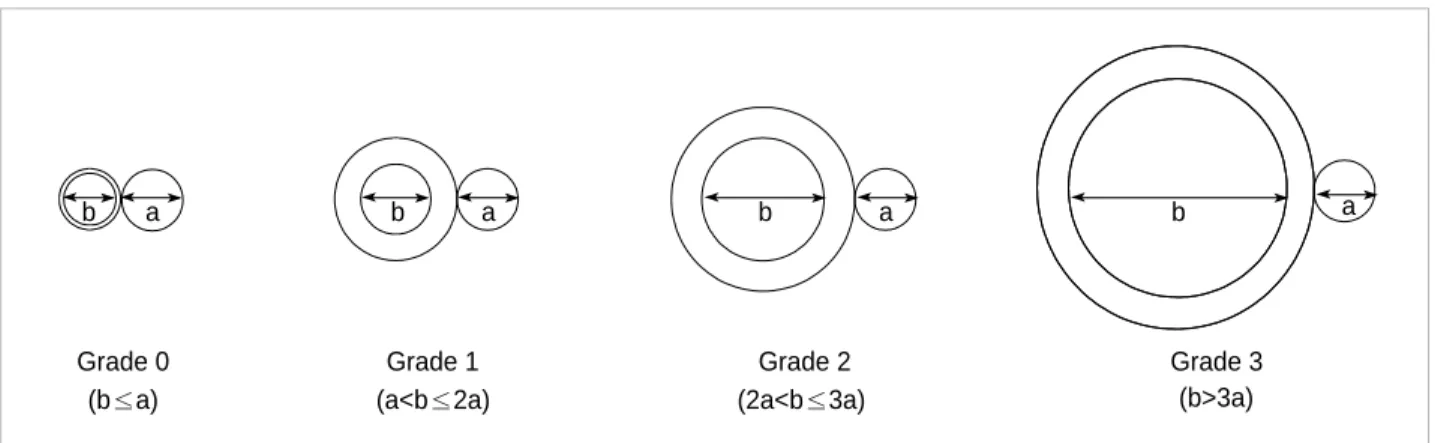
bronchiectatic segments, the number of bulla, and the num-ber of emphysema segments. Each of above five parameters was scored ordinally from 0 in the absence of a lesion through to 3 according to severity. In cases where the severity of the bronchiectasis was not uniform on any one axial scan or thro-ughout the lung zones in both lungs, scoring was based on the most frequently identified severity. The average severity of bronchial dilatation was quantified as a ratio of internal diameter of bronchus to diameter of the adjacent pulmonary arteries as follows: grade 0=no brochiectasis; grade 1=100-200% arterial diameter; grade 2=200-300% arterial diameter; grade 3=>300% arterial diameter (14, 15) (Fig. 1). Bronchial wall thickening was quantified relative to the adjacent pul-monary arteries as follows: grade 0=none; grade 1=<50% arterial diameter; grade 2=50-100% arterial diameter; grade 3=>100% arterial diameter (14, 15) (Fig. 2). The number of bronchiectatic segments was scored as follows: grade 0=none; grade 1=1-5 segments; grade 2=6-9 segments; 3=>9 segments. Each lung was considered as having 10 segments. The num-ber of bulla was scored as 1 in cases of unilateral involvement and not exceeding four lesions, 2 in cases with bilateral involve-ment but not exceeding four lesions, and 3 in cases with more
Grade 0 (b≤a)
b a b a b a b a
(a<b≤2a) (2a<b≤3a) (b>3a)
Grade 1 Grade 2 Grade 3
Fig. 1.Schematic diagram depicts four grades of bronchial dilatation scores. (a) arterial diameter, (b) internal diameter of bronchus.
Grade 0
(c≤0.5a) (0.5a<c≤a) (c>a)
Grade 1 Grade 2 Grade 3
Fig. 2.Schematic diagram depicts four grades of bronchial wall thickening scores. (a) arterial diameter, (c) bronchial wall thickness.
a c a
than four bullas. Bullae can range up to 20 cm in diameter, but are usually between 2 and 8 cm in diameter (16). There-fore when the largest diameter of a bulla exceeded 10 cm, it was counted as two in this study. Bulla has been defined as a sharply demarcated area of emphysema measuring 1 cm or more in diameter, and possessing a wall less than 1 mm in thickness (16). It can be easily distinguished from thin-walled cystic bronchiectasis, which generally has an accompanying vessel and the continuity of the dilated bronchus on adjacent scans (16). The number of emphysema segments was scored as 1 if 1 to 5 segments were involved, 2 for 6 to 9 involved segments, and 3 for cases exceeding 9 segments. Emphysema was defined as an area of low attenuation in comparison with contiguous normal lung parenchyma, with vascular disrup-tion lacking a well-defined wall or an area of low attenuadisrup-tion possessing a wall less than 1 mm thick (16). The CT score was the sum of scores of above parameters, with a highest possi-ble score of 15.
Presences of air-fluid levels and of alveolar consolidation were also evaluated.
Lung Function Tests
Spirometry was performed using the standard protocol re-commended by the American Thoracic Society (17). Lung function was measured by using the 6200 Autobox DL Pul-monary Function Laboratory from SensorMedics Co. (U.S.A.). A maximum of three measurements, taken with good patient cooperation was selected. Predicted values were calculated using the formula suggested by the European Respiratory Society (18). The degree of ventilatory impairment was based on Mor-ris’s classification (19). Obstructive ventilatory impairment is characterized by a low forced expiratory volume in 1 sec (FEV1) with relatively normal forced vital capacity (FVC). Reduction of FEV1, FVC and FEV1/FVC% indicates mixed obstructive-restrictive ventilatory impairment. The severity of ventilatory impairment was classified according to a percentage of pre-dicted normal value as follows: normal=>80%; mild=65-80%; moderate=50-64%; severe=<50% (19).
Isolation of Sputum Bacteria
Samples of spontaneous sputum were taken from all pa-tients. Early morning samples were preferred. Before collec-tion, patients received careful instruction to collect the speci-men after washing and drying their hands and rinsing their mouth well with water. After a deep cough, the sputum was placed into the provided sterile container. Until it was taken to the laboratory it was kept refrigerated, and it was taken to the laboratory as soon as possible. Only sputum samples of Murray-Washington classification degree IV or V were pro-cessed (degree IV=10-25 epithelial cells and >25 leukocytes; degree V=<10 epithelial cells and >25 leukocytes per field using a low magnification lens (×100). To isolate bacteria,
blood agar, MacConkey agar, chocolate agar, and mannitol salt agar were used. Cultures were evaluated for growth after 48 hr.
Statistical Analysis
All data are expressed as means and standard deviations or as frequencies. Statistical analysis was performed using the SPSS package (SPSS Inc, Chicago, U.S.A.). The Mann-Whit-ney test was applied for nonparametric comparisons between two groups, and the Kruskal-Wallis test was applied for non-parametric comparisons among three groups. The 2test was used to analyze categorical variables. The relationships between CT scores and pulmonary function parameters were examined using Pearson’s correlation and when appropriate, multivari-ate linear regression. To determine predictors of bacterial col-onization, logistic regression analysis was used. A p value of less than 0.05 was considered statistically significant.
RESULTS
The mean age of the 49 patients was 50 yr and 19 patients were male. There was no current smoker, and 6 were ex-smok-ers. Bronchiectasis was cylindrical in 12 patients, varicose in 2 and cystic in 35. Bacterial cultures of sputum were positive in 21 of 49 patients, and the most common pathogen was Pseudomonas aeruginosa. Mean FVC was 76% of the predicted value, FEV169%, and FEV1/FVC ratio 67%. The mean CT score was 6.1 (Table 1).
Table 2 shows the different CT scores and lung functions in cylindrical, varicose and cystic bronchiectasis. CT score (p< 0.01), dilatation of luminal diameter (p<0.01), FVC (p<0.05), FEV1(p<0.05), and FEV1/FVC (p<0.01) were significantly different in these 3 types. Moreover, patients with cystic bronchiectasis presented significantly higher CT score (p< 0.01) and luminal dilatation score (p<0.01) and lower FVC (p<0.05), FEV1(p<0.01) and FEV1/FVC (p<0.01) than patients with cylindrical bronchiectasis. However, no statistical dif-ference was found in terms of the type of pulmonary function-al impairment among these 3 types.
Thirty-four patients showed abnormal lung function: ob-structive type in 16 cases and mixed obob-structive-restrictive type in 18 cases. On comparing the CT score and its individ-ual parameters for patients with normal lung function and obstructive and mixed ventilatory impairment, CT score (p< 0.01), the number of bronchiectatic segments (p<0.01) and the number of emphysema segments (p<0.05) were signifi-cantly different. In particular, the number of bronchiectatic segments in patients with mixed-type ventilatory impairment was significantly higher than in patients with obstructive im-pairment (p<0.05) (Table 3).
Radiologic scores according to physiologic outcomes are shown in Table 4. A reduction in the lung function of patients
with obstructive ventilatory impairment was accompanied with a significant increase in the CT score (p<0.05), whereas a decrease in the lung function of patients with mixed type ventilatory impairment was accompanied with a significant
increase in the number of bronchiectatic segments (p<0.05). Table 5 shows correlations between CT scores and lung function parameters. FVC was found to be negatively corre-lated with the CT score (p<0.01), bronchial dilatation (p<0.05), bronchial wall thickening (p<0.05), the number of bron-chiectatic segments (p<0.01), and the number of emphysema segments (p<0.05). FEV1was negatively correlated with the CT score (p<0.01), bronchial dilatation (p<0.01), the num-ber of bronchiectatic segments (p<0.01), and the numnum-ber of emphysema segments (p<0.05). And, FEV1/FVC was nega-Data are mean±SD or number (%).
FVC, forced vital capacity; FEV1, forced expiratory volume in 1 sec. *CT score is defined as the sum of scores of bronchial dilatation, peribr-onchial wall thickening, the number of bronchiectatic segments, the num-ber of bulla, and the numnum-ber of emphysema segments. �
average num-ber of bronchiectatic segments.
Parameter n=49 Age (yr) 50±12 Sex: Female 30 (61%) Smoker 6 (12%) Types of bronchiectasis Cylindrical 12 (25%) Varicose 2 (4%) Cystic 35 (71%) Microbiology
Positive sputum culture 21 (43%)
Pseudomonas aeruginosa in sputum culture 15 (31%)
Lung function parameter
FVC, % predicted 76±19
FEV1, % predicted 69±25
FEV1/FVC 67±14
Radiological parameter
CT score* 6.1±1.8
No. of bronchiectatic segments�
8.7±4.6
Presence of bulla 4 (8%)
Presence of emphysema 6 (12%)
Presence of air-fluid levels 19 (39%)
Presence of consolidation 10 (20%)
Table 1.Clinical profiles of the patients in stable bronchiectasis
Date are mean±SD or number (%). *CT score as in Table 1. �
p<0.05. �
p<0.01 different each other among 3
types on Kruskal-Wallis test. �
p<0.05. ‖p<0.01 vs. cylindrical type. ¶p< 0.01 vs. varicose type on Mann-Whitney test.
Parameter Cystic (n=35) Varicose (n=2) Cylindrical (n=12) CT score*,� 3.9±1.2 5.5±0.7 6.8±1.4‖ Bronchial dilatation� 1.2±0.4 2.5±0.7� 3.0±0.0‖,¶ Bronchial wall thickening 0.8±1.0 1.0±0.0 1.2±0.8 No. of bronchiectatic segments 1.8±0.8 2.0±0.0 2.3±0.7
No. of bulla 0.1±0.3 0 0.1±0.3
No. of emphysema segments 0.2±0.4 0 0.3±0.9 Lung function parameter
FVC, % predicted�
86±17 88±13 71±18��� FEV1, % predicted� 86±22 89±20 61±24‖
FEV1/FVC� 76±9 79±4 64±14‖
Impairment of lung function
Normal 5 (42%) 1 (50%) 9 (26%)
Obstructive type 3 (25%) 0 15 (43%)
Mixed type 4 (33%) 1 (50%) 11 (31%)
Table 2.CT scores and physiologic differences according to type of bronchiectasis
Date are mean±SD or number (%). *CT score as in Table 1. �
p<0.05. �
p<0.01 different each other among 3
groups on Kruskal-Wallis test. �
p<0.05 vs. obstructive defect on
Mann-Whitney test. Normal (n=15) Obstructive Mixed defect defect (n=16) (n=18) CT score*,� 4.9 ±1.6 6.1±1.7 7.1±1.6 Bronchial dilatation 2.3±1.0 2.6±0.7 2.7±0.8 Bronchial wall thickening 0.9±0.9 1.3±0.9 1.1±0.8 No. of bronchiectatic segments�
1.6±0.6 2.1±0.6 2.6±0.7�
No. of bulla 0 0.1±0.3 0.2±0.4
No. of emphysema segments� 0 0.1
±0.3 0.6±1.2 Table 3.CT scores according to type of ventilatory impairment
Severity of ventilatory impairment is based on Morris’s classification (19). Normal means >80% of percentage of predicted normal value; mild, 65-80%; moderate, 50-64%; severe, <50%.
Date are mean±SD. *CT score as in Table 1. �
p<0.05 different each other among 3 groups
of functional impairment on Kruskal-Wallis test.
Lung function CT score* Bronchiectatic
segments
Normal Normal 15 4.9±1.6 5.3±2.5
Obstructive defect Mild 1 5�
11 Moderate 5 5.8±1.3�
9.6±4.4 Severe 10 8.0±1.0�
12.3±4.4 Mixed defect Mild 10 5.3±1.3 6.1±2.3�
Moderate 5 6.8±1.9 12.2±3.8� Severe 3 7.7±1.5 14.0±4.4�
Table 4.Radiologic scores according to physiologic outcomes
Severity No.
*CT score as in Table 1. �
p<0.05 and �
p<0.01 under Pearson’s correlation.
FEV1 (% predicted) FEV1/FVC FVC (% predicted) CT score* -0.70� -0.74� -0.63� Bronchial dilatation -0.35� -0.41� -0.36� Bronchial wall thickening -0.35�
-0.27 -0.07 No. of bronchiectatic segments -0.68� -0.70� -0.55�
No. of bulla -0.16 -0.22 -0.30�
No. of emphysema segments -0.29�
-0.33�
-0.42�
Table 5.Correlation between CT scores and lung function para-meters
tively correlated with the CT score (p<0.01), bronchial dilata-tion (p<0.05), the number of bronchiectatic segments (p<0.01), the number of bulla (p<0.05), and the number of emphyse-ma segments (p<0.05).
The factors affecting pulmonary function were further inves-tigated using multivariate linear regression with respect to CT score, and with the five CT score parameters. Parameters showing no correlation with FVC, FEV1and FEV1/FVC in Table 5 were excluded from models 1, 2 and 3, respectively. CT score and the number of bronchiectatic segments were found to be significant independent predictors of FVC and FEV1, whereas CT score and the number of emphysema seg-ments were significant independent predictors of FEV1/FVC (Table 6).
Patients with a positive bacterial culture had significantly decreased FVC (68±20% vs. 81±15%, p<0.05) and FEV1 (61±27% vs. 74±23%, p<0.05) compared to patients with a negative culture. Patients with a positive culture showed higher CT score (6.7±2.0 vs. 5.6±1.6, p<0.05) and bronchial wall thickening score (1.4±0.9 vs. 0.9±0.8, p<0.05), and higher number of bronchiectatic segments (10.1±4.8 vs. 7.6±4.2, p<0.05) than patients with a negative culture. More frequent air-fluid levels were found in patients with a posi-tive culture than in patients with a negaposi-tive culture (62% vs. 21%, p<0.05). Logistic regression analysis for FVC, FEV1, CT score, bronchial wall thickening, number of bronchiectat-ic segments, and the presence of air-fluid levels showed that the presence of air-fluid levels (p=0.42, odds ratio=5.22, 95% confidence interval 1.1 to 25.6) was the only significant inde-pendent predictor of a positive bacterial culture.
DISCUSSION
Bronchiectasis is defined pathologically as an irreversible dilatation of bronchi usually related to airway infection (20). It presents as a chronic productive cough, recurrent episodes
of infection, and hemoptysis (7). A classic sequence following airway infection is the structural destruction of lung tissues followed by functional deterioration (21). Radiological assess-ment of the degree of anatomical change may reflect pulmo-nary functional limitation (10). Since the criteria used for the diagnosis of bronchiectasis on CT scanning were first estab-lished by Naidich et al. (2) in 1982, and it became possible to identify segmental bronchi and blood vessels using CT scans (22), a novel scoring system for bronchiectasis was developed by Bhalla et al. using thin section CT in 1991 (11). However, their study was limited by the use of different scales in one scoring system. In the present study, the relationship between the morphologic changes and the pulmonary function were assessed using the same scale, and the influence of bacterial colonization in clinically stable bronchiectasis was analyzed.
Pulmonary function parameters may be normal in minimal degree of bronchiectasis (23). The severity of morphologic changes observed on HRCT influences these pulmonary func-tional parameters, and bronchiectasis of increased severity caus-es a gradual functional derangement. Previous studicaus-es empha-sized obstructive pulmonary insufficiency in bronchiectasis, related to morphologic changes (24) and bronchial respon-siveness (25). Focal stenosis and the eventual obliteration of peripheral bronchial contours, together with secretions and exudate, and associated emphysematous changes all contribute to pulmonary functional deterioration associated with obstruc-tive changes (8, 16, 26). However, irreversible structural de-struction contributes to a reduction in lung volume and ob-structive changes, which present more commonly as the mixed type (27, 28). Moreover, the extent and severity of the mor-phologic abnormalities determine the degree of volume im-pairment.
In this study, in contrast with Lynch’s study (29), no signif-icant correlations were found between cylindrical bronchiec-tasis and obstructive disease or between cystic bronchiecbronchiec-tasis and mixed disease. This may have been due to the small num-ber of cases. However, still consistent with the findings of previous studies (29, 30), patients with cystic bronchiectasis showed a reduction in the individual parameters of lung func-tion compared to patients with cylindrical bronchiectasis. Cys-tic bronchiectasis may reflect relatively late inflammatory changes, presuming its diagnosis is based on several mor-phological evidences such as more dilated bronchial lumen and higher CT score.
Patients with bronchiectasis and ventilatory impairment had significantly higher CT score and number of bronchiectat-ic segments than patients with bronchiectasis and a normal lung function. In particular, in patients with mixed ventila-tory impairment, not only were more bronchiectatic segments seen than in patients with obstructive type, but the number of bronchiectatic segments in these patients also correlated with the severity of mixed disease. These findings suggest that obstructive impairment might result from relatively early bronchiectasis pathology, while progressive bronchiectatic B, raw regression coefficient; SE, standard error.
B (SE) p value
Model 1
Dependent: FVC (% predicted)
Independent: CT score -4.27 (1.43) 0.004 No. of bronchiectatic segments -1.53 (0.58) 0.011 Model 2
Dependent: FEV1(% predicted)
Independent: CT score -6.64 (1.86) 0.001 No. of bronchiectatic segments -1.96 (0.75) 0.012 Model 3
Dependent: FEV1/FVC
Independent: CT score -4.13 (0.88) <0.001 No. of emphysema segments -0.74 (0.37) 0.049 Table 6.Predictors of pulmonary function with multivariate lin-ear regression
changes contribute to further restrictive impairment result-ing in the mixed ventilatory impairment.
In this study, FVC, FEV1and FEV1/FVC were significantly associated with the CT score. Our CT score includes elements of severity, extent, and associated findings in bronchiectasis and reflects functional changes very well because no single parameter is specific for the functional consequences of bron-chiectasis. FVC and FEV1were also associated with the num-ber of bronchiectatic segments, whereas FEV1/FVC was asso-ciated with the number of emphysema segments, suggesting that FEV1/FVC reflects an obstructive pathology, like emphy-sema, after adjusting for volume impairment more so than FEV1. Both FVC and FEV1seem to be sensitive to the extent of bronchiectasis relevant to disease severity. Although Lou-beyre et al. (24) previously showed negative correlation be-tween emphysema in HRCT and FVC, FEV1, and FEV1/FVC in bronchiectasis, no relation of the other radiologic para-meters with lung function or the significance of radiologic parameters as predictors of functional derangement was eval-uated. The impact of smoking was reported to be associated with a 15% reduction in pulmonary function in the study of Ellis et al. (21). However, the incidence of smoking in our study was too low to affect lung function.
Our bacterial colonization results in stable bronchiectasis differed from those of other studies. Several reports mainly in white patients found Hemophilus influenzae to be the predom-inant bacteria, and a recent trend toward more P. aeruginosa and less H. influenzae has been reported (31, 32). In the present study, P. aeruginosa was the outstanding microorganism, occu-pying 71% of culture-positive cases. Overuse or inappropri-ate prescription of oral antibiotics without anti-pseudomon-al activity could explain the predominance of P. aeruginosa.
Patients with colonization showed significantly lower FVC and FEV1values than non-colonized patients. Angrill et al. (30) found that reduced FEV1was a risk factor of bronchial colonization. It is unclear which is initiator for pulmonary func-tional deterioration among bronchiectasis itself and coloniz-ing bacteria. However, data showcoloniz-ing decreased lung function and/or extensive bronchiectasis in HRCT associated with the colonization of P. aeruginosa or other potentially pathogenic microorganisms are accumulating (15, 31-34). In a recent study, non-colonized patients with bronchiectasis showed a more intense bronchial inflammatory reaction than healthy controls, and patients colonized by potentially pathogenic microorganisms also exhibited an exaggerated inflammatory reaction which was found to correlate with bronchial bacte-rial load (31). Isolates of P. aeruginosa may indicate the pres-ence of underlying bronchiectasis (35), because once P. aerug-inosa infection is established in bronchiectasis by adhering to respiratory epithelial cells and following colonization, it is rarely eliminated (36, 37). Therefore, the phenomenon of chronic colonization, secondary inflammatory reaction, and progressive lung injury represents a‘vicious cycle’in bronchiec-tasis, and is the reason why the appropriate evaluation of
dis-tal airway colonization is necessary. Logistic regression anal-ysis revealed that the presence of air-fluid levels was the only significant independent predictor of bacterial colonization. Neither decreased lung function nor the other findings of HRCT were significant. Thus, the air-fluid levels can be used as a marker of active infection and as a guideline when pre-scribing antibiotics.
In our patients with stable bronchiectasis, radiologic find-ings such as cystic type, high CT score, and a large number of bronchiectatic segments were highly relevant to functional impairment. In particular, the CT score was found to be the most important predictor of FVC, FEV1, and FEV1/FVC. P.
aeruginosa was identified as the predominant colonizing teria, and the presence of air-fluid levels as a predictor of bac-terial colonization. Further studies are required to verify these clinical, functional, and radiologic relationships.
ACKNOWLEDGEMENTS
The authors thank Mi-Seon Kim, M.D, Ewha Womans Uni-versity for her assistance to analysis.
REFERENCES
1. Barker AF. Bronchiectasis. N Engl J Med 2002; 346: 1383-93. 2. Naidich DP, McCauley DI, Khouri NF, Stitik FP, Siegelman SS.
Com-puted tomography of bronchiectasis. J Comput Assist Tomogr 1982; 6: 437-44.
3. Muller NL, Bergin CJ, Ostrow DN, Nichols DM. Role of computed
tomography in the recognition of bronchiectasis. Am J Roentgenol 1984; 143: 971-6.
4. Wong-You-Cheong JJ, Leahy BC, Taylor PM, Church SE. Airways
obstruction and bronchiectasis: correlation with duration of symptoms and extent of bronchiectasis on computed tomography. Clin Radiol 1992; 45: 256-9.
5. Hansell DM, Wells AU, Rubens MB, Cole PJ. Bronchiectasis:
fun-tional significance of areas of decreased attenuation at expiratory CT. Radiology 1994; 193: 369-74.
6. Smith IE, Jurriaans E, Diederich S, Ali N, Shneerson JM, Flower CD.
Chronic sputum production: correlations between clinical features and findings on high resolution computed tomographic scanning of the chest. Thorax 1996; 51: 914-8.
7. Swartz MN. Bronchiectasis. In: Fishman AP, Elias JA, Grippi MA,
Kaiser LR, Senior RM, editors, Fishman’s pulmonary diseases and disorders. 3rd ed. New York: McGraw Hill 1998; 2045-70.
8. Cochrane GM, Webber BA, Clarke SW. Effects of sputum on
pulmo-nary function. Br Med J 1977; 2: 1181-3.
9. Perry KMA, King DS. Bronchiectasis: a study of prognosis based on
a follow-up of 400 patients. Am Rev Tuberc 1940; 41: 531-48.
10. Cherniack NS, Carton RW. Factors associated with respiratory
insuf-ficiency in bronchiectasis. Am J Med 1966; 41: 562-71.
DI, Naidich DP. Cystic fibrosis: scoring system with thin-section CT.
Radiology 1991; 179: 783-8.
12. Ip M, Lauder IJ, Wong WY, Lam WK, So SY. Multivariate
analy-sis of factors affecting pulmonary function in bronchiectaanaly-sis. Respi-ration 1993; 60: 45-50.
13. Ooi GC, Khong PL, Chan-Yeung M, Ho JCM, Chan PKS, Lee JCK, Lam WK, Tsang KWT. High-resolution CT quantification of
bron-chiectasis: clinical and functional correlation. Radiology 2002; 225: 663-72.
14. Roberts HR, Wells AU, Milne DG, Rubens MB, Kolbe J, Cole PJ, Hansell DM. Airflow obstruction in bronchiectasis: correlation
be-tween computed tomography features and pulmonary function tests. Thorax 2000; 55: 198-204.
15. Miszkiel KA, Wells AU, Rubens MB, Cole PJ, Hansell DM. Effects
of airway infection by Pseudomonas aeruginosa: a computed tomo-graphic study. Thorax 1997; 52: 260-4.
16. Webb WR, Muller NL, Naidich DP. Diseases characterized primarily
by decreased lung opacity, including cystic abnormalities, emphyse-ma, and bronchiectasis. In: Webb WR, Muller NL, Naidich DP, edi-tors, High-resolution CT of the lung. 2nd ed. Philadelphia: Lippincott-Raven Publishers 1996; 234-41.
17. American Thoracic Society. Standardization of spirometry, 1994
up-date. Am J Respir Crit Care Med 1995; 152: 1107-36.
18. Quanjer PH, Tammeling GJ, Cotes JE, Pedersen OF, Peslin R, Yer-nault JC. Lung volumes and forced ventilatory flows. Official statement
of the European Respiratory Society. Eur Respir J 1993; 16: S5-40.
19. Morris JF. Spirometry in the evaluation of pulmonary function. West
J Med 1976; 125: 110-8.
20. Reid LM. Reduction in bronchial subdivision in bronchiectasis.
Tho-rax 1950; 5: 233-47.
21. Ellis DA, Thornley PE, Wightman AJ, Walker M, Chalmers J, Crofton JW. Present outlook in bronchiectasis: clinical and social study and
review of factors influencing prognosis. Thorax 1981; 36: 659-64.
22. Osborne D, Vock P, Godwin JD, Silverman PM. CT identification of
bronchopulmonary segments: 50 normal subjects. Am J Roentgenol 1984; 142: 47-52.
23. O’Riordan T, Wanner A. Bronchiectasis. In: Baum GL, editor,
Text-book of pulmonary diseases. 6th ed. Philadelphia: Lippincott-Rave, 1998; 816-7.
24. Loubeyre P, Paret M, Revel D, Wiesendanger T, Brune J.
Thin-sec-tion CT detecThin-sec-tion of emphysema associated with bronchiectasis and correlation with pulmonary function tests. Chest 1996; 109: 360-5.
25. Bahous J, Cartier A, Pineau L, Bernard C, Ghezzo H, Martin RR, Malo JL. Pulmonary function tests and airway responsiveness to
me-thacholine in chronic bronchiectasis of the adult. Bull Eur Physiopathol Respir 1984; 20: 375-80.
26. Dail DH. Bronchial and transbronchial diseases. In: Dail DH,
Ham-mar SP, editors, Pulmonary pathology. 2nd ed. New York: Springer-Verlag 1994; 95-9.
27. Comroe JH Jr, Nadel JA. Screening tests of pulmonary function. N Engl
J Med 1970; 282: 1249-53.
28. American Thoracic Society. Lung function test: selection of reference
values and interpretative strategies. Am Rev Respir Dis 1991; 144: 1202-18.
29. Lynch DA, Newell J, Hale V, Dyer D, Corkery K, Fox NL, Gerend P, Fick R. Correlation of CT findings with clinical evaluations in 261
patients with symptomatic bronchiectasis. Am J Roentgenol 1999; 173: 53-8.
30. Nicotra MB, Rivera M, Dale AM, Shepherd R, Carter R. Clinical,
pathophysiologic, and microbiologic characterization of bronchiec-tasis in an aging cohort. Chest 1995; 108: 955-61.
31. Angrill J, Agusti C, de Celis R, Filella X, Rano A, Elena M, De La Bellacasa JP, Xaubet A, Torres A. Bronchial inflammation and
col-onization in patients with clinically stable bronchiectasis. Am J Respir Crit Care Med 2001; 164: 1628-32.
32. Angrill J, Agusti C, de Celis R, Rano A, Gonzalez J, Sole T, Xaubet A, Rodriguez-Roisin R, Torres A. Bacterial colonization in patients
with bronchiectasis: microbiological pattern and risk factors. Thorax 2002; 57: 15-9.
33. Evans SA, Turner SM, Bosch BJ, Hardy CC, Woodhead MA. Lung
function in bronchiectasis: the influence of Pseudomonas aeruginosa. Eur Respir J 1996; 9: 1601-4.
34. Ho PL, Chan KN, Ip MSM, Lam WK, Ho CS, Yuen KY, Tsang KWT.
The effect of Pseudomonas aeruginosa infection on clinical param-eters in steady-state bronchiectasis. Chest 1998; 114: 1594-8.
35. Rivera M, Nicotra MB. Pseudomonas aeruginosa mucoid strain. Its
significance in adult chest diseases. Am Rev Respir Dis 1982; 126: 833-6.
36. Woods DE, Straus DC, Johanson WG Jr, Berry VK, Bass JA. Role of
pili in adherence of Pseudomonas aeruginosa to mammalian buccal epithelial cells. Infect Immun 1980; 29: 1146-51.
37. Barghouthi S, Guerdoud LM, Speert DP. Inhibition by dextran of
Ps-eudomonas aeruginosa adherence to epithelial cells. Am J Respir Crit Care Med 1996; 154: 1788-93.