P R O C E E D I N G S
Open Access
Building the process-drug
–side effect network to
discover the relationship between biological
Processes and side effects
Sejoon Lee
1, Kwang H Lee
1, Min Song
2*, Doheon Lee
1*From Fourth International Workshop on Data and Text Mining in Biomedical Informatics (DTMBio) 2010
Toronto, Canada. 26 October 2010
Abstract
Background: Side effects are unwanted responses to drug treatment and are important resources for human phenotype information. The recent development of a database on side effects, the side effect resource (SIDER), is a first step in documenting the relationship between drugs and their side effects. It is, however, insufficient to simply find the association of drugs with biological processes; that relationship is crucial because drugs that influence biological processes can have an impact on phenotype. Therefore, knowing which processes respond to drugs that influence the phenotype will enable more effective and systematic study of the effect of drugs on phenotype. To the best of our knowledge, the relationship between biological processes and side effects of drugs has not yet been systematically researched.
Methods: We propose 3 steps for systematically searching relationships between drugs and biological processes: enrichment scores (ES) calculations, t-score calculation, and threshold-based filtering. Subsequently, the side effect-related biological processes are found by merging the drug-biological process network and the drug-side effect network. Evaluation is conducted in 2 ways: first, by discerning the number of biological processes discovered by our method that co-occur with Gene Ontology (GO) terms in relation to effects extracted from PubMed records using a text-mining technique and second, determining whether there is improvement in performance by limiting response processes by drugs sharing the same side effect to frequent ones alone.
Results: The multi-level network (the process-drug-side effect network) was built by merging the drug-biological process network and the drug-side effect network. We generated a network of 74 drugs-168 side effects-2209 biological process relation resources. The preliminary results showed that the process-drug-side effect network was able to find meaningful relationships between biological processes and side effects in an efficient manner.
Conclusions: We propose a novel process-drug-side effect network for discovering the relationship between biological processes and side effects. By exploring the relationship between drugs and phenotypes through a multi-level network, the mechanisms underlying the effect of specific drugs on the human body may be understood.
* Correspondence: min.song@njit.edu; dhlee@kaist.ac.kr
1
Bio and Brain Engineering Department, KAIST, Daejeon 305-701, South Korea
2
Information Systems Department, New Jersey Institute of Technology, University Heights, Newark, USA
Full list of author information is available at the end of the article
© 2011 Lee et al; licensee BioMed Central Ltd. This is an open access article distributed under the terms of the Creative Commons Attribution License (http://creativecommons.org/licenses/by/2.0), which permits unrestricted use, distribution, and reproduction in any medium, provided the original work is properly cited.
Background
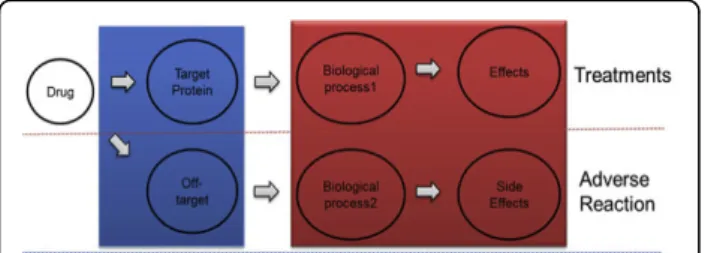
Side effects are unwanted responses to drug treatment, and they are important resources of human phenotype information. Drugs bind to target proteins and affect bio-logical processes, and the processes cause phenotype effect. However, drugs may also bind to off-target proteins, which affects other biological processes and causes adverse reactions (Figure 1). Side effects occur mainly when drugs bind to unintended off-targets. These side effects vary from simple symptoms, such as headache, to critical symp-toms, such as carcinoma. Most side effects are harmful to humans, but side effects can also be utilized to find new uses for known drugs, such as Viagra. Therefore, it is highly desirable to automatically discover new targets for known drugs and to understand the mechanisms that cause side effects for target-specific treatments.
In their paper published in Science, Campellos et al reported finding new targets based on drugs with similar side effects [1]. They used an ABC network model built with (A) drugs developed for new targets, (B) targets, and (C) side effects. Similarly, Keiser used chemical similarity to find new targets for a known drug [2]. Keiser’s approach enabled the discovery of off-targets of a known drug but did not consider the relationship between a drug and its biological process.
Like Keiser’s and Campellos’s studies, most previous research was focused mostly on finding off-target pro-teins causing the side effects. In addition, the biological processes that are affected by the drug target need to be considered because they cause phenotypical responses in the human biological system. A drug that influences biological processes can also have an impact on pheno-type. Therefore, if the biological process that responds to a drug influencing the phenotype is known then drugs pertinent to the phenotype can be studied more effectively and systematically. To date, the relationships between biological processes and side effects have not been systematically researched.
Two databases are available for studying relationships between side effects and biological processes: the connec-tivity map and side effects resource (SIDER). The con-nectivity map is developed to generate and analyze a drug-gene-disease network from large-scale experimental
gene expression responses to drugs [3]. SIDER is a recently developed database on side effects to document the relationship between drugs and side effects [4]. The connectivity map provides drug-responsive gene expres-sion information, and SIDER provides drug-side effect relationships.
By utilizing the connectivity map and SIDER, we aimed to automatically discover the relationship between biological processes and side effects by building a multi-level network of drug-biological processes influenced by the association of targets with side effects.
Figure 2 is an example of our approach. If drug 1, 2, or 3 induces the same side effect, their common response (biological process2) is potentially related to their side effect. To examine these relationships, SIDER was used to construct the drug-side effect network (Fig. 2A). SIDER provides information on the frequency of connections between drugs and side effects. The drug-side effect relationships are filtered based on the frequency of relevant information to construct a reliable drug-side effect network. The drug responsive biological process network was also constructed using drug responsive gene expression profiles (Fig. 2B).
Gene ontology (GO) terms were used for biological processes, and gene set enrichment scores (ES) were used to find which processes were upregulated or down-regulated by the drugs. Subsequently, an ABC network model was built (A, processes; B, drugs; and C, side effects) to find relationships between side effects and biological processes (Fig. 2). The results show that many processes found in the drug-process network were meaningful and were confirmed by previous studies. In addition, a novel network consisting of 168 effects and 2,209 biological processes was constructed, and these relationships based on the ABC model were also con-firmed to be significant by support from the literature. Finally, evaluations were conducted in 2 ways: first, by
Figure 1 Flow of drug treatments and adverse reaction.
Figure 2 Concept of discovering side effect-related biological processes. A: Drug-Side effect network; B: Drug-Biological processes network.
quantifying how many biological processes were found by our method and were concurrently found in GO terms with effects extracted from the PubMed records using a text-mining technique and second, whether there was an improvement in performance by limiting response processes by drugs sharing the same side effect to frequent ones alone. The experimental results showed that our process-drug-side effect network was able to reveal meaningful relationships between biological pro-cesses and side effects in an efficient manner.
In addition to comprehensive evaluation, our method contributes to systematically finding relationships between drugs and biological processes using ES scores calculations, t-score calculation, and threshold-based fil-tering. Second, side effect-related biological processes are revealed by merging the drug-biological process net-work and the drug-side effect netnet-work. Finally, data on 74 drugs, 168 effects, and 2209 biological process rela-tion resources were generated.
Datasets and methods
To discover the relationships between side effects and biological processes, 2 networks were constructed: the drug-biological process network and the drug-side effect network. Side effect and biological process relationships were automatically revealed by connecting the 2 networks.
Drug-biological process network construction
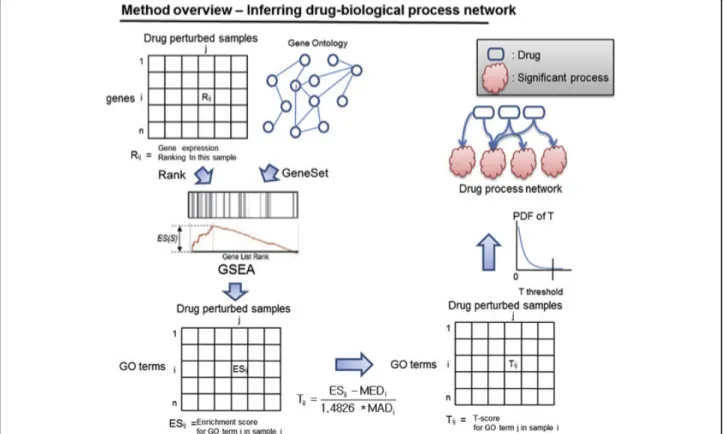
Figure 3 illustrates an overview of the approach to con-structing the process network. To find a drug-responsive biological process, gene rank information from the connectivity map and gene set information available in GO were used. The ES for each GO term was calculated to find significant terms. Subsequently, the t-score was calculated to measure the significance of each process of the drug in question. Finally, a threshold T was applied to remove insignificant data between drugs and biological processes.
Connectivity map
A connectivity map was used to construct a drug-respon-sive process database. The connectivity map is a collec-tion of genome-wide transcripcollec-tional expression data from cultured human cells treated with bioactive small molecules [3]. The connectivity map contains 6,100 expression profiles representing 1,309 compounds. The connectivity map provided rank information of probes for each sample. There were 22,283 probes and 6,100 samples in the rank matrix. Probe sets in ranked matrix were ranked in descending order of the ratio of the corre-sponding treatment-to-control values. Therefore,“top rank” means probes that are more highly upregulated than the control;“bottom rank” means probes that are more highly downregulated than the control. Top rank
genes are positively affected by drugs, and bottom rank genes are negatively affected by drugs.
Gene Ontology
GO was used as a resource for biological processes. The GO project provided term definitions representing gene product properties in 3 categories [5]: cellular compo-nent, molecular function, and biological processes
Gene Set Enrichment Analysis
Gene Set Enrichment Analysis (GSEA) was used to show the relationship of processes to drugs. GSEA is a gene expression profile analysis technique used for finding the significance of a function, pathway, or GO category [6].
In this approach, gene sets S i = {1,…,n} are defined by GO terms and ranking information of each gene L j = {1,…,k} from the connectivity map. The ESs of each gene set were calculated in 6,100 samples. ESs of upre-gulated processes were calculated based on the ranked list; ESs of downregulated processes were calculated using the reversed ranked list.
C (N-N ) N N (N-N ) if g is in geneset S if g is ij s s s s j i j = − ⎧ ⎨ ⎪ ⎪ ⎩ ⎪ ⎪ not in geneset Si [6]
Cijis defined as a summing factor of a gene gjthat is
drawn from L. N is the number of total genes in L, and Nsis the number of genes in the gene set Si.
Then the running sum Sumijfor each sample against
gene j is calculated using the following equation:
Sum C for j 1 S +C for j 2,..,k ij ij i,j-1 ij =⎧⎨⎪ == ⎩⎪
The ES for gene set i was calculated as follows:
ES sum i n i ij =arg max∈
{
}
, , 1 ES is the maximum deviation from zero of Sumij. For
a randomly distributed gene set, Si, ESiwill be relatively
small, but if it is concentrated at the top or the bottom
of the list, or otherwise non-randomly distributed, then ESiwill be correspondingly high.
Process significance calculation
A t-score was used to show the significance of each pro-cess. To get a normalized t-score robust to outliers, the ESs were standardized with the median-MAD normali-zation method for each process [7]. ESij was used to
denote an ES of process i = {1,2,…p} from sample j = {1,2,…,n}. Robust T= ES MED MAD ij i i − 1 4826. *
Both MEDi and MADi were used to represent the
median, and the median absolute deviation of enrich-ment scores for biological process i. The scale factor of 1.4826 in the above equation was used to make MADi
an estimator ofs.
Drug-side effect network construction Side effect resource (SIDER)
SIDER was developed to discover the relationships between side effects and drugs, and SIDER connects 888 drugs to 1,450 types of side effects [4]. It contains fre-quency of occurrence information between drugs and side effects for one-third of the drug-side effect pairs. (Table 1)
Drug-side effect network construction
Drug-side effect relationships available in SIDER are incomplete because side effects do not occur in gene expression data every time. Therefore, drug-side effect relationships appearing in SIDER needed to be filtered to find highly occurring relationships of gene expression data. Among the 120,598 common drug-side effect rela-tionships in SIDER, however, only 15,672 relations have a frequency higher than 5%. Most relations had no infor-mation about frequency. Twenty percent was set as a threshold of frequency to find drug-side effect relation-ships (Additional file 1). Finally, 6,197 filtered relations were used to construct the drug-side effect network.
Biological process-side effect network construction
Lastly, the biological process-side effect network was built. Figure 4 shows the method used for finding
Table 1 Examples of SIDER information
STITCHID UMLS concept ID Effect name Description of frequency Frequency score -1003 C0000737 Nausea 26% 0.26
-104741 C0010200 Cough Postmarketing 0.001 -104865 C0015230 Rash Rare 0.001 -115237 C0013604 Edema Infrequent 0.01
A search tool for Interactions of chemicals (STITCH) ID is represented as a compound ID in STITCH databases. A unified medical language system (UMLS) concept ID implies a description of frequency that consists of 4 types: postmarketing, rare, infrequent, and frequent. For frequent cases, a percentage is used instead of the word“frequent.”
relationships between side effects and biological pro-cesses. The hypothesis used was that frequent responses to drugs causing the same side effect have higher prob-abilities of correlation with a side effect than less fre-quent responses.
Connecting drug-process and drug-side effect networks
To find relationships between biological processes and side effects, drug information was used as a bridge between the 2 networks, the drug-biological process net-work and the drug-side effect netnet-work. This can be represented as an ABC model consisting of A, biological processes; B, drugs; and C, side-effects. To merge the 2 networks, the drug names needed to be normalized because the connectivity map and SIDER use different drug identification. DrugBank was used to obtain nor-malized drug information for 1,494 FDA-approved drugs. The file “drugcards.zip” was downloaded from the DrugBank [8]. Three fields, i.e., drug ID, synonym, and brand names, were used to normalize drug names between the AB network and the BC network. Because of the small number of side effects with frequency
infor-mation, only 74 drugs were included in both the AB and BC networks. Finally, using the 74 drugs with 168 effects and 2,209 processes network, data on 63,878 relationships were generated.
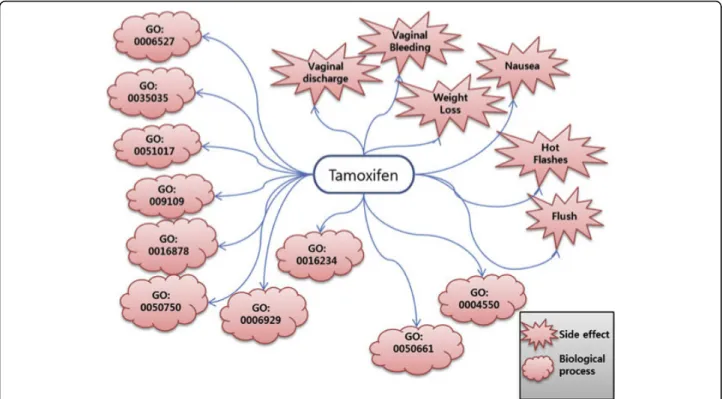
To illustrate the construction of the side effect-biolo-gical process network, the example of tamoxifen was used. Tamoxifen is one of drugs present in both the drug-process network and the drug-side effect network, and it is used as a mediator to connect the 2 networks (Figure 5).
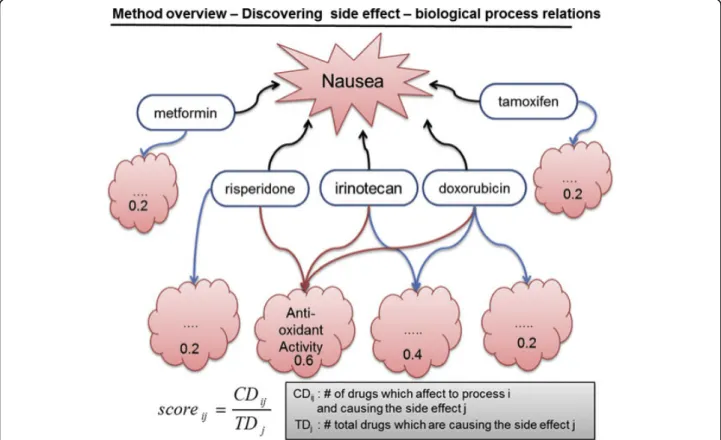
Discovering side effect-related processes from the drug-process-side effect network
Co-occurrence-based scoring was used to determine how many drugs shared the same side effect in each process. A biological process that has a high co-occur-rence score implies that the process is closely related to the targeted side effect; therefore, side effect data are only used when at least 2 drugs are related.
Scoreijwas used to denote the co-occurrence score of
a process i = {1,2,…n} in a side effect j = {1,2,…,n}. For each side effect i = {1,2,..n}, CDijis used to represent the
Figure 4 Schematic diagram for discovering side effect-biological process relationships. Nausea, which is the sensation of unease and discomfort in the stomach with an urge to vomit, is an example of a side effect. In this example, 3 of 5 drugs known to cause nausea are related to anti-oxidant activity, but the other processes were perturbed by only 1 or 2 drugs. Based on this connectivity, the scores were calculated to find possible processes causing the side effects. Finally, the processes were analyzed to ensure whether the side effect-biological process relationships revealed by this approach were meaningful.
number of drugs that have the co-occurring process i related to a side effect j, and TDjis used to represent
the number of total drugs related to the side effect j. Score CD
TD
ij= ij j
In the drug-process-side effect network, nausea is the most common side effect and is connected to 26 drugs. To investigate how many drugs with the same processes were significant, drug-side effect relations were ran-domly generated. The processes were determined by randomly selecting 74 drugs (2~26) for each side effect, repeated 1,000 times. The distribution was then deter-mined using the number of related drugs on processes, and the processes with a p-value less than 0.05 were analyzed.
Table 2 shows the total number of drugs causing side effects and how many co-occurring drugs are significant in the total number of drugs. In the case of total drugs
ranging from 2 to 5, co-significant processes in more than 2 drugs are significant to side effects.
Evaluation method
The constructed network was evaluated by examining the significance of relationships between biological pro-cesses and side effects provided by the network. The sig-nificance of relationships was measured by comparing biological processes represented by GO terms with the co-occurrence of GO terms and effect names appearing in PubMed records. The first and second steps were used to calculate the co-occurrence of effect names and GO terms. First, a set of PubMed records with an effect name was used as a query. The“[abstract/title]” qualifier was used in the PubMed search to ensure that effect names appeared in abstracts or titles. Secondly, because it is not easy to extract noun phrases from GO terms by using a simple exact string match, significant phrases were used. To this end, the following text-mining tech-niques were used: a conditional random field (CRF)-based sentence segmentation technique was used to parse abstracts [9], the sentence was tokenized with the part-of-speech (POS) technique using an extension of the Brill POS tagger [10], and noun phrase groups were extracted with a text chunking technique [11] that spe-cialized in biomedical data collections. Thirdly, the extracted noun phrases were compared with GO terms, and the number of matched phrases was stored along
Figure 5 Tamoxifen-mediated drug-process network and drug-side effect network. Tamoxifen causes six types of side effects that are reported with a frequency of greater than 20%. We found 10 significant upregulated biological processes associated with tamoxifen (p < 0.001).
Table 2 Side effect-related process threshold
Number of total drugs causing side effect
Co-occurrences (P < 0.05) 2,3,4,5 2
6,7,8,9,10,11, 12,14,15,16,17 3 19, 24, 25, 26 4
with the phrases. The comparison between extracted phrases and GO terms was based on string similarity between the 2, and the shortest path-based edit distance (SPED) technique [12] was used. The SPED technique is a variation of Markov random field-based edit distance (MRFED) and calculates the shortest path between 2 selected vertices of a graph. Various thresholds were tested for string similarities, and the threshold was set at 0.55 since it gave the best performance. Table 3 shows the number of abstracts found in PubMed and the total GO terms evaluated for rash and urinary tract infection (UTI); 2,209 GO terms were utilized to calcu-late co-occurrence scores for evaluation.
Results and discussion
The goodness of the discovered relations was confirmed using a survey of literature. First, the drug-biological process network was analyzed using the tamoxifen case study to show the significance of our method. Secondly, the ABC network model for A, processes; B, drugs; and C, side-effects was analyzed to find relationships between side effects and biological processes. Two case studies are used as examples to show the meaningful-ness of the network. Finally, the performance of the net-work was evaluated by comparing the number of matched GO terms extracted by a text-mining method that was applied to a large number of PubMed abstracts.
Drug-biological process network
The network connects 1,309 drugs to 3,629 GO terms with its ES. The GO terms are varied and some GO terms are too broad to interpret the relations; therefore, GO terms with less than 31 genes in human were cho-sen. Highly relevant GO terms with a t-score greater than 3.0 (approximately p = 0.001) were also chosen. A positive association is more upregulated than the con-trol; a negative association is more downregulated than the control.
Case study—Tamoxifen-related biological processes in the constructed network
For the case study of the drug-process network, tamoxi-fen was chosen because of its well-known mechanism. Tamoxifen is an antagonist of estrogen receptors in breast tissue [13]. We use 143th instance in connectivity map to find relationships between tamoxifen and its related processes in this case.
Table 4 shows significant processes related to tamoxi-fen in MCF7 cells (breast cancer cell line) using our
method. The most significant GO term is nucleoside diphosphate kinase activity, and Neeman’s experiments support that nucleoside diphosphate is higher in the tamoxifen-treated cells [14]. Tamoxifen also upregulates low-density lipoprotein receptor binding according to Suarez’s study [15]. These results show that biological processes in our drug-biological upregulated process relationships are meaningful in drug response profiles.
Table 5 shows that there are 6 downregulated pro-cesses for tamoxifen. Translation elongation factor activ-ity is highly related to tamoxifen in MCF-7 cells. As reported by Byun [16], translational elongation factor are underwent by tamoxifen. Cilium is known as cellular GPS, and is crucial to wound repair. For cilium, the per-ipheral loss of cilia function is reported in tamoxifen treats cell [17]. Tamoxifen reduced proteoglycan synth-esis in an in vivo study [18]. Finally, Lahoute found that tamoxifen induced a loss of serum response factor (SRF), which induces downregulation of skeletal muscle fiber development [19]. These results confirm that biolo-gical processes in the drug-biolobiolo-gical downregulated processes relationships are also meaningful in drug response profiles.
Biological process-side effect network
The biological process-side effect network contains 63,878 biological process-side effect pairs and covers a total of 168 side effects and 2,209 processes. In this
Table 4 Upregulated tamoxifen-related processes in the drug-process network
GO T-score GO term
GO:0004550 4.14835 nucleoside diphosphate kinase activity GO:0050661 3.38806 NADP or NADPH binding
GO:0016234 3.18592 inclusion body
GO:0006929 3.14893 substrate-bound cell migration GO:0050750 3.12409 low-density lipoprotein receptor binding GO:0016878 3.11266 acid-thiol ligase activity
GO:0009109 3.07065 coenzyme catabolic process GO:0051017 3.04806 actin filament bundle formation GO:0035035 3.00959 histone acetyltransferase binding GO:0006527 3.0003 arginine catabolic process
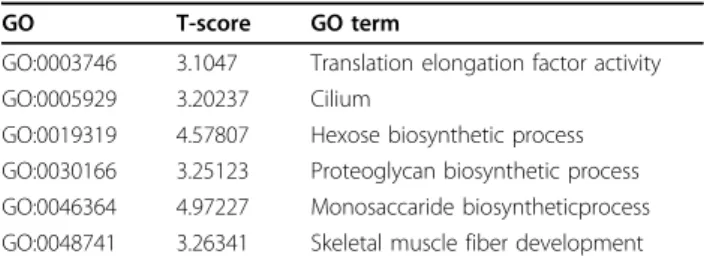
Table 5 Down regulated tamoxifen-related processes in the drug-process network
GO T-score GO term
GO:0003746 3.1047 Translation elongation factor activity GO:0005929 3.20237 Cilium
GO:0019319 4.57807 Hexose biosynthetic process GO:0030166 3.25123 Proteoglycan biosynthetic process GO:0046364 4.97227 Monosaccaride biosyntheticprocess GO:0048741 3.26341 Skeletal muscle fiber development
Table 3 Datasets for evaluation
Urinary tract infection Rash Abstracts 12,523 13,287 GO terms 2,209 2,209
network, there are 37,280 upregulated biological pro-cess-side effect pairs with a total of 168 side effects and 1,736 processes (Additional file 2). Furthermore, there are 26,598 downregulated biological process-side effect pairs, 168 side effects, and 1,430 processes (Additional file 3). Figure 6A shows the statistics of upregulated processes. To apply our algorithm, the side effects of more than 1 drug need to be considered. We finally used 119 effects and 744 processes with 4581 relations. (Figure 6)
Case study—Nausea-related biological processes in the biological processes-side effect network
In the case study of nausea, the most common cause is gastroenteritis or food poisoning, but nausea also fre-quently occurs as a medication side effect. Nausea is connected to 26 drugs in the drug-side effect network. For random sampling analysis, a score greater than or equal to 0.15 was considered significant (p < 0.05).
Table 6 shows 3 upregulated processes related to nausea. For example, Yoneyama et al found that adenosine deami-nase activity (ADA) was related to hyperemesis gravi-darum (vomiting and nausea) [20]. Chemotherapeutic agents induce oxidative damage in the gastrointestinal tract, causing nausea and vomiting; therefore, upregulated antioxidant activity is needed to reduce oxidative damages [21]. Also, nausea occurs when blood sugar rises rapidly [22], and the cellular carbohydrate catabolic process is noted for increasing the blood sugar level in the body.
Table 7 shows downregulated processes that are related to nausea. In human studies, treatment with cytokines is often accompanied by nausea [23]. Synaptic vesicle endo-cytosis may subsequently be used for neurotransmitter storage [5]. Neurotransmitters are also involved in relay-ing messages of nausea and vomitrelay-ing [24].
Case study—Anemia-related biological processes in the biological processes-side effect network
Anemia is known as deficiency of hemoglobin, which is a molecular substance inside red blood cells. As hemo-globin transfers oxygen from lungs to the tissues, ane-mia makes hypoxia in tissues. Aneane-mia is connected to 10 drugs in the drug-side effect network. A random sampling analysis score greater than or equal to 0.3 was considered significant (p < 0.05).
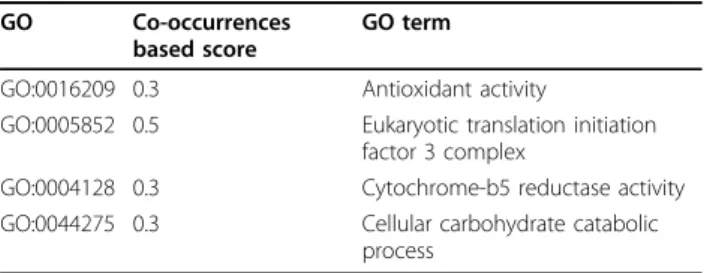
Table 8 shows anemia-related upregulated processes. Cytochrome b5 reductase is an enzyme in the blood. This enzyme regulates the iron in red blood cells and helps the oxygen transportation. Therefore, cytochrome b5 reductase is highly related to anemia. Antioxidant activity of blood serum is highly related to anemia [25]. Anemia search results are similar to those of nausea (GO:0016209, GO:0044275) because 8 of 10 drugs causing anemia also cause nausea.
Table 9 shows downregulated processes related to anemia. Regulation of cytokine production during immune response was related to anemia in a previous study [26]. Iron deficiency induces anemia and neuro-transmitter deficiency. Synaptic vesicle endocytosis may subsequently be used for neurotransmitter storage [5]. Downregulated activity of synaptic vesicle endocytosis induces neurotransmitter deficiency.
Evaluation result
Two different side effects, i.e., rash, and UTI, were used for evaluation by retrieving PubMed records for each side effect and calculating the co-occurrence scores for each
Figure 6 Network statistics in drug upregulated biological process-side effect network. Figure 6A shows the relationship between side effects and the total number of connected drugs in upregulated processes. The range of the total number of drugs is 1 to 26. It shows that 49 side effects occurred with only 1 drug, and 26 drugs caused nausea. Figure 6B shows that most scores of relations (about 88%) are less than 0.5. Half of relation scores are less than 0.2. Further, only 543 relation scores are greater than or equal to 0.5. This means that many significant processes are not over-represented among drugs. Therefore, a threshold needs to be determined to show which processes are highly related to which side effect (Table 2).
Table 6 Nausea-related upregulated processes
GO Co-occurrence score
GO term GO:0019239 0.19 Deaminase activity GO:0016209 0.19 Antioxidant activity
GO:0044275 0.19 Cellular carbohydrate catabolic process
GO term. Figure 7 shows the co-occurrence scores for each GO term for 2 cases. To evaluate the significance of discovered biological processes, the top 10%, 20%, 30%, 40%, and 50% scores in the distribution were selected, as shown in Figure 7. This threshold was used to examine the significance of the processes in each top n%.
Figure 8 shows the number of matched terms between our approach and the results of the text-mining method for GO terms extracted from PubMed.
For rash, our method showed 116 GO-related terms. Of 116 processes, 13 were found in the top 10% of the text-mining results, 25 processes were found in the top 20% of the results, 36 processes were found in the top 30% of the results, 55 processes were found in the top 40% of the results, and 64 processes were in the top 50% of the results. For UTI, our method shows 76 GO-related terms. Of 76 processes, 8 were found in the top 10% of the results, 13 were found in the top 20% of the results, 23 were found in the top 30% of the text-mining results, 35 were found in the top 40% of the results, and 45 processes were in the top 50% of the results.
It was assumed that more frequent responsive pro-cesses to drugs causing the same side effect have higher probabilities of correlation with a side effect than less frequent responsive processes. The hypothesis was tested with rash and UTI cases. In Figure 9A, the rash2 bar (blue) includes less frequent response processes, and the rash3 bar (red) includes only significant frequent response processes. For the rash2 bar, we found 100 related processes. Eleven processes (11%) were found in the top 10% of the text-mining results, 21 (21%) were in the top 20% of the results, 30 (30%) were in the top 30% of the results, 48 (48%) were in the top 40% of the results, and 55 processes (55%) were in the top 50% of
the results. The rash3 bar shows 16 significant frequent response processes by drugs. Two processes (13%) were in the top 10%, 4 (25%) were in the top 20%, 6 (38%) were in the top 30%, 7 (44%) were in the top 40%, and 9 processes (56%) were in the top 50%. For all results, except 40%, rash3 performs better than rash2 in terms of the proportion of processes discovered over the top n ranked processed (Fig. 9A).
In Figure 9B, the UTI2 bar (blue) includes less fre-quent response processes, and the UTI3 bar (red) only includes significant frequent response processes. For the UTI2 bar, our method found 73 related processes. Seven processes (10%) were found in the top 10%, 11 (15%) were found in the top 20% of the results, 21 (29%) were found in the top 30%, 33 (45%) were found in the top 40%, and 42 processes (58%) were found in the top 50%. As indicated by the UTI3 bar, our method found 3 fre-quent response processes by drugs. One process (33%) was found in the top 10%, 2 processes (67%) in the top 20%, 30%, and 40%, and 3 processes (100%) in the top 50% of the results. This shows that UTI3 performed bet-ter than UTI2 in all 5 cases (Fig. 9B) and confirms that our method was able to find relationships between bio-logical processes and side effects.
Conclusions
In this paper, we proposed a new approach for automati-cally discovering relationships between biological pro-cesses and side effects using the co-occurrence based multi-level network. We built the drug-biological process network, and showed that our method can be used to dis-cover drug related significant processes (as shown in the example of tamoxifen). In addition, we built an ABC Model (using A, biological processes; B, drugs; and C, side effect information) for 74 drugs, 168 side effects, and 2,209 biological processes. A literature analysis confirmed that relations between side effects and biological processes found by co-occurrence were meaningful. In addition, our method was evaluated using a text-mining technique to extract co-occurring GO terms with effects. The results showed that our method is efficient and useful for finding relationships between biological processes and side effects.
In a future study, the scoring scheme will be improved because the current scoring algorithm considers all drugs equally regardless of the number of side effects or the number of biological processes associated with them. For
Table 7 Nausea-related downregulated processes
GO Co-occurrences score
GO term
GO:0002718 0.15 Regulation of cytokine production during immune response GO:0046631 0.15 Alpha-beta T-cell activation GO:0070410 0.15 Co-SMAD binding
GO:0016863 0.15 Intramolecular oxidoreductase activity GO:0048488 0.15 Synaptic vesicle endocytosis
Table 8 Anemia related up-regulated processes
GO Co-occurrences based score
GO term GO:0016209 0.3 Antioxidant activity
GO:0005852 0.5 Eukaryotic translation initiation factor 3 complex
GO:0004128 0.3 Cytochrome-b5 reductase activity GO:0044275 0.3 Cellular carbohydrate catabolic
process
Table 9 Anemia related down-regulated processes
GO Co-occurrences score
GO term GO:0070410 0.3 Co-SMAD binding
GO:0002718 0.3 Regulation of cytokine production during immune response GO:0048488 0.3 Synaptic vesicle endocytosis
Figure 7 Literature-based co-occurrence score distribution of 2 side effects. Top 20 processes are omitted in this graph because of range problem.
Figure 8 The number of processes matched with text-mining results for rash, and UTI. The x axis is the top n% of co-occurred GO terms with biological processes (total 2,209). The y axis is the number of processes with scores greater than the top n% (x axis) threshold of the total process scores.
Figure 9 Evaluation of our hypothesis for rash and UTI. The x axis is the top n% for the total process scores. The y axis is percentage of processes with scores greater than the top n% (x axis) threshold of the total processes scores.
example, drug A has only 1 side effect (s-1), whereas drug B has 2 side effects (s1 and s2), with all other settings the same, including association with biological process (p). In this case, drug A provides more reliable information on the association of s1and p than drug B. However, the pro-posed scoring scheme cannot reflect this, thus causing a loss of information for a more accurate association. We also plan to investigate whether biological processes related to side effects are valuable resources in elucidating the mechanism of drug effects. Instead of using the text-mining technique, a manual evaluation will be conducted to identify undiscovered relationships from process-side effect pairs that are not mentioned in literature. In addi-tion, we are interested in a research on personalized drug responsive expression data by applying multi-level net-works for personalized medicine. By exploring the rela-tionship between drugs and phenotypes on the multi-level network, we will be able to understand the mechanisms underlying drug involvement in the human body.
Additional material
Additional file 1: This file contains common drug names and related side effect names which are reported with frequency of greater than 20% from SIDER. First Column: Drug Bank ID Second Column: Drug name Third Column: Effect ID ( UMLS Concept ID) Fourth Column: Effect name.
Additional file 2: This file contains up_regulated processes (T-score > 3.0) and related effects. First Column: Effect ID ( UMLS Concept ID) Second Column: Process ID ( Gene Ontology ID) Third Column: The number of drugs which affect to process and causing the side effect. Fourth Column: Total drugs which are causing the side effect.
Additional file 3: This file contains down_regulated processes (T-score > 3.0) and related effects. First Column: Effect ID ( UMLS Concept ID) Second Column: Process ID ( Gene Ontology ID) Third Column: The number of drugs which affect to process and causing the side effect. Fourth Column: Total drugs which are causing the side effect.
Acknowledgements
This work was supported by the Korean Systems Biology Research Project (20100002164), the World Class University program (R32-2008-000-10218-0) and the Basic Research Laboratory grant (2009-0086964) of the Ministry of Education, Science and Technology through the National Research Foundation of Korea. It was also supported by the Korea Institute of Science and Technology Information (KISTI).
This article has been published as part of BMC Bioinformatics Volume 12 Supplement 2, 2011: Fourth International Workshop on Data and Text Mining in Bioinformatics (DTMBio) 2010. The full contents of the supplement are available online at http://www.biomedcentral.com/1471-2105/12? issue=S2.
Author details
1Bio and Brain Engineering Department, KAIST, Daejeon 305-701, South
Korea.2Information Systems Department, New Jersey Institute of
Technology, University Heights, Newark, USA. Authors’ contributions
LS designed the method and drafted the manuscript along with MS. MS also critically revised the manuscript for important intellectual content. KHL
and DL supervised the work and gave final approval of the version of the manuscript to be submitted.
Competing interests
The authors declare that they have no competing interests. Published: 29 March 2011
References
1. Campillos M, Kuhn M, Gavin AC, Jensen LJ, Bork P: Drug target
identification using side-effect similarity. In Science. Volume 321. New York, NY; 2008:(5886):263-266.
2. Keiser MJ, Setola V, Irwin JJ, Laggner C, Abbas AI, Hufeisen SJ, Jensen NH, Kuijer MB, Matos RC, Tran TB, et al: Predicting new molecular targets for known drugs. Nature 2009, 462(7270):175-181.
3. Lamb J, Crawford ED, Peck D, Modell JW, Blat IC, Wrobel MJ, Lerner J, Brunet JP, Subramanian A, Ross KN, et al: The Connectivity Map: using gene-expression signatures to connect small molecules, genes, and disease. In Science. Volume 313. New York, NY; 2006:(5795):1929-1935. 4. Kuhn M, Campillos M, Letunic I, Jensen LJ, Bork P: A side effect resource to
capture phenotypic effects of drugs. Molecular systems biology 6:343. 5. Ashburner M, Ball CA, Blake JA, Botstein D, Butler H, Cherry JM, Davis AP,
Dolinski K, Dwight SS, Eppig JT, et al: Gene ontology: tool for the unification of biology. The Gene Ontology Consortium. Nature genetics 2000, 25(1):25-29.
6. Subramanian A, Tamayo P, Mootha VK, Mukherjee S, Ebert BL, Gillette MA, Paulovich A, Pomeroy SL, Golub TR, Lander ES, et al: Gene set enrichment analysis: a knowledge-based approach for interpreting genome-wide expression profiles. Proceedings of the National Academy of Sciences of the United States of America 2005, 102(43):15545-15550.
7. Wu B: Cancer outlier differential gene expression detection. Biostatistics 2007, 8(3):566-575.
8. Wishart DS, Knox C, Guo AC, Cheng D, Shrivastava S, Tzur D, Gautam B, Hassanali M: DrugBank: a knowledgebase for drugs, drug actions and drug targets. Nucleic Acids Res 2008, 34:D901-6.
9. Lafferty J, McCallum A, Pereira F: Condition random fields: probabilistic models for segmenting and labeling sequence data. Proc. 18th International conf. on Machine Learning 282-289.
10. Brill E: A simple rule-based part of speech tagger. HLT’91 Proceeding of the workshop on speech and Natural Language 1992, 112-116.
11. Phan X: CRFChunker: CRF English Phrase Chunker. 2006 [http://crfchunker. sourceforge.net/].
12. Rudniy A, Song M, Geller J: Detecting Duplicate Biological Entities Using Path Edit Distance. International Journal of Data Mining and Bioinformatics 2010.
13. Hodges LC, Cook JD, Lobenhofer EK, Li L, Bennett L, Bushel PR, Aldaz CM, Afshari CA, Walker CL: Tamoxifen functions as a molecular agonist inducing cell cycle-associated genes in breast cancer cells. Mol Cancer Res 2003, 1(4):300-311.
14. Neeman M, Degani H: Metabolic studies of estrogen- and tamoxifen-treated human breast cancer cells by nuclear magnetic resonance spectroscopy. Cancer research 1989, 49(3):589-594.
15. Suarez Y, Fernandez C, Gomez-Coronado D, Ferruelo AJ, Davalos A, Martinez-Botas J, Lasuncion MA: Synergistic upregulation of low-density lipoprotein receptor activity by tamoxifen and lovastatin. Cardiovascular research 2004, 64(2):346-355.
16. Byun HO, Han NK, Lee HJ, Kim KB, Ko YG, Yoon G, Lee YS, Hong SI, Lee JS: Cathepsin D and eukaryotic translation elongation factor 1 as promising markers of cellular senescence. Cancer research 2009, 69(11):4638-4647. 17. Kesterson RA, Berbari NF, Pasek RC, Yoder BK: Utilization of conditional
alleles to study the role of the primary cilium in obesity. Methods in cell biology 2009, 94:163-179.
18. Rosner IA, Malemud CJ, Hassid AI, Goldberg VM, Boja BA, Moskowitz RW: Estradiol and tamoxifen stimulation of lapine articular chondrocyte prostaglandin synthesis. Prostaglandins 1983, 26(1):123-138.
19. Lahoute C, Sotiropoulos A, Favier M, Guillet-Deniau I, Charvet C, Ferry A, Butler-Browne G, Metzger D, Tuil D, Daegelen D: Premature aging in skeletal muscle lacking serum response factor. PloS one 2008, 3(12): e3910.
20. Yoneyama Y, Sawa R, Suzuki S, Otsubo Y, Araki T: Serum adenosine deaminase activity in women with hyperemesis gravidarum. Clinica
chimica acta; international journal of clinical chemistry 2002, 324(1-2):141-145.
21. Wang CZ, Fishbein A, Aung HH, Mehendale SR, Chang WT, Xie JT, Li J, Yuan CS: Polyphenol contents in grape-seed extracts correlate with antipica effects in cisplatin-treated rats. In Journal of alternative and complementary medicine. Volume 11. New York, NY; 2005:(6):1059-1065. 22. Ezrin C, Salter JM, Ogryzlo MA, Best CH: The Clinical and Metabolic Effects
of Glucagon. Can Med Assoc J 1957, 78(2):3.
23. Kronfol Z, Remick DG: Cytokines and the brain: implications for clinical psychiatry. The American journal of psychiatry 2000, 157(5):683-694. 24. Hesketh PJ: Chemotherapy-induced nausea and vomiting. The New
England journal of medicine 2008, 358(23):2482-2494.
25. Levina AA, Andreeva AP, Tsvetaeva NV, Tsibul’skaia MM, Minaeva LM, Tokarev Iu N: [Antioxidant activity of blood serum amd erythrocytes in patients with refractory anemia]. Gematologiia i transfuziologiia 1991, 36(7):11-14.
26. Morceau F, Dicato M, Diederich M: Pro-inflammatory cytokine-mediated anemia: regarding molecular mechanisms of erythropoiesis. Mediators of inflammation 2009, 2009:405016.
doi:10.1186/1471-2105-12-S2-S2
Cite this article as: Lee et al.: Building the process-drug–side effect network to discover the relationship between biological Processes and side effects. BMC Bioinformatics 2011 12(Suppl 2):S2.
Submit your next manuscript to BioMed Central and take full advantage of:
• Convenient online submission
• Thorough peer review
• No space constraints or color figure charges
• Immediate publication on acceptance
• Inclusion in PubMed, CAS, Scopus and Google Scholar
• Research which is freely available for redistribution
Submit your manuscript at www.biomedcentral.com/submit

![Table 7 shows downregulated processes that are related to nausea. In human studies, treatment with cytokines is often accompanied by nausea [23]](https://thumb-ap.123doks.com/thumbv2/123dokinfo/5076271.73090/8.892.455.807.990.1095/table-downregulated-processes-related-studies-treatment-cytokines-accompanied.webp)