저작자표시-비영리-변경금지 2.0 대한민국 이용자는 아래의 조건을 따르는 경우에 한하여 자유롭게 l 이 저작물을 복제, 배포, 전송, 전시, 공연 및 방송할 수 있습니다. 다음과 같은 조건을 따라야 합니다: l 귀하는, 이 저작물의 재이용이나 배포의 경우, 이 저작물에 적용된 이용허락조건 을 명확하게 나타내어야 합니다. l 저작권자로부터 별도의 허가를 받으면 이러한 조건들은 적용되지 않습니다. 저작권법에 따른 이용자의 권리는 위의 내용에 의하여 영향을 받지 않습니다. 이것은 이용허락규약(Legal Code)을 이해하기 쉽게 요약한 것입니다. Disclaimer 저작자표시. 귀하는 원저작자를 표시하여야 합니다. 비영리. 귀하는 이 저작물을 영리 목적으로 이용할 수 없습니다. 변경금지. 귀하는 이 저작물을 개작, 변형 또는 가공할 수 없습니다.
Master’s Thesis in Molecular Medicine
Identification of novel genetic variants
associated with precocious puberty
by genome-wide association analysis
in Korean girls
Ajou University Graduate School
Major in Molecular Medicine
Department of Biomedical Sciences
Identification of novel genetic variants
associated with precocious puberty
by genome-wide association analysis
in Korean girls
Hyon J. Kim, Advisor
Seon-Yong Jeong, Advisor
I submit this thesis as the
Master’s thesis in Molecular Medicine.
February 2019
Ajou University Graduate School
Major in Molecular Medicine
Department of Biomedical Sciences
The Master's thesis of Gijeong Kim in Molecular Medicine
is hereby approved.
Thesis Defense Co-Committee President
Ajou University Graduate School
December 24th, 2018
– Abstract –
Identification of novel genetic variants associated with precocious
puberty by genome-wide association analysis in Korean girls
Precocious puberty results from the activation of the hypothalamus-pituitary-gonadal axis at an early stage, which lead to the secretion of gonadotrophin-releasing hormone (GnRH) and can lead to physical and psychological problems such as loss of adult height, breast cancer, type 2 diabetes, and depression. Precocious puberty is caused by both genetic and environmental factors. Early diagnosis is very important for the effective treatment of the disease, because highly effective drugs are available for its treatment. The use of genetic biomarkers of precocious puberty might be a good solution could enable its early diagnosis.
Although several genes, such as KISS1, KISS1R, and MKRN3 are known to be involved in precocious puberty, no genetic variants associated with precocious puberty have been identified yet using a genome-wide association study (GWAS).
To identify genetic biomarker(s) for the early diagnosis of precocious puberty, I analyzed the genotype and clinical data of 696 Korean girls with precocious puberty and 300 Korean age-matched normal controls.
After performing a case-control GWAS, I found eight genetic variants that are significantly associated with precocious puberty (p < 1.0 × 10⁻⁵), viz., rs10900855
(OR = 2.21 and p = 1.10 × 10⁻⁸), rs13187637 (OR = 2.006 and p = 7.07 × 10⁻⁷),
rs373629 (OR = 0.5839 and p = 1.94 × 10⁻⁶), rs3849046 (OR = 1.959 and p = 2.24 ×
10-6), rs56252016 (OR = 0.1212 and p = 3.48 × 10⁻⁶), rs62579679 (OR = 2.493 and
p = 3.66 × 10⁻⁶), rs4680885 (OR = 0.4638 and p = 6.41 × 10⁻⁶), and rs4891764 (OR
= 0.5933 and p = 8.66 × 10⁻⁶). The most significant SNP, rs10900855, exhibited a p-
value at the GWAS-level of significance (p ≤ 5.0 × 10⁻⁸) and an extremely high OR
value.
By annotating and performing a signal plot analysis of the identified SNPs, I found that the SNPs were closely located to six genes: EGR1, HSPA9, ETF1, MAGI2, MPPED2, and DOK6. The gene expression patterns of the six genes in the hypothalamus tissue of female mice indicated a significant increase (EGR1) or a
significant decrease (HSPA9, ETF1, MAGI2, MPPED2, and DOK6) in levels during the puberty period. In silico pathway analysis revealed that all six genes are closely associated with precocious puberty via two (EGR1) or three nodes (HSPA9, ETF1, MAGI2, MPPED2, and DOK6).
These results indicate that the SNPs identified in these six genes were also closely associated with precocious puberty in girls.
Keywords: precocious puberty, girl, early diagnosis, genetic biomarker, genetic
variants, single nucleotide polymorphism (SNP), genome-wide association study
(GWAS), gene expression, hypothalamus, gonadotrophin-releasing hormone
TABLE OF CONTENTS
ABSTRACT ··· i TABLE OF CONTENTS ··· ⅳ LIST OF FIGURES ··· ⅵ LIST OF TABLES ··· ⅷ I. INTRODUCTION ··· 1II. MATERIALS AND METHODS ··· 8
A. Subject ··· 8
B. DNA extraction and quality check ··· 8
C. SNP Genotyping ··· 9
D. Mouse tissue preparation ··· 10
E. RNA extraction and cDNA synthesis ··· 10
F. Quantitative RT-PCR analysis ··· 11
G. Network analysis ··· 11
III. RESULTS ··· 14
A. Establishment of a study cohort for analyzing precocious puberty in Korean girls ··· 14
B. Genome-wide association study in Korean cohort for precocious puberty ··· 16
C. Candidate-gene association analysis of the previously identified genes ··· 26
D. Gene expression patterns of the six identified genes during the puberty period in female mouse tissues ··· 28
E. Gene expression patterns of previously known genes during the puberty period in female mouse tissues ··· 43
F. Network analysis ··· 48
IV. DISCUSSION ··· 53
V. CONCLUSION ··· 58
REFERENCES ··· 59
LIST OF FIGURES
Figure 1. Schematic representation of the hypothalamic-pituitary-gonadal (HPG)
axes ··· 6
Figure 2. Tanner stages in girls and boys ··· 7
Figure 3. Quantile-quantile plot and Manhattan plot of genome-wide association
study (GWAS) for precocious puberty in Korean girls ··· 17
Figure 4. Signal plots for the eight selected SNPs ··· 22
Figure 5. mRNA expression pattern of Egr1 during the puberty period in female
mouse tissues ··· 31
Figure 6. mRNA expression pattern of Hspa9 during the puberty period in female
mouse tissues ··· 33
Figure 7. mRNA expression pattern of Etf1 during the puberty period in female
mouse tissues ··· 35
Figure 8. mRNA expression pattern of Magi2 during the puberty period in female
Figure 9. mRNA expression pattern of Mpped2 during the puberty period in
female mouse tissues ··· 39
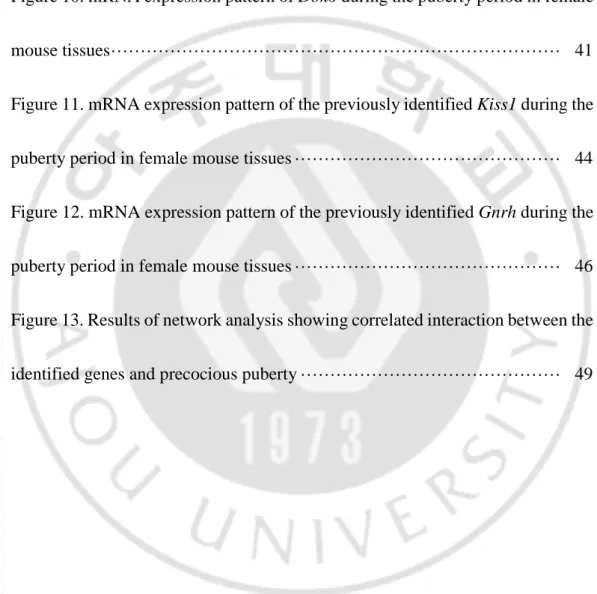
Figure 10. mRNA expression pattern of Dok6 during the puberty period in female
mouse tissues ··· 41
Figure 11. mRNA expression pattern of the previously identified Kiss1 during the
puberty period in female mouse tissues ··· 44
Figure 12. mRNA expression pattern of the previously identified Gnrh during the
puberty period in female mouse tissues ··· 46
Figure 13. Results of network analysis showing correlated interaction between the
LIST OF TABLES
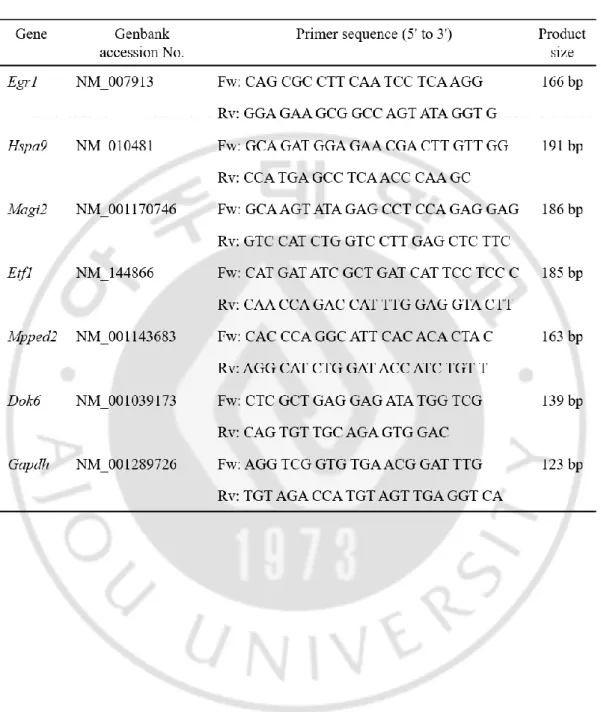
Table 1. primer sequences used in this study ··· 13
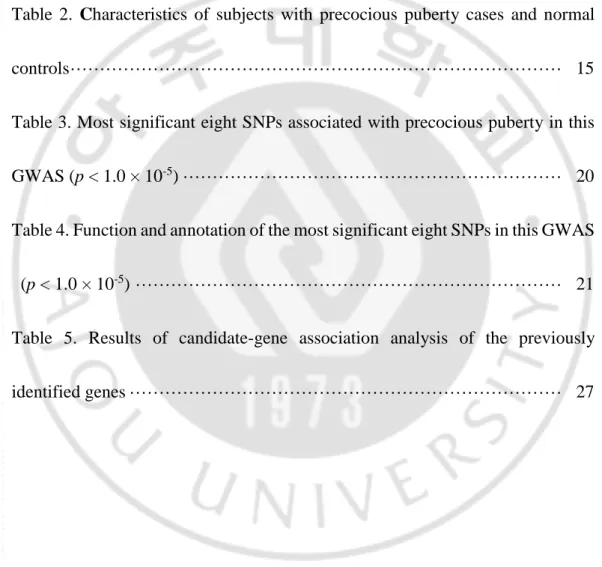
Table 2. Characteristics of subjects with precocious puberty cases and normal
controls ··· 15
Table 3. Most significant eight SNPs associated with precocious puberty in this
GWAS (p < 1.0 × 10⁻⁵) ··· 20 Table 4. Function and annotation of the most significant eight SNPs in this GWAS
(p < 1.0 × 10⁻⁵) ··· 21 Table 5. Results of candidate-gene association analysis of the previously
I. INTRODUCTION
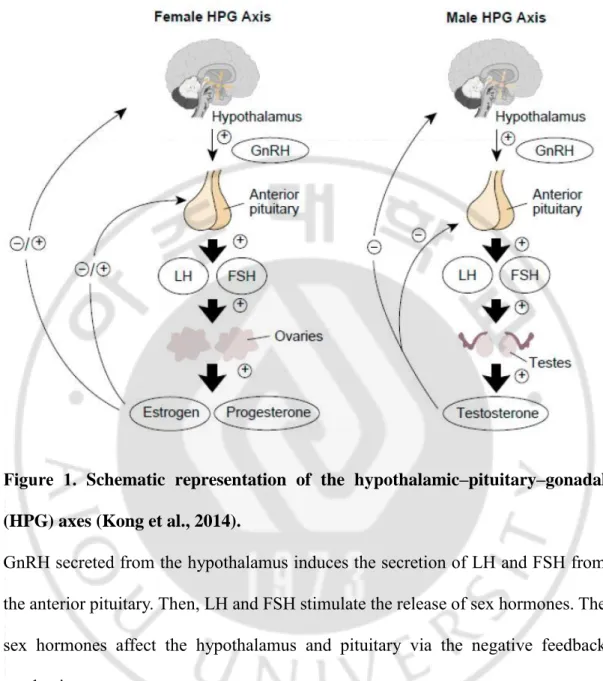
Puberty is a period during which physical as well as psychological changes occur, secondary sexual characteristics are developed, and reproductive ability is achieved (Choi and Yoo, 2013). It is initiated by the secretion of the gonadotrophin-releasing hormone (GnRH) from the hypothalamus. GnRH regulates the hypothalamic-pituitary-gonadal (HPG) axis and stimulates the release of gonadotrophins, luteinizing hormone (LH) and follicle stimulation hormone (FSH), from the pituitary gland (Figure 1) (Kong et al., 2014). The onset of puberty is determined by the development of secondary sexual characteristics, which are characterized by Tanner stage 2 breast development in girls and the presence of more than 4 ml testicular volume in boys (Figure 2). Precocious puberty is defined as the occurrence of these secondary sexual characteristics in girls younger than 8 years and boys younger than 9 years (Abreu et al., 2013). Precocious puberty results mainly from the early activation of the hypothalamus-pituitary-gonadal axis, which leads to pulsatile GnRH secretion. GnRH-dependent precocious puberty (GDPP) is also known as central precocious puberty (CPP).
Both environmental and genetic factors play an important role in precocious puberty. The environmental factors affecting precocious puberty include nutrients, geographic locations, chronic diseases, stressful events, pollution, interfamilial relationships, frequent infectious diseases, exposure to endocrine-disrupting
chemicals (EDCs), and rapid body weight gain (Parent et al., 2003; Parent et al., 2005; Phillip and Lazar, 2005; Den Hond and Schoeters, 2006; Matchock and Susman, 2006; Gajdos et al., 2009). Although environmental factors are critical for precocious puberty, it has been estimated that 50-80% of precocious puberty cases are influenced by genetic factors(Palmert and Boepple, 2001; Kaminski and Palmert, 2008; Oh et al., 2017). Precocious puberty is affected by race, family history, and genes such as KISS1, KISS1R, MKRN3 etc. (Parent et al., 2003; de Vries et al., 2004; Abreu et al., 2013; Bulcao Macedo et al., 2014). It is well-known that the KISS1/KISS1R system controls the release of GnRH (Seminara et al., 2003; Colledge, 2009). Kiss1 in the Kiss1 neurons at the hypothalamus encodes several kisspeptins, which bind to the G-protein coupled receptor, GPR54, which is encoded by KISS1R. Kisspeptin stimulates GnRH neurons, resulting in the secretion of GnRH (Dungan et al., 2006). If an individual has a family history of precocious puberty, it is inherited through an autosomal dominant mode, with incomplete penetrance (de Vries et al., 2004).
Precocious puberty can result in many diseases, such as breast cancer, endometrial cancer, type 2 diabetes, obesity, and cardiovascular disease (Elks et al., 2010). Several studies have found proof of the fact that it affects the loss of adult height (Carel et al., 2004). Precocious puberty also affects a psychological aspect. Affected teenagers might experience negative psychological and social outcomes and especially girls are three times more at risk for depression and anxiety than their
peers, who experience puberty on time (Tremblay and Frigon, 2005). It is known that precocious puberty is 10 times more frequent in girls than in boys (Carel and Leger, 2008). The reason is probably because girls have a higher level of kisspeptin, which stimulates the release of GnRH at each Tanner stage (Aguirre and Eugster, 2018). Recently, the incidence of precocious puberty has been increasing worldwide (Lee et al., 2001; Parent et al., 2003). This trend is also observed in Korea. According to the Health Insurance Review and Assessment Service, the number of children diagnosed with precocious puberty has increased more than twelve times in the last 10 years in Korea.
At present, precocious puberty is diagnosed by physical examination, bone age checking, and hormone analysis via the GnRH stimulation test (Houk et al., 2008). Precocious puberty is defined as the onset of Tanner stage 2 or above secondary sexual characteristics including breast or pubic hair development before age 8 years in girls, and the patients also have advanced bone age than their chronologic age by at least 1 year. To conduct the GnRH stimulation test, a GnRH analogue has been used as a substitute for GnRH, because the use of GnRH is inefficient (Houk et al., 2008). The serum gonadotropin level increases in response to GnRH stimulation. The luteinizing hormone (LH) level in serum is primarily used to diagnose precocious puberty. After GnRH is injected, the serum LH level is measured at intervals of 15 to 30 minutes for 2 hours. If the highest concentration of LH (peak LH level) is greater than 5IU/L, the HPG axis is determined to have been activated.
Precocious puberty is confirmed when all three diagnostic criteria are met. However, the current diagnostic methods have several disadvantages. Physical development is difficult to distinguished from the obesity (Nam et al., 2012). Checking advanced bone age might be not observed in the early stages of precocious puberty. In addition, it takes a long time to carry out the GnRH stimulation test, because several blood samples need to be obtained and GnRH is administered to the patient intravenously. Sometimes, even if the test has a high specificity, the test has to be conducted several times, because of its low sensitivity. Several genes responsible for causing it are known but have not been used for diagnosis yet. Sensitive biomarkers of precocious puberty can enable its early diagnosis and treatment.
The standard method of treating precocious puberty is to administer an injection of GnRH agonist (GnRHa), which suppresses the secretion of LH and FSH by negative feedback, when it is injected for a long time (Lee et al., 2001). GnRHa is known to have the effect of slowing down puberty progression (Aguirre and Eugster, 2018). The main goal of precocious puberty treatment is to preserve adult height; hence, the timing of treatment is important. The early initiation of treatment can improve the final height (Pasquino et al., 1999).
Although several studies indicate that the puberty timing is affected by race, (Parent et al., 2003) there are few studies regarding precocious puberty in Korean children. According to studies in Korean girls, KISS1 and its encoded protein kisspeptin were both found to have an impact on central precocious puberty (Ko et
al., 2010; Rhie et al., 2011; Rhie et al., 2014). However, MKRN3, which is well known for causing precocious puberty, was presented at a low frequency in Korean girls (Lee et al., 2016; Jeong et al., 2017). In addition, studies are being conducted to identify the causes of precocious puberty in Koreans, such as obesity and serum isoflavone. However, the enrollment of low numbers of subjects is one of the limitations of these studies. To find suitable biomarker candidates for Korean children, clinical information and genetic database regarding Koreans are needed. Therefore, the goals of the present study were to identify novel genetic variant(s) associated with precocious puberty in Koreans through a cohort study.
In this study, 969 Korean girls were recruited, and I tried to identify the genetic variants that were significantly associated with the precocious puberty status by performing a case-control genome-wide association study (GWAS). In addition, to verify the significance of the identified genetic variants, I further investigated changes in gene expression changes during the puberty period in female mice, and performed in silico pathway analysis of the genes in which the identified SNPs were located.
Figure 1. Schematic representation of the hypothalamic–pituitary–gonadal (HPG) axes (Kong et al., 2014).
GnRH secreted from the hypothalamus induces the secretion of LH and FSH from the anterior pituitary. Then, LH and FSH stimulate the release of sex hormones. The sex hormones affect the hypothalamus and pituitary via the negative feedback mechanism.
Figure 2. Tanner stages in girls and boys (Carel and Leger, 2008).
(A) Breast development and pubic hair growth in girls. (B) Genital development and pubic hair growth in boys. Genital development is characterized by a change in the size of the scrotum and testis and in the texture, and a reddening of the scrotal skin. Stage 2 marks the onset of pubertal development.
II. MATERIALS AND METHODS
A. Subject
The case subjects included 669 Korean girls with precocious puberty. The 669 subjects were recruited at the department of Pediatrics, Ajou University Hospital in Suwon, Korea. The inclusion criteria were, as follows: (1) girl appeared early breast development before 8 years old, (2) the bone age advancement at least 1 year ahead of their chronological age; and (3) the luteinizing hormone (LH) values higher than the cut-off value of 5 IU/L. The control subjects included 300 normal Korean girls, who were recruited from among volunteers that had experienced menarche after the age of 12 years. This study was approved by the Institutional Review Board of Ajou University Hospital, and written, informed consent was obtained from all subjects.
B. DNA extraction and quality check
The DNA was extracted from whole blood samples of subjects using the ExgeneTM Blood Kit (GeneAll, Seoul, Korea). All DNA samples were amplified and randomly portioned into 25-125 bp fragments, which were then purified, re-suspended, and hybridized on Axiom Genome-Wide Human Array Plates following hybridization; the bound target was washed under stringent conditions to remove non-specific background, for minimizing the noise resulting from random ligation events. I performed DNA quantification using the Qubit and DNA qualification using
Nanodrop; UV absorbance 260/280 and 260/230. The quality of the all DNA samples was further confirmed by agarose gel electrophoresis.
C. SNP genotyping
DNA samples were genotyped using an Axiom Precision Medicine Research Array (Affymetrix, Santa Clava, CA, USA), which contained a total of 902,527 SNPs, according to the manufacturer’s instructions. The array provides genome-wide coverage in five major populations as well as imputation accuracy for GWAS markers 0.90 and 0.94 with minor allele frequencies (MAFs) > 1% and > 5% for 7.4 million imputed markers in Asian population. The quality control procedures were performed for each of the 902K SNPs, before conducting the association tests. The SNP set was filtered based on the genotype call rates (≥ 0.98) and MAFs (≥ 0.005). The Hardy-Weinberg equilibrium (HWE) was calculated for individual SNPs using an exact test. All the SNPs reported in this manuscript demonstrated HWE p-values > 0.05. After filtering, 434,437 polymorphic SNPs were analyzed on chromosome 1 through chromosome 22, and 6,416 and 816 SNPs in chromosome X and Y, respectively, were analyzed.
D. Mouse tissue preparation
Animal research procedures were approved by the Animal Care and Use Committee of the Ajou University School of Medicine. All animal experiments complied with the ARRIVE guidelines and were carried out in accordance with the National Institutes of Health guide for the care and use of laboratory animals (NIH Publications No. 8023, revised 1978).
Tissues for RNA and protein analyses were isolated from Institute of Cancer Research (ICR) mice (Daehan Biolink Co., Korea) at postnatal day 10, 15, 22, 26, 30, and 36, based on their pubertal development (Abreu et al., 2013; Li et al., 2018). Tissue samples were kept frozen in the TRIzol Reagent (Ambion, USA). The tissues chosen were associated with puberty development, and included hypothalamus, pituitary, uterus, ovary, and fat tissues (Brown et al., 2008; Sultan et al., 2018). As an exception, fat tissues were not isolated on day 10, because their amount was too low.
E. RNA extraction and cDNA synthesis
RNA was extracted from mouse tissues by using the TRIzol Reagent (Ambion, USA) and RNeasy Mini Kit (Qiagen, Germany) according to the manufacturer’s instructions. Reverse transcription of 100 ng of total RNA was performed using the RevertAid First Strand cDNA synthesis Kit (Thermo scientific, USA) with a random primer and oligo hexamer primer and cDNA was diluted tenfold. The purity and
concentration of mRNA and cDNA were measured using a spectrophotometer (Colibri Microvolume Spectrophotometer, Titertek-Berthold, Germany).
F. Quantitative RT-PCR analysis
The gene expression level was determined by quantitative real-time PCR using the Rad CFX connect Real-Time system (Rad Laboratories, USA) and Bio-Rad CFX Maestro™ (version 1.0). The reaction mixture contained TB green™ Premix Taq™ (Tli RNaseH Plus) (TaKaRa, Japan) and 100 ng cDNA with a final volume of 10 μl. All samples were tested in duplicate using the following protocol: 95 °C for 5 min, followed by 50 cycles at 95 °C for 5 sec, 60 °C for 30 sec, and 72 °C for 20 sec. The PCR products were subjected to a melting curve analysis to confirm the specificity of amplification. The expression of each gene was normalized using glyceraldehyde-3-phosphate dehydrogenase (Gapdh) and quantified using the comparative threshold (CT) method. The mRNA level at day 10 was used as a control and that at day 15 was used only for fat tissues. Each experiment was performed twice. The sequences of the gene specific primers used were described in Table 1.
G. Network analysis
The network association between the precocious puberty and each gene (EGR1, HSPA9, ETF1, MAGI2, MPPED2, and DOK6) was analyzed using the Ingenuity Pathway Analysis (IPA) software (QIAGEN). The biological pathways of the genes
are represented as nodes that denote the transporter, ion channel, peptidase, etc. The relationships are showed as lines that indicate the occurrence of direct or indirect interactions between nodes.
H. Statistical analysis
Most statistical analyses were performed using PLINK version 1.9 and the SPSS program. XX phenotypes were tested by linear regression analysis with an additive model after adjustment for age. P-values were not adjusted for multiple tests. Statistical significance was determined if the value of p < 0.0001 or if there were functional associations. Statistical analyses of the quantitative RT-PCR results were performed by the Student’s t-test. Statistical significance was assumed when *p < 0.05, **p < 0.01, ***p < 0.001. In the experimental studies, all the experiments were repeated independently at least three times, unless stated otherwise, and the results were presented as the mean ± standard deviation (SD) values, as indicated. Multiple groups were compared using a one-way analysis of variance (ANOVA), followed by the Tukey’s honest significant difference (HSD) post hoc test for the correction of multiple comparisons.
III. RESULT
A. Establishment of a study cohort for precocious puberty in Korean girls
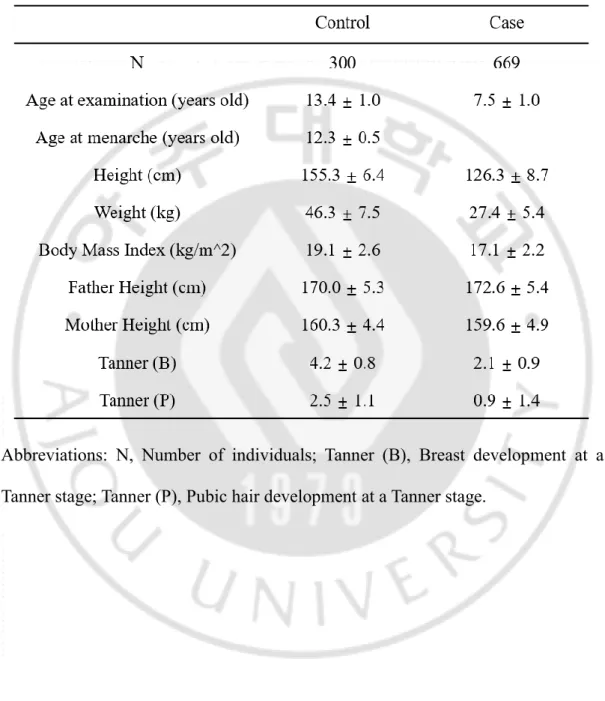
A total of 969 Korean girls were involved in this study. Their characteristics are described in Table 2. The case subjects included 669 girls with precocious puberty, and they had an average age of 7.5 years old. They already exhibited Tanner stage 2 breast development and Tanner stage 0.9 pubic hair. The control subjects consisted of 300 girls who had undergone puberty at a normal time and had an average age of 13.4 years; they had experienced menarche at an average age of 12.3 years. The subjects in the case group were diagnosed with precocious puberty. Despite their young age, they exhibited the Tanner stage 2 breast development.
Table 2. Characteristics of study subjects with precocious puberty and normal controls.
Abbreviations: N, Number of individuals; Tanner (B), Breast development at a Tanner stage; Tanner (P), Pubic hair development at a Tanner stage.
B. Genome-wide association study in Korean cohort for precocious puberty
The SNPs were plotted on a Quantile-Quantile plot (Q-Q plot), based on the observed p-values of the SNPs to expected p-values, under null distribution, and on the Manhattan plot against the chromosomal positions (Figure 3). The Q-Q plot showed a significant deviation in the tail, which implied that SNPs were associated with the precocious puberty (Figure 3A). In the Manhattan plot, 7 SNPs exhibited a suggested significance (p < 1 × 10⁻⁵), and 1 SNP exhibited genome-wide significance
Figure 3. Quantile-quantile plot and Manhattan plot of the genome-wide association study (GWAS) for precocious puberty in Korean girls.
(A) Quantile-quantile plot for precocious puberty. (B) All the black and grey dots indicate the individual single nucleotide polymorphisms (SNPs) on their physical chromosomal positions (horizontal axis), and their –log10 (p-values) in the GWAS
(vertical axis). The red line indicates the GWAS p-values (< 5 × 10⁻⁸) and the blue
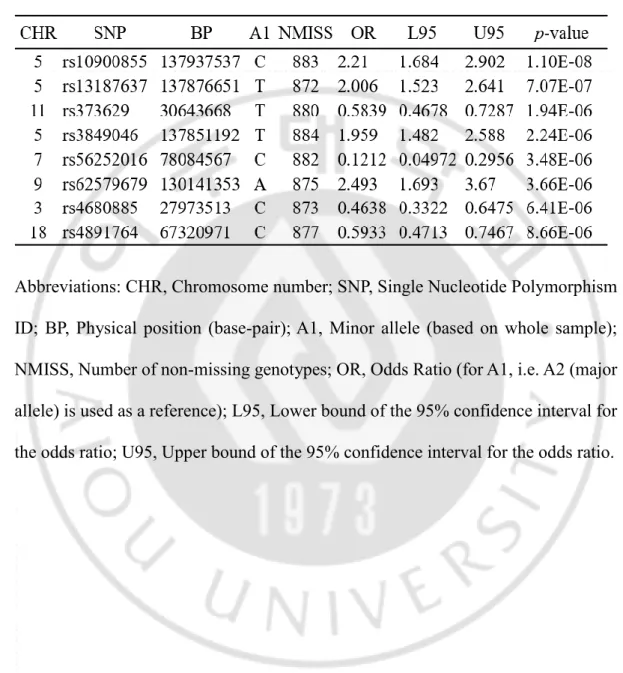
A total of 902,527 SNPs were genotyped using an Axiom Precision Medicine Research Array (Affymetrix, Santa Clava, CA, USA). The following eight SNPs showed the most significant p values in the GWAS and are indicated in Table 3: rs10900855 (OR = 2.21 and p = 1.10 × 10⁻⁸), rs13187637 (OR = 2.006 and p = 7. 07
× 10-7), rs373629 (OR = 0.5839 and p = 1.94 × 10⁻⁶), rs3849046 (OR = 1.959 and p
= 2.24 × 10⁻⁶), rs56252016 (OR = 0.1212 and p = 3.48 × 10⁻⁶), rs62579679 (OR =
2.493 and p = 3.66 × 10⁻⁶), rs4680885 (OR = 0.4638 and p = 6.41 × 10⁻⁶) and
rs4891764 (OR = 0.5933 and p = 8.66 × 10⁻⁶). The SNP rs10900855 had the most
significant p-value (1.1 × 10⁻⁸) and all SNPs showed an extremely high or low odds
ratio (OR) (Table 3).
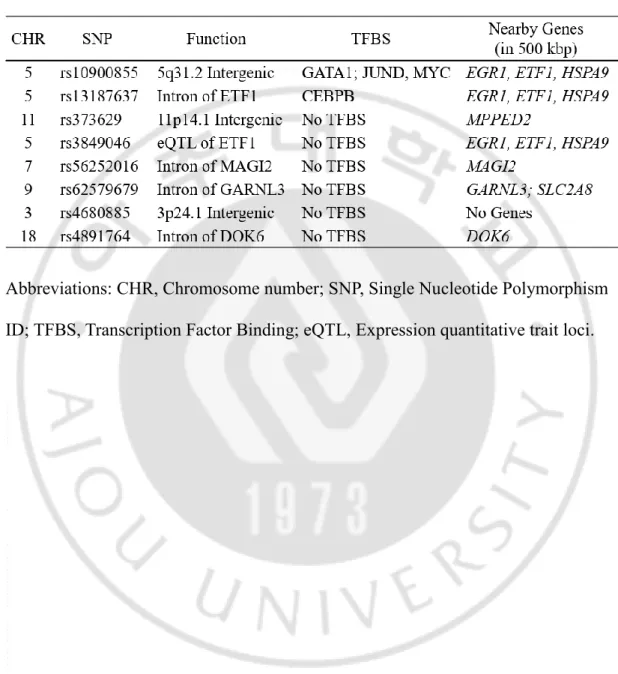
Annotation and signal plots of the most significant eight SNPs are shown in Table 4 and Figure 4. Three SNPs (rs10900855, rs13187637, and rs3849046) are located near EGR1, ETF1, and HSPA9 on chromosome 5 (Table 4 and Figure 4A). The SNP rs13187637 is located in the intron of ETF1 and rs3849046 is present especially at the expression quantitative trait loci (eQTL) (Table 4). The SNP rs373629 is located near MPPED2 on chromosome 11 and rs56252016 is located in the intron of MAGI2 on chromosome 7 (Figure 4B, C, Table 4). The SNP rs4891764 exists in the intron of DOK6 on chromosome 18 (Figure 4D, Table 4). Because rs4680885 and rs62579679 did not match with the genes located nearby (Figure 4E, F), I selected six SNPs for further studies.
Table 3. Most significant eight SNPs associated with precocious puberty in this GWAS (p < 1.0 × 10⁻⁵).
Abbreviations: CHR, Chromosome number; SNP, Single Nucleotide Polymorphism ID; BP, Physical position (base-pair); A1, Minor allele (based on whole sample); NMISS, Number of non-missing genotypes; OR, Odds Ratio (for A1, i.e. A2 (major allele) is used as a reference); L95, Lower bound of the 95% confidence interval for the odds ratio; U95, Upper bound of the 95% confidence interval for the odds ratio.
Table 4. Function and annotation of the most significant eight SNPs in this GWAS (p < 1.0 × 10⁻⁵).
Abbreviations: CHR, Chromosome number; SNP, Single Nucleotide Polymorphism ID; TFBS, Transcription Factor Binding; eQTL, Expression quantitative trait loci.
Figure 4. Signal plots of the eight selected SNPs.
Upper panel; the p-value (Y-axis) and chromosome position (X-axis) of SNPs are plotted. The selected SNPs are labeled with arrows. The other SNPs are colored according to the heat scale, based on the r2 values, to reflect their linkage
disequilibrium (LD) with the top above SNP. Lower panel; gene annotations are described. The direction of the transcripts is shown using arrows. The SNPs in chromosome 5 (A), chromosome 11 (B), chromosome 7 (C), chromosome 18 (D), chromosome 3 (E), and chromosome 9 (F) are shown.
C. Candidate-gene association analysis of the previously identified genes
A few genes such as KISS1, KISS1R, MKRN3 etc. are known to cause precocious puberty. I performed candidate-gene association analysis to confirm the significance of these genes in our subjects. I analyzed nine genes: KISS1, KISS1R (Krstevska-Konstantinova et al., 2014), MKRN3 (Schreiner et al., 2014), ESR1, ESR2 (Mendoza et al., 2008), CYP21A2 (Ghizzoni et al., 2011), HSD3B2 (Chu et al., 2009), CYP19A1 (Lee et al., 2014), and IRS1 (Xin et al., 2006). The significances of five of these genes was identified (Table 5). KISS1 was significantly associated with 1 of 10 SNPs (p = 0.02909) and KISS1R was also significantly associated with 1 of 8 SNPs (p = 0.03164). In the case of ESR1, 6 of 100 SNPs were significantly associated with precocious puberty (p = 0.04173, p = 0.02444, p = 0.01468, p = 0.02444, p = 0.01468 and p = 0.02978, respectively). CYP19A1 exhibited 2 SNPs that showed a significant association, out of a total of 31 SNPs (p = 0.04964, and p = 0.01412, respectively). IRS1 exhibited 1 SNP for which the p-value was 0.04668, of 23 SNPs. These results suggest that our subjects were suitable for the precocious puberty study. MKRN3, ESR, CYP21A2, HSD3B2, and NR3C1 haves 10, 8, 5, 6, and 14 SNPs, respectively, in PMRA, but none of them showed a significant association with subjects with precocious puberty.
Table 5. Results of candidate-gene association analysis of the previously identified genes.
CHR, Chromosome number; SNP, SNP ID; BP, Physical position (base-pair); A1, Minor allele (based on whole sample); OR, Odds Ratio (for A1, i.e. A2 (major allele) is reference);
D. Gene expression patterns of the six identified genes during the puberty period in female mouse tissues.
Next, I investigated the expression patterns of identified genes during the puberty period in female mouse tissues: hypothalamus, pituitary, uterus, ovary, and fat (N=4). Puberty in female mice is mediated by the secretion of kisspeptin and gonadotropin-releasing hormone (GnRH) within a duration of three to four weeks (Mayer et al., 2010). I examined the mRNA expression levels in tissues during the puberty period at days 22, 26, and 30. I also analyzed values obtained on other days against the mRNA level on day 10, which was used as the control. The expression levels of Egr1 were significantly increased at days 26 and 30 (p < 0.0001) in hypothalamus (Figure 5A). In pituitary, the expression levels of Egr1 were increased substantially at day 15 but decreased at day 22. The expression level was increased again at days 26 and 30 (Figure 5B). In the uterus, the lowest mRNA level was observed during the expression of Egr1 at day 22 (p < 0.0001) and it gradually increased until day 36 (Figure 5C). In the ovary, the expression levels of Egr1 were decreased with a similar tendency that was observed in the uterus (Figure 5D). In fat tissues, the mRNA levels of Egr1 were the highest at days 26 and 30 (p < 0.001) (Figure 5E).
In the hypothalamus, the expression of Hspa9 was significantly decreased at day 26 (p < 0.0001) (Figure 6A). On the other hands, the expression in the pituitary was significantly increased only at days 26 and 30, unlike that in the hypothalamus (Figure 6B). In the uterus, the mRNA expression was decreased at days 22 and 30 (p
< 0.0001 and p < 0.05, respectively) (Figure 6C). The mRNA levels for Hspa9 in the ovary were the lowest at day 22, after which they increased (p < 0.0001) (Figure 6D). In fat tissues, the mRNA level was decreased overall and tended to decrease even further at days 22 and 30 (Figure 6E).
There was an overall decrease in the expression of Etf1 in the hypothalamus. Its mRNA level had a significance that was lower than 0.001 at day 15 and that lower than 0.0001 from days 22 to 36 (Figure 7A). In the pituitary, the mRNA level of Etf1 was slightly increased at days 15, 22, 26, and 30 (< 0.05) (Figure 7B). In the uterus, the mRNA expression of Etf1 was decreased at days 22 and 30 (p < 0.0001 and p < 0.05, respectively) (Figure 7C). There was no significant expression of Etf1 in the ovary (Figure 7D). The expression of Etf1 in fat tissues was increased at day 26, decreased at day 30, and increased again at day 36 (Figure 7E).
In the case of Magi2, the mRNA levels in the hypothalamus were significantly decreased overall (p < 0.0001 from days 15 to 30, p < 0.001 at day 36) (Figure 8A). The expression of Magi2 was decreased from days 22 to 30 in the pituitary (p < 0.0001) (Figure 8B). In the uterus, its mRNA level was decreased at days 22 and 26 (p < 0.01, 0.05, respectively) and sharply increased at day 36 (p < 0.01) (Figure 8C). In the ovary, mRNA levels of Magi2 were the lowest at day 22, after which they increased (Figure 8D). The expression of Magi2 was increased at day 26, decreased at day 30, and increased again at day 36 (Figure 8E).
overall at days 15 and 36, in a manner similar to that for Magi2 (p < 0.0001 at days 15, 22, and 30, p < 0.001 at days 26 and 36) (Figure 9A). In the pituitary, its mRNA level was decreased over all the days, as observed in the hypothalamus (p < 0.05 at days 15 and 22, p < 0.001 at days 26 to 36) (Figure 9B). The expression of Mpped2 was decreased substantially in the uterus (p < 0.0001) (Figure 9C). In the ovary, the mRNA level of Mpped2 was decreased at day 15 (p < 0.5) and the highest mRNA level was observed at day 26 (p < 0.01) (Figure 9D). There was no significant expression of Mpped2 observed in fat tissues (Figure 9E).
In the case of Dok6, its mRNA level was decreased on all days in the hypothalamus (p < 0.0001 from days 15 to 30, p < 0.001 at day 36) (Figure 10A). In the pituitary, the expression of Dok6 was significantly decreased at days 26 and 30 (p < 0.0001) (Figure 10B). In the uterus, the mRNA expression of Dok6 was decreased at days 22 and 30 (p < 0.0001) and increased again at day 36 (p < 0.05) (Figure 10C). The expression of Dok6 was dramatically decreased on all days in the ovary (p < 0.05 at day 15 and p < 0.0001 from days 22 to 36) (Figure 10D). In fat, its expression was significant at days 26 and 36 (p < 0.0001) (Figure 10E).
These results suggest the genes affecting puberty in various tissues. In the hypothalamus, the mRNA levels of Egr1 were increased during puberty, whereas the mRNA levels of Etf1, Magi2, Mpped2, and Dok6 were decreased during puberty. The changes in the expression of these genes in the hypothalamus, pituitary, uterus, ovary, and/or fat of Korean children could lead to precocious puberty.
Figure 5. mRNA expression pattern of Egr1 during the puberty period in female mouse tissues.
mRNA was extracted from mouse tissues by the number of days concerned and reverse transcribed. The mRNA levels of Egr1 were measured by quantitative real-time PCR. Results are expressed as the fold stimulation over the mRNA level observed on day 10 or 15 each and presented as mean values of two independent experiments, each performed with duplicate samples. (A) Hypothalamus. (B) Pituitary. (C) Uterus. (D) Ovary, (E) Fat. *p-value < 0.05, **p-value < 0.01,
***p-Figure 6. mRNA expression pattern of Hspa9 during the puberty period in female mouse tissues.
mRNA was extracted from mouse tissues by the number of days concerned and reverse transcribed. The mRNA levels of Hspa9 were measured by quantitative real-time PCR. Results are expressed as the fold stimulation over the mRNA level observed on day 10 or 15 each and presented as mean values of two independent experiments, each performed with duplicate samples. (A) Hypothalamus. (B) Pituitary. (C) Uterus. (D) Ovary, (E) Fat. *p-value < 0.05, **p-value < 0.01, ***p-value < 0.001 vs. day 10 (or day 15 for fat). N=4.
Figure 7. mRNA expression pattern of Etf1 during the puberty period in female mouse tissues.
mRNA was extracted from mouse tissues by the number of days concerned and reverse transcribed. The mRNA levels of Etf1 were measured by quantitative real-time PCR. Results are expressed as the fold stimulation over the mRNA level observed on day 10 or 15 each and presented as mean values of two independent experiments, each performed with duplicate samples. (A) Hypothalamus. (B) Pituitary. (C) Uterus. (D) Ovary, (E) Fat. *p-value < 0.05, **p-value < 0.01, ***p-value < 0.001 vs. day 10 (or day 15 for fat). N=4.
Figure 8. mRNA expression pattern of Magi2 during the puberty period in female mouse tissues.
mRNA was extracted from mouse tissues by the number of days concerned and reverse transcribed. The mRNA levels of Magi2 were measured by quantitative real-time PCR. Results are expressed as the fold stimulation over the mRNA level observed on day 10 or 15 each and presented as mean values of two independent experiments, each performed with duplicate samples. (A) Hypothalamus. (B) Pituitary. (C) Uterus. (D) Ovary, (E) Fat. *p-value < 0.05, **p-value < 0.01, ***p-value < 0.001 vs. day 10 (or day 15 for fat). N=4.
Figure 9. mRNA expression pattern of Mpped2 during the puberty period in female mouse tissues.
mRNA was extracted from mouse tissues by the number of days concerned and reverse transcribed. The mRNA levels of Mpped2 were measured by quantitative real-time PCR. Results are expressed as the fold stimulation over the mRNA level observed on day 10 or 15 each and presented as mean values of two independent experiments, each performed with duplicate samples. (A) Hypothalamus. (B) Pituitary. (C) Uterus. (D) Ovary, (E) Fat. *p-value < 0.05, **p-value < 0.01, ***p-value < 0.001 vs. day 10 (or day 15 for fat). N=4.
Figure 10. mRNA expression pattern of Dok6 during the puberty period in female mouse tissues.
mRNA was extracted from mouse tissues by the number of days concerned and reverse transcribed. The mRNA levels of Dok6 were measured by quantitative real-time PCR. Results are expressed as the fold stimulation over the mRNA level observed on day 10 or 15 each and presented as mean values of two independent experiments, each performed with duplicate samples. (A) Hypothalamus. (B) Pituitary. (C) Uterus. (D) Ovary, (E) Fat. *p-value < 0.05, **p-value < 0.01,
***p-E. Gene expression patterns of previously known genes during the puberty period in female mouse tissues.
I investigated the mRNA levels of Kiss1 and Gnrh, which have been previously identified to be involved in precious puberty during the puberty period in female mouse tissues. The expression of Kiss1 was gradually increased from days 26 to 36 in the hypothalamus (Figure 11A). In the pituitary, the lowest of mRNA level was observed at day 22 (p < 0.01) and the mRNA level of Kiss1 gradually decreased from days 26 to 36 (Figure 11B). The expression level of Kiss1 in the uterus was the lowest at day 22, as observed in the pituitary (p < 0.001), and it was significantly decreased at day 30 (p < 0.01) (Figure 11C). In the ovary, it was decreased at days 26 and 30 (p < 0.001 and p < 0.05, respectively) (Figure 11D). The mRNA level of Kiss1 in fat was significant only at day 22 (p < 0.001) (Figure 11E). In case of Gnrh, the mRNA levels in the hypothalamus, uterus, and fat were significant at days 26 and 30. (p < 0.001 in the hypothalamus, p < 0.01 in the uterus, p < 0.01 or p < 0.001 in the fat) (Figure 12A, C, E). Additionally, it showed a tendency toward a decrease in the pituitary (Figure 12B). In the ovary, it was decreased at day 22 (p < 0.001), but increased at day 30 (p < 0.01) (Figure 12D). Usually, Kiss1 is expressed in kiss1 neurons and acts directly on GnRH neurons in the hypothalamus. The results of this also study implied this. However, at day 36, the mRNA level of Gnrh in the hypothalamus was decreased, although the mRNA level of Kiss1 in the hypothalamus was increased.
Figure 11. mRNA expression pattern of the previously identified Kiss1 gene during the puberty period in female mouse tissues.
mRNA was extracted from mouse tissues by the number of days concerned and reverse transcribed. The mRNA levels were measured by quantitative real-time PCR. Results are expressed as the fold stimulation over the mRNA level observed on days 10 or 15 each and presented as mean values of two independent experiments, each performed with duplicate samples. (A) Hypothalamus. (B) Pituitary. (C) Uterus. (D) Ovary, (E) Fat. *p-value < 0.05, **p-value < 0.01, ***p-value < 0.001 vs. day 10 (or day 15 for fat). N=4.
Figure 12. mRNA expression pattern of the previously identified Gnrh gene during the puberty period in female mouse tissues.
mRNA was extracted from mouse tissues by the number of days concerned and reverse transcribed. The mRNA levels were measured by quantitative real-time PCR. Results are expressed as the fold stimulation over the mRNA level observed on day 10 or 15 each and presented as mean values of two independent experiments, each performed with duplicate samples. (A) Hypothalamus. (B) Pituitary. (C) Uterus. (D) Ovary, (E) Fat. *p-value < 0.05, **p-value < 0.01, ***p-value < 0.001 vs. day 10 (or day 15 for fat). N=4.
F. Network analysis
I conducted a network analysis of the genes identified to be involved in precocious puberty using Ingenuity Pathway Analysis (IPA) software. The network analysis showed how each gene (EGR1, HSPA9, ETF1, MAGI2, MPPED2, DOK6) is associated with precocious puberty in silico (Figure 13). EGR1 is associated with precocious puberty via two nodes and networked with several genes such as GNAS, LHCGR, and LHB (Figure 13A). HSPA9 is associated with precocious puberty via three nodes and networked with genes previously known to be involved in precocious puberty, such as MKRN3, LHB, GNRHR, GNRH1, and KISS1R (Figure 13B). ETF1 is related to KISS1R and NR0B1 genes and its network was associated with precocious puberty via three nodes (Figure 13C). MAGI2 interacted with TGFA, SMAD3, CTNNB1, AKT, and PTEN, and further interacted with GNRH1, GNRHR, LHB, FSHB, LHCGR, and NR0B1 (Figure 13D). MPPED2 shows only one interaction with LHCGR through NR2F6 (Figure 13E). DOK6 interacted with KISS1R, GNAS, GNRH1, and MKRH3 and its network was associated with precocious puberty via three nodes (Figure 13F).
Figure 13. Results of network analysis showing correlated interaction between the identified genes and precocious puberty.
The relationships are showed as lines that indicate direct (solid lines) or indirect (dashed lines) interactions between nodes. Non-targeting interactions were indicated by lines, for example, the chemical-chemical interactions, chemical-protein interactions, correlations, protein-protein interactions, RNA-RNA interactions, and these allow mean activation, causation, expression, localization, membership, modification, molecular cleavage, phosphorylation, protein-DNA interactions, protein-RNA interactions, regulation of binding, and transcription between nodes to occur. Network between precocious puberty and (A) Egr1, (B) Hspa9, (C) Etf1, (D) Magi2, (E) Mpped2, and (F) Dok6.
IV. DISCUSSION
In this study, the identification of new genetic variants associated with precocious puberty was attempted. A case-control GWAS of 902,527 SNPs was performed, using data from 699 precocious puberty patients and 300 controls in Korean girls. The results of GWAS were verified by performing candidate-gene association analysis using the SNPs of previously identified genes that are closely related with precocious puberty, including KISS1 and KISS1R.
Finally, eight SNPs, rs10900855, rs13187637, rs373629, rs3849046, rs56252016, rs62579679, rs4680885 and rs4891764, were identified, and they showed a significant association with precocious puberty (p < 1.0 × 10⁻⁵). After annotation and
signal plot analysis of the eight SNPs were carried out, the following six genes were selected for further studies: EGR1, ETF1, HSPA9, MAGI2, MPPED2 and DOK6.
Early growth response protein-1 (EGR1) is broadly expressed in many tissues of several species, such as in the muscle, bone, and the central nervous systems (McMahon et al., 1990). EGR1 is also known as the gene downstream of GnRH. When GnRH was treated in the pituitary cell line, the expression of Egr1 was increased and up-regulated the mRNA level of Lhb (Tremblay and Drouin, 1999). The regulation of Lhb by Egr1 has been observed in several cell lines of many species, including human as well as in certain in vivo experiments (Lee et al., 1996; Dorn et al., 1999; Wolfe and Call, 1999). It was found that the mRNA expression of Kiss1,
GnRH, and Egr1 was increased during the puberty period in hypothalamus. Based on these results and those of previous studies, it can be expected that Kiss1 induced Gnrh expression and Gnrh increased the expression of Egr1. This result, together with the odds ratio obtained from the cohort study, suggests that the overexpression of Egr1 could potentially cause precocious puberty. Although some studies were performed and identified the same results in the pituitary, the results could not be confirmed in this study. Even if GnRH expression was increased in the uterus and ovary during the puberty period, Egr1 expression was decreased at that time. In fat, not only was the mRNA level of GnRH increased, but expression of Egr1 was also increased at that time.
Heat shock protein family A member 9 (HSPA9), Grp75, plays a role in the control of cell proliferation and cellular aging, and is known to be associated with myelodysplastic syndrome (MDS), a clonal hematopoietic stem cell disorder (Chen et al., 2011). According to network analysis, HSPA9 interacts with GnRH1 through several genes, such as IKBKB, HSPA5, NFKBIA, and PBX1. The mRNA level of Hspa9 with an odds ratio higher than 1 was increased only in the pituitary. However, since GnRH expression was low during the days at which the Hspa9 expression was high in the pituitary, it might be possible to control hypothalamic GnRH via interactions with other genes. HSPA9 might interact indirectly with GNRHR in pituitary and then affect precocious puberty. HSPA9 also interacts with FSHB, LHB, and KISS1R indirectly; hence, they need to be studied further. Eukaryotic Translation
Termination Factor 1 (ETF1), also known as the Eukaryotic Release Factor 1 (RF1), is involved in translation, termination, and promotion of polypeptide chain release. (Zhouravleva et al., 1995) The mRNA level of Etf1 only slightly increased in the pituitary, and according to network analysis, it interacts with KISS1R though PPP2CA and EGFR. Hence, the relationship between ETF1 and KISS1R in the pituitary needs to be studied further.
Membrane-associated guanylate kinase inverted 2 (MAGI2) encodes a protein that is known to occur at the tight junction of epithelial cells. The expression of MAGI2 with an odds ratio lower than 1 was decreased in the hypothalamus, which secretes GNRH, in the pituitary, which expresses GNRHR, in the uterus, which expresses LHCGR, and in the ovary, which expresses LHCGR and secretes LHB and FSHB. The decline in the expression of Magi2 in these tissues might be linked to precocious puberty.
Metallophosphoesterase Domain Containing 2 (MPPED2) is located between the FSHB and PAX6 genes on human chromosome 11 in a region that is associated with the WAGR syndrome (Wilms’ tumor, aniridia, genitourinary anomalies and mental retardation) (Liguori et al., 2012). MPPED2 was relatively less associated with precocious puberty in network analysis. It has a relation with LHCGR that is expressed in ovary and uterus. The mRNA level of Mpped2 with odds ratio lower than 1 was decreased in the hypothalamus, pituitary, and uterus. Though there is no previous study regarding it yet, it is likely to be related to the FSHB and LHCGR in
uterus.
Finally, DOK6 is a member of the downstream of kinase (DOK) gene, which encodes a protein that provides a docking platform for the assembly of multimolecular signaling complexes, especially on receptor tyrosine kinase and immunoreceptors (Mashima et al., 2009). Dok6 was identified outside the immune system initially and promotes Ret-mediated neurite outgrowth (Crowder et al., 2004). According to network analysis, DOK6 interacts with KISS1R that is expressed in the hypothalamus and pituitary and with GNRH1 that is expressed in the hypothalamus through another gene. The mRNA level of Dok6 was decreased significantly in every tissue except for fat. However, in the hypothalamus and ovary, its levels were showed an overall decreased. In the pituitary, mRNA level of Dok6 was decreased during the puberty period from days 22 to 30. Therefore, DOK6 might interact with KISS1R in the pituitary or might be expressed downstream of the hypothalamic GNRH in the pituitary.
Few genes including KISS1, KISS1R, and MKRN3, are known to be closely related with precocious puberty. However, no SNPs in these genes showed a significant association with precocious puberty (p < 1.0 × 10⁻⁵) in the current GWAS, suggesting
that the genetic background related with the pathogenesis of precocious puberty might be different among ethnic groups.
This is the first report regarding the identification of novel genetic variants in precocious puberty patients, based on both the GWAS conducted with large number
of patients and controls in girls. Six genes identified in this study might have the potential to be used as novel biomarkers for the early diagnosis of precocious puberty in girls, but further studies are needed to elucidate their molecular mechanisms, which are involved in pathogenesis of precocious puberty.
Based on the all results, this study might significantly affect the research and clinical fields regarding precocious puberty and would be helpful for investigators studying the genetic associations and molecular mechanisms of precocious puberty.
V. CONCLUSION
Eight genetic variants that are significantly associated with precocious puberty (p < 1.0 × 10⁻⁵) were discovered by performing a case-control GWAS with a total of
696 Korean girls with precocious puberty and 300 Korean normal controls. Further, the following six genes were identified, near which the SNPs were located: EGR1, HSPA9, ETF1, MAGI2, MPPED2, and DOK6, by the annotation and signal plot analysis of the identified SNPs.
The expression patterns of the six genes in the hypothalamus tissue of female mice indicated the there was a significant increase or decrease in levels during the puberty period. In silico pathway analysis revealed that all six genes were closely associated with precocious puberty.
These results indicate that the SNPs identified in these six genes were also closely associated with precocious puberty in girls.
REFERENCE
1. Abreu AP, Dauber A, Macedo DB, Noel SD, Brito VN, Gill JC, Cukier P,
Thompson IR, Navarro VM, Gagliardi PC, Rodrigues T, Kochi C, Longui CA, Beckers D, de Zegher F, Montenegro LR, Mendonca BB, Carroll RS, Hirschhorn JN, Latronico AC, Kaiser UB: Central precocious puberty caused by mutations in the imprinted gene MKRN3. N Engl J Med 368: 2467-2475, 2013
2. Aguirre RS, Eugster EA: Central precocious puberty: From genetics to treatment. Best Pract Res Clin Endocrinol Metab 32: 343-354, 2018
3. Brown RE, Imran SA, Ur E, Wilkinson M: KiSS-1 mRNA in adipose tissue
is regulated by sex hormones and food intake. Mol Cell Endocrinol 281: 64-72, 2008
4. Bulcao Macedo D, Nahime Brito V, Latronico AC: New causes of central precocious puberty: the role of genetic factors. Neuroendocrinology 100: 1-8, 2014
5. Carel JC, Lahlou N, Roger M, Chaussain JL: Precocious puberty and statural growth. Hum Reprod Update 10: 135-147, 2004
6. Carel JC, Leger J: Clinical practice. Precocious puberty. N Engl J Med 358: 2366-2377, 2008
7. Chen TH, Kambal A, Krysiak K, Walshauser MA, Raju G, Tibbitts JF, Walter MJ: Knockdown of Hspa9, a del(5q31.2) gene, results in a decrease in
hematopoietic progenitors in mice. Blood 117: 1530-1539, 2011
8. Choi JH, Yoo HW: Control of puberty: genetics, endocrinology, and environment. Curr Opin Endocrinol Diabetes Obes 20: 62-68, 2013
9. Chu MX, Feng T, Di R, Zhang BY, Zhang YJ: [Advances on related genes
with sexual precocity in mammals]. Yi Chuan 31: 13-28, 2009
10. Colledge WH: Kisspeptins and GnRH neuronal signalling. Trends
Endocrinol Metab 20: 115-121, 2009
11. Crowder RJ, Enomoto H, Yang M, Johnson EM, Jr., Milbrandt J: Dok-6, a
Novel p62 Dok family member, promotes Ret-mediated neurite outgrowth. J Biol Chem 279: 42072-42081, 2004
12. de Vries L, Kauschansky A, Shohat M, Phillip M: Familial central precocious puberty suggests autosomal dominant inheritance. J Clin Endocrinol Metab 89: 1794-1800, 2004
13. Den Hond E, Schoeters G: Endocrine disrupters and human puberty. Int J Androl 29: 264-271; discussion 286-290, 2006
14. Dorn C, Ou Q, Svaren J, Crawford PA, Sadovsky Y: Activation of luteinizing hormone beta gene by gonadotropin-releasing hormone requires the synergy of early growth response-1 and steroidogenic factor-1. J Biol Chem 274: 13870-13876, 1999
15. Dungan HM, Clifton DK, Steiner RA: Minireview: kisspeptin neurons as central processors in the regulation of gonadotropin-releasing hormone
secretion. Endocrinology 147: 1154-1158, 2006
16. Elks CE, Perry JR, Sulem P, Chasman DI, Franceschini N, He C, Lunetta KL, Visser JA, Byrne EM, Cousminer DL, Gudbjartsson DF, Esko T, Feenstra B, Hottenga JJ, Koller DL, Kutalik Z, Lin P, Mangino M, Marongiu M, McArdle PF, Smith AV, Stolk L, van Wingerden SH, Zhao JH, Albrecht E, Corre T, Ingelsson E, Hayward C, Magnusson PK, Smith EN, Ulivi S, Warrington NM, Zgaga L, Alavere H, Amin N, Aspelund T, Bandinelli S, Barroso I, Berenson GS, Bergmann S, Blackburn H, Boerwinkle E, Buring JE, Busonero F, Campbell H, Chanock SJ, Chen W, Cornelis MC, Couper D, Coviello AD, d'Adamo P, de Faire U, de Geus EJ, Deloukas P, Doring A, Smith GD, Easton DF, Eiriksdottir G, Emilsson V, Eriksson J, Ferrucci L, Folsom AR, Foroud T, Garcia M, Gasparini P, Geller F, Gieger C, Consortium G, Gudnason V, Hall P, Hankinson SE, Ferreli L, Heath AC, Hernandez DG, Hofman A, Hu FB, Illig T, Jarvelin MR, Johnson AD, Karasik D, Khaw KT, Kiel DP, Kilpelainen TO, Kolcic I, Kraft P, Launer LJ, Laven JS, Li S, Liu J, Levy D, Martin NG, McArdle WL, Melbye M, Mooser V, Murray JC, Murray SS, Nalls MA, Navarro P, Nelis M, Ness AR, Northstone K, Oostra BA, Peacock M, Palmer LJ, Palotie A, Pare G, Parker AN, Pedersen NL, Peltonen L, Pennell CE, Pharoah P, Polasek O, Plump AS, Pouta A, Porcu E, Rafnar T, Rice JP, Ring SM, Rivadeneira F, Rudan I, Sala C, Salomaa V, Sanna S, Schlessinger D, Schork NJ, Scuteri A, Segre AV, Shuldiner AR, Soranzo N,
Sovio U, Srinivasan SR, Strachan DP, Tammesoo ML, Tikkanen E, Toniolo D, Tsui K, Tryggvadottir L, Tyrer J, Uda M, van Dam RM, van Meurs JB, Vollenweider P, Waeber G, Wareham NJ, Waterworth DM, Weedon MN, Wichmann HE, Willemsen G, Wilson JF, Wright AF, Young L, Zhai G, Zhuang WV, Bierut LJ, Boomsma DI, Boyd HA, Crisponi L, Demerath EW, van Duijn CM, Econs MJ, Harris TB, Hunter DJ, Loos RJ, Metspalu A, Montgomery GW, Ridker PM, Spector TD, Streeten EA, Stefansson K, Thorsteinsdottir U, Uitterlinden AG, Widen E, Murabito JM, Ong KK, Murray A: Thirty new loci for age at menarche identified by a meta-analysis of genome-wide association studies. Nat Genet 42: 1077-1085, 2010
17. Gajdos ZK, Hirschhorn JN, Palmert MR: What controls the timing of puberty? An update on progress from genetic investigation. Curr Opin Endocrinol Diabetes Obes 16: 16-24, 2009
18. Ghizzoni L, Cappa M, Vottero A, Ubertini G, Carta D, Di Iorgi N, Gasco V, Marchesi M, Raggi V, Ibba A, Napoli F, Massimi A, Maghnie M, Loche S, Porzio O: Relationship of CYP21A2 genotype and serum 17-hydroxyprogesterone and cortisol levels in a large cohort of Italian children with premature pubarche. Eur J Endocrinol 165: 307-314, 2011
19. Houk CP, Kunselman AR, Lee PA: The diagnostic value of a brief GnRH
analogue stimulation test in girls with central precocious puberty: a single 30-minute post-stimulation LH sample is adequate. J Pediatr Endocrinol
Metab 21: 1113-1118, 2008
20. Jeong HR, Lee HS, Hwang JS: Makorin ring finger 3 gene analysis in Koreans with familial precocious puberty. J Pediatr Endocrinol Metab 30: 1197-1201, 2017
21. Kaminski BA, Palmert MR: Genetic control of pubertal timing. Curr Opin
Pediatr 20: 458-464, 2008
22. Ko JM, Lee HS, Hwang JS: KISS1 gene analysis in Korean girls with central precocious puberty: a polymorphism, p.P110T, suggested to exert a protective effect. Endocr J 57: 701-709, 2010
23. Kong L, Tang M, Zhang T, Wang D, Hu K, Lu W, Wei C, Liang G, Pu Y:
Nickel nanoparticles exposure and reproductive toxicity in healthy adult rats. Int J Mol Sci 15: 21253-21269, 2014
24. Krstevska-Konstantinova M, Jovanovska J, Tasic VB, Montenegro LR, Beneduzzi D, Silveira LF, Gucev ZS: Mutational analysis of KISS1 and KISS1R in idiopathic central precocious puberty. J Pediatr Endocrinol Metab 27: 199-201, 2014
25. Lee HS, Jin HS, Shim YS, Jeong HR, Kwon E, Choi V, Kim MC, Chung IS,
Jeong SY, Hwang JS: Low Frequency of MKRN3 Mutations in Central Precocious Puberty Among Korean Girls. Horm Metab Res 48: 118-122, 2016
polymorphisms with central precocious puberty in girls. Clin Endocrinol (Oxf) 81: 395-400, 2014
27. Lee PA, Guo SS, Kulin HE: Age of puberty: data from the United States of America. APMIS 109: 81-88, 2001
28. Lee SL, Sadovsky Y, Swirnoff AH, Polish JA, Goda P, Gavrilina G, Milbrandt J: Luteinizing hormone deficiency and female infertility in mice lacking the transcription factor NGFI-A (Egr-1). Science 273: 1219-1221, 1996
29. Li X, Sun Z, Manthari RK, Li M, Guo Q, Wang J: Effect of gestational exposure to arsenic on puberty in offspring female mice. Chemosphere 202: 119-126, 2018
30. Liguori L, Andolfo I, de Antonellis P, Aglio V, di Dato V, Marino N, Orlotti NI, De Martino D, Capasso M, Petrosino G, Schramm A, Navas L, Tonini GP, Eggert A, Iolascon A, Zollo M: The metallophosphodiesterase Mpped2 impairs tumorigenesis in neuroblastoma. Cell Cycle 11: 569-581, 2012 31. Mashima R, Hishida Y, Tezuka T, Yamanashi Y: The roles of Dok family
adapters in immunoreceptor signaling. Immunol Rev 232: 273-285, 2009 32. Matchock RL, Susman EJ: Family composition and menarcheal age:
anti-inbreeding strategies. Am J Hum Biol 18: 481-491, 2006
33. Mayer C, Acosta-Martinez M, Dubois SL, Wolfe A, Radovick S, Boehm U,
Levine JE: Timing and completion of puberty in female mice depend on estrogen receptor alpha-signaling in kisspeptin neurons. Proc Natl Acad Sci
U S A 107: 22693-22698, 2010
34. McMahon AP, Champion JE, McMahon JA, Sukhatme VP: Developmental
expression of the putative transcription factor Egr-1 suggests that Egr-1 and c-fos are coregulated in some tissues. Development 108: 281-287, 1990 35. Mendoza N, Moron FJ, Quereda F, Vazquez F, Rivero MC,
Martinez-Astorquiza T, Real LM, Sanchez-Borrego R, Gonzalez-Perez A, Ruiz A: A digenic combination of polymorphisms within ESR1 and ESR2 genes are associated with age at menarche in the Spanish population. Reprod Sci 15: 305-311, 2008
36. Nam HK, Rhie YJ, Son CS, Park SH, Lee KH: Factors to predict positive
results of gonadotropin releasing hormone stimulation test in girls with suspected precocious puberty. J Korean Med Sci 27: 194-199, 2012
37. Oh YJ, Rhie YJ, Nam HK, Kim HR, Lee KH: Genetic Variations of the KISS1R Gene in Korean Girls with Central Precocious Puberty. J Korean Med Sci 32: 108-114, 2017
38. Palmert MR, Boepple PA: Variation in the timing of puberty: clinical spectrum and genetic investigation. J Clin Endocrinol Metab 86: 2364-2368, 2001
39. Parent AS, Rasier G, Gerard A, Heger S, Roth C, Mastronardi C, Jung H,
Ojeda SR, Bourguignon JP: Early onset of puberty: tracking genetic and environmental factors. Horm Res 64 Suppl 2: 41-47, 2005
40. Parent AS, Teilmann G, Juul A, Skakkebaek NE, Toppari J, Bourguignon JP: The timing of normal puberty and the age limits of sexual precocity: variations around the world, secular trends, and changes after migration. Endocr Rev 24: 668-693, 2003
41. Pasquino AM, Pucarelli I, Segni M, Matrunola M, Cerroni F: Adult height in girls with central precocious puberty treated with gonadotropin-releasing hormone analogues and growth hormone. J Clin Endocrinol Metab 84: 449-452, 1999
42. Phillip M, Lazar L: Precocious puberty: growth and genetics. Horm Res 64 Suppl 2: 56-61, 2005
43. Rhie YJ, Lee KH, Eun SH, Choi BM, Chae HW, Kwon AR, Lee WJ, Kim JH,
Kim HS: Serum kisspeptin levels in Korean girls with central precocious puberty. J Korean Med Sci 26: 927-931, 2011
44. Rhie YJ, Lee KH, Ko JM, Lee WJ, Kim JH, Kim HS: KISS1 gene polymorphisms in Korean girls with central precocious puberty. J Korean Med Sci 29: 1120-1125, 2014
45. Schreiner F, Gohlke B, Hamm M, Korsch E, Woelfle J: MKRN3 mutations
in familial central precocious puberty. Horm Res Paediatr 82: 122-126, 2014 46. Seminara SB, Messager S, Chatzidaki EE, Thresher RR, Acierno JS, Jr., Shagoury JK, Bo-Abbas Y, Kuohung W, Schwinof KM, Hendrick AG, Zahn D, Dixon J, Kaiser UB, Slaugenhaupt SA, Gusella JF, O'Rahilly S, Carlton
MB, Crowley WF, Jr., Aparicio SA, Colledge WH: The GPR54 gene as a regulator of puberty. N Engl J Med 349: 1614-1627, 2003
47. Sultan C, Gaspari L, Maimoun L, Kalfa N, Paris F: Disorders of puberty. Best Pract Res Clin Obstet Gynaecol 48: 62-89, 2018
48. Tremblay JJ, Drouin J: Egr-1 is a downstream effector of GnRH and synergizes by direct interaction with Ptx1 and SF-1 to enhance luteinizing hormone beta gene transcription. Mol Cell Biol 19: 2567-2576, 1999
49. Tremblay L, Frigon JY: Precocious puberty in adolescent girls: a biomarker of later psychosocial adjustment problems. Child Psychiatry Hum Dev 36: 73-94, 2005
50. Wolfe MW, Call GB: Early growth response protein 1 binds to the luteinizing beta promoter and mediates gonadotropin-releasing hormone-stimulated gene expression. Mol Endocrinol 13: 752-763, 1999
51. Xin X, Xiao J, Luan X, Zhou Y, Lu D, Wei D, Yang S: Association study of six activity SNPS in adrenal steroid hormone metabolism and IBM related genes with precocious puberty in Chinese girls. Neuro Endocrinol Lett 27: 219-224, 2006
52. Zhouravleva G, Frolova L, Le Goff X, Le Guellec R, Inge-Vechtomov S, Kisselev L, Philippe M: Termination of translation in eukaryotes is governed by two interacting polypeptide chain release factors, eRF1 and eRF3. EMBO J 14: 4065-4072, 1995
- 국 문 요 약 –