반도체디스플레이기술학회지 제20권 제1호(2021년 3월) Journal of the Semiconductor & Display Technology, Vol. 20, No. 1. March 2021.
기판 온도와 분위기 가스에 따른 AZO 박막의 구조적 및
전기적 특성
홍경림· 이규만
††한국기술교육대학교 에너지신소재화학공학부
Effect of Substrate Temperature and Gas Flow Rate of Atmosphere Gases on
Structural and Electrical Properties of AZO Thin Films
Kyoung Lim Hong and Kyu Mann Lee
††Dept. of Materials Engineering, Korea University of Technology and Education
ABSTRACT
We have investigated the effect of the substrate temperature and hydrogen flow rate on the characteristics of AZO thin films for the TCO (transparent conducting oxide). For this purpose, AZO thin films were deposited by RF magnetron sputtering at room temperature and 300oC with various H2 flow rate. Experiments were carried out while varying the hydrogen gas flow rate from 0sccm to 5.0sccm in order to see how the hydrogen gas affects the AZO thin films. AZO thin films deposited at 300oC showed amorphous structure, whereas IZO thin films deposited at room temperature showed crystalline structure having an (222) preferential orientation. The electrical resistivity of the AZO films deposited at 300oC was 4.388x10⁻³Ωcm, the lowest value. As the hydrogen gas flow rate increased, the resistivity tended to decrease.
Key Words : AZO thin film, RF-magnetron sputtering, substrate temperature, hydrogen flow rate
1. 서 론
1 빠르게 변화하고 있는 고도의 정보화 사회인 현재, 수 많은 정보들 사이에서 양질의 정보를 얻고 정확한 정보 를 전달하는 것에 대한 관심이 증가하고 있다. 이러한 관 심속에서 시각화된 정보를 전달하는 디스플레이 기술에 대한 수요는 점점 증가하고 있으며, 한동안 지속될 것이 다. 특히 휴대성이 중요해지며 점점 경량화, 박막화, 소형 화는 물론 고화질과 유연성까지 여러 요구를 받게 되었 다. 이로 인해 각종 평판디스플레이 (FPD, Flat Panel Display) 의 개발에 많은 연구가 집중되고, 현재는 OLED (Organic Light Emitting Diode), Flexible Display까지 개발과 상용화가 이 루어지고 있다. OLED는 고분자 필름 기판이 사용되어 †E-mail: [email protected] LCD 보다 가볍고, 두께와 가격에 유리하며 Flexible Display 를 제작 가능하다는 장점이 있다. 이에 따라 각종 디스플 레이 소자의 기본인 투명 전도성 산화물 (TCO, Transperent Conducting Oxide) 재료개발과 기술연구가 증가하고있다 [1-3]. TCO 박막 중 가장 많이 사용되고 있는 것은 ITO (Indium Tin Oxide)이다. ITO는 N-type의 특성을 띄는 산화물 반도체로, 넓은 밴드갭으로 가시광영역에서 높은 투과도 와 낮은 비저항을 보여 박막 디스플레이에 널리 사용되 고 있다. 하지만 이러한 ITO 박막을 얻기 위해서는 250℃ 이상에서 증착 후 300℃ 이상에서 후열처리를 하는 등의 고온 공정이 필요하다. 고온 공정을 진행하게 되면 박막 의 결정화가 진행되며, 이에 따라 박막의 표면 거칠기가 증가하게 되면서 소자의 안정성이 떨어진다. 또한 주성분 인 인듐(In)은 희소금속이고, 독성이 있다는 문제점이 있홍경림 · 이규만 2
다[4,5].
이러한 이유로 위의 단점을 보완할 수 있는 새로운 재 료들이 연구, 개발 중이며, 그 중 AZO (Al-doped Zinc Oxide) 는 ZnO 산화물 반도체에 Al을 도핑한 투명 전도성 산화 물 반도체이다. ZnO는 ITO와 달리 원소가 풍부하고 독성 이 없으며 원활한 수급이 가능하다. ZnO에 Al을 도핑하게 되면 시간이 흐를수록 산소공공의 소멸에 의한 비저항 증가라는 순수 ZnO의 단점을 해결할 수 있다. AZO는 저 온증착이 용이하고, 고온증착에도 거칠기가 증가하지 않 으며 순수 ZnO보다 좋은 전기적 특성을 가지고 있다. 또 한 가시광 영역에서 80% 이상의 투과도를 보이는 등 ITO 를 대체할 수 있는 물질로 연구가 이루어지고 있다. 이러 한 AZO는 sol-gel, CVD(Chemical Vapor Deposition), Thermal Evaporation, Sputtering등으로 증착이 가능하다[6-9].
이번 연구에서는 RF magnetron sputtering을 이용하여 AZO 박막을 증착하였으며, 증착 온도 및 수소 가스의 유량이 구조적, 전기적 특성에 어떻게 영향을 미치는지에 대하여 분석하였다.
2. 실험 방법
이 연구에서 박막 증착에 사용된 타겟은 ZnO/Al2O3 (98/2wt%)이고 직경 3인치의 고밀도 AZO이며, RF magnetron sputtering 장비를 이용하여 Corning 7059 glass에 증착하였다. 유리 기판은 불순물 제거를 위해 아세톤, 에탄올, 증류수 순으로 각각 10분씩 초음파 세척기를 사용하여 세척한 후 질소 가스로 건조하였다. 박막 증착 전, 타겟 표면의 불순물 제거와 스퍼터 방전 안정화를 위하여 70W의 파워로 10분간 전처리 스퍼터링 (pre-sputtering)을 실시하였고, 타겟과 기판의 거리는 약 7 cm로 진행하였다. 플라즈마 생성을 위한 Ar gas는 40 sccm 으로 고정하였고, 반응 가스인 H2는 0 sccm부터 5 sccm까지MFC(Mass Flow Controller)를 이용하여 조절하며 실험하 Table 1. Sputtering conditions of AZO thin films
Deposition parameters Conditions Target ZnO/Al2O3(98/2 wt.%)
Substrate Glass (corning 7059) Initial pressure(torr) 3.0 x 10⁻⁵
Working pressure (torr) 3.0 x 10⁻³ Film thickness(nm) 200 Substrate temperature(℃) Room temp. and 300
RF power(W) 70 Deposition time(min) 40
Gas ambient(sccm) Ar:40, H2 flow rate: 0.0-5.0
였다. 박막의 두께는 200 nm로 고정하였고, 이 외의 실험 결과에 영향을 줄 수 있는 공정조건들은 선행 실험을 통 해 찾은 최적 조건으로 고정하여 진행하였다.
증착된 AZO 박막의 표면 미세구조와 거칠기 분석을 위해 FE-SEM(Field Emission-Scanning Electron Microscopy, JEOL, JSM7500F), AFM(Atomic Force Microscope, PUCOTECH, MOD-1M)을 이용하였다. 결정구조 분석을 위하여 X-ray diffraction(RIGAKU, RTP300RC)을 이용하였고 carrier concentration, mobility, resistivity 등의 전기적 특성은 Hall effect measurement (HMS-3000)로 측정하였다. 성분 분석 및 전기 적 특성의 추가적 분석을 위해 XPS(X-ray Photoelectron Spectroscopy)를 이용하여 분석하였다.
3. 결과 및 고찰
Fig. 1과 2는 챔버 내의 가스 분위기 및 기판 온도에 따 라 증착된 AZO 박막의 구조적 특성 분석을 위해 측정한 FE-SEM의 사진이다. Fig. 1에서 볼 수 있듯이 상온에서 증 착했을 경우 분위기 가스와 관계없이 원형의 결정들이 보이고, 눈에 띄는 압자크기의 변화는 보이지 않는다. Fig. 2는 300℃에서 증착한 AZO 박막의 사진으로, 결정 모양들 이 흐트러진 것을 볼 수 있으며, 상온에서의 결과와 같이 눈에 띄는 입자크기의 변화는 보이지 않는다. Fig. 3과 4는 증착된 AZO 박막의 표면 특성을 알아보기 위해 측정한 AFM 사진이다. 상온과 300℃에서의 측정 결 과 모두 대부분 표면거칠기 (Ra) 2 nm 이하로 평탄하며, (a) RT,H2 0sccm (b) RT, H2 1sccm (c) RT, H2 3sccm (d) RT, H2 5sccmFig. 1. FE-SEM image of AZO thin film deposited at room temperature with H2 flow rate from 0 to 5 sccm.
기판 온도와 분위기 가스에 따른 AZO 박막의 구조적 및 전기적 특성 3
(a) 300℃, H₂ 0sccm (b) 300℃, H₂ 1sccm
(c) 300℃, H₂ 3sccm (d) 300℃, H₂ 5sccm Fig. 2. FE-SEM image of AZO thin film deposited at 300℃
with H₂ flow rate from 0 to 5 sccm.
(a) RT, H₂ 0sccm Ra : 1.577nm (b) RT, H₂ 1sccm Ra : 1.488nm (c) RT, H₂ 3sccm Ra : 1.692nm (d) RT, H₂ 5sccm Ra : 1.639nm Fig. 3. AFM image of AZO thin film deposited at room
temperature with H2 flow rate from 0 to 5 sccm.
FE-SEM 사진과 동일하게 입자크기의 변화에 따른 Ra 증 가는 보이지 않는다. Fig. 5는 증착된 AZO 박막의 결정구조 특성을 알아보기 위하여 측정한 XRD 패턴을 나타낸 그래프이다. Fig. 5(a)는 상온에서의 결과로, 약 35°에서 주 피크의 뚜렷한 모양을 (a) 300℃, H₂ 0sccm Ra : 1.887nm (b) 300℃, H₂ 1sccm Ra : 1.969nm (c) 300℃, H₂ 3sccm Ra : 2.396nm (d) 300℃, H₂ 5sccm Ra : 1.403nm Fig. 4. AFM image of AZO thin film deposited at 300℃
with H₂ flow rate from 0 to 5 sccm.
관찰 할 수 있다. Fig. 5(b)는 300℃에서의 결과로 상온에서 의 결과에 비해 뚜렷하게 작아진 피크를 관찰할 수 있다. Table 2에는 상온, 300℃에서 수소 유량에 따른 결정성 (Crystallinity)의 값을 나타내었다. 상온에서는 경향이 보이 지 않지만 300℃에서는 점차 줄어드는 경향을 볼 수 있으 며 비정질이 되어가는 것을 알 수 있다.
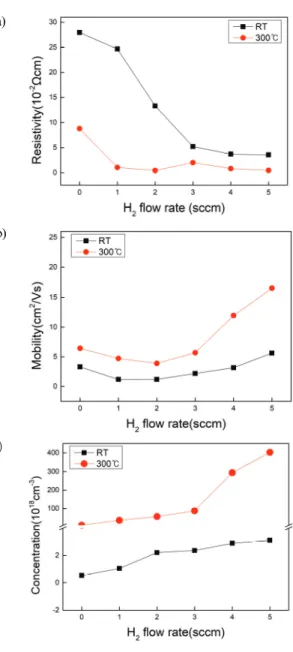
Fig. 6은 전기적 특성을 알아보기 위해 Hall measurement로 측정한 결과이다. Fig. 6(a)에 나타낸 비저항은 상온보다 300℃에서 더 낮은 값을 보였으며 두 온도 모두 감소하는 경향을 보인다. 상온에서의 최저값은 3.55x10⁻²Ωcm, 300℃에 서의 최저값은4.388x10⁻³Ωcm이다. Fig. 6(b)는 전하 이동도의 값을 나타내었다. 두 온도 모두 3 sccm까지는 0 sccm에 비 해 낮은 값을 보이다 4 sccm부터 급격히 증가하는 경향을 보인다. Fig. 6(c)는 캐리어농도의 값을 나타내었고, 두 온도 모두 점차 상승하는 경향을 보였다. 이는 수소가 유입됨 에 따라 챔버 내에 형성된 환원성 분위기 때문에 IZO의 산소가 환원되어 캐리어 생성기구인 산소공공이 형성되 고 이 산소공공에 의하여 캐리어가 발생되기 때문이다 [10].
홍경림 · 이규만 4
(a)
(b)
Fig. 5. X-ray diffraction pattern of AZO thin films deposited at (a) RT, (b) 300℃ with H2 flow rate from 0 to 5
sccm.
Table 2. Crystallinity of AZO thin films deposited different temperature with H2 flow rate from 0 to 5sccm
Crystallinity H₂ RT 300℃ 0sccm 32.9 33.1 1sccm 33.3 27.0 2sccm 33.2 23.6 3sccm 34 24.6 4sccm 35.0 20.9 5sccm 31.6 21.5
Fig. 7은 AZO 박막의 산소 성분인 O1s의 XPS 스펙트럼 을 피팅한 결과이다. TCO의 O1s를 분석하면 결합에너지 (binding energy)에 따라 high, middle, low의 세가지 피크로 나 눠진다. 먼저, high peak는 표면의 –OH기 등의 성분에 관련 되어 있고, middle peak는 산소 공공 등의 산소 결함에 관련
(a)
(b)
(c)
Fig. 6. (a) Resistivity, (b) mobility, (c) concentration of AZO thin films deposited at different temperature with H2
flow rate from 0 to 5 sccm.
되어 있다. Low peak는 격자 내의 산소를 나타낸다[11,12]. 두 온도 모두 0 sccm보다 1 sccm의 middle peak면적이 넓은 것이 보이지만, 이후에는 경향성이 보이지 않는다. Fig. 8은 0에서 1 sccm 사이의 산소 공공 영향을 보기 위하여 추가 적인 측정을 한 결과이며, 점차 면적이 증가하는 것을 볼 수 있다. 이는 수소유량이 증가함에 따라 산소공공의 양 이 증가함을 나타내는 것으로 증착 시 주입된 수소에 의
기판 온도와 분위기 가스에 따른 AZO 박막의 구조적 및 전기적 특성 5
해 챔버 내에 환원성 분위기가 형성되어 산소공공이 증 가한다는 hall measurement의 결과를 뒷받침해주는 내용이 된다.
(a) RT H₂ 0sccm Middle peak area : 22.32%
(b) RT H₂ 1sccm Middle peak area : 27.64%
(c) RT H₂ 3sccm Middle peak area : 25.62%
(d) RT H₂ 5sccm Middle peak area: 25.79%
(e) 300℃ H₂ 0sccm Middle peak area : 25.16%
(f) 300℃ H₂ 1sccm Middle peak area : 27.76%
(g) 300℃ H₂ 3sccm Middle peak area: 27.84%
(h) 300℃ H₂ 5sccm Middle peak area: 28.07% Fig. 7. XPS spectra of AZO thin films deposited at different
temperature with H2 flow rate from 0 to 5sccm.
(a) RT H₂ 0sccm Middle peak area : 22.32%
(b) RT H₂ 0.2sccm Middle peak area : 25.75%
(c) RT H₂ 0.6sccm Middle peak area : 28.55%
(d) RT H₂ 1sccm Middle peak area : 27.64%
(e) 300℃ H₂ 0sccm Middle peak area : 25.16%
(f) 300℃ H₂ 0.2sccm Middle peak area : 26.84%
(g) 300℃ H₂ 0.6sccm Middle peak area : 26.95%
(h) 300℃ H₂ 1sccm Middle peak area : 27.76% Fig. 8. XPS spectra of AZO thin films deposited at different
temperature with H2 flow rate from 0 to 5sccm.
4. 결 론
(1) 수소 유량별로 증착된 AZO의 표면, 구조적 특성은 상 온과 300℃ 모두 결정 모양과 입자크기의 변화를 확인 할 수 없었다. 결정 구조의 특성을 보다 명확하게 확 인하고자 XRD를 추가적으로 분석하였다. 상온에서는 피크의 크기 변화, 모양, 결정성 모두 경향을 확인할홍경림 · 이규만 6 수 없었고, 300℃에서는 뚜렷하게 작아지는 피크와 낮 아지는 결정성을 확인할 수 있었다. (2) 전기적 특성은 상온과 300℃ 모두 비저항이 낮아지는 것을 확인할 수 있었다. XPS를 통한 O1s의 성분 분석 에서는 수소를 첨가하였을 때 산소공공을 뜻하는 middle peak가 증가하였으나 경향을 찾을 수 없었고, 추 가적으로 실험한 0에서 1 sccm 사이에서는 산소공공이 점차 증가함을 알 수 있었다. 이는 수소를 주입할 시, 적은 유량에서는 산소공공이 주요 캐리어로 작용하지 만, 많은 유량에서는 산소공공보다 ZnO 격자내에 침 입된 수소로 인해 격자셀 부피 (Unit Cell Volume)이 증가 하고, 침입 수소가 Shallow donor로 작용하는 것으로 판 단된다.
감사의 글
이 논문은 2019학년도 한국기술교육대학교 교수교육연 구진흥과제 연구비 및 공용장비센터의 지원으로 연구되 었음.참고문헌
1. K. Ishibashi, K. Hirata, and N. Hosokawa, “Mass spectrometric ion analysis in the sputtering of oxide targets”, Journal of Vacuum Science & Technology A., Vol. 10, Iss. 4, p. 1718 (1992).
2. K. Tominaga, T. Udea, T. Ao, A. Katkoka, and I. Mori, “ITO films prepared by facing target system”, Thin Solid Films, Vol. 281-282, p. 194 (1996).
3. Y. Hoshi, H. Kato, and K. Funatsu, “Structure and electrical properties of ITO thin films deposited at high
rate by facing target sputtering”, Thin Solid Films, Vol. 445, p. 245 (2003).
4. Radhouane Bel Hadj Tahar, Takayuki Ban, Yutaka Ohya, and Yasutaka Takahashi, “Tin doped indium oxide thin films: Electrical properties”, J. Appl. Phys., Vol. 83, pp. 2631 (1998).
5. Tania Konry, Robert S. Marks, “Physico-chemical studies of indium tin oxide-coated fiber optic biosensors”, Thin Solid Films, Vol. 492, pp. 313 (2005). 6. J.H.Heo, “Electrical and Structural characteristics of
AZO thin films deposited by reactive sputtering”, Journal of the Semiconductor & Display Equipment Technology, Vol. 8, No 1, pp.33 (2009)
7. K.S. Sree Harsha, Principls of Physical Vapor Deposition of Thin films, San Jose State University (2006).
8. Donald L. Smith., Thin Film Deposition, Mgcraw Hill (2003).
9. Kiyotaka Wasa, Thin film Materials Technology, Springer (2003).
10. N. Ito, Y. Sato, P.K. Song, A. Kaijio, K. Inoue, and Y. Shigesato, “Electrical and optical properties of amorphous indium zinc oxide films”, Thin Solid Films, 496(1), pp.99-103, 2006.
11. K. K. Banger, Y. Yamashita, K. Mori, R. L. Peterson, T. Leedham, J. Rickard, and H. Sirringhaus, “Low-temperature, high-performance solution-processed metal oxide thin-film transistors formed by a ‘sol–gel on chip’ process”, Nature Materials, 10, pp. 45-50, 2011.
접수일: 2021년 1월 14일, 심사일: 2021년 2월 25일, 게재확정일: 2021년 3월 10일