- ABSTRACT -
Alteration of bone metabolism in OLETF rat
Purpose: OLETF rat is a model of Type II DM. Bone metabolism has influenced with hormones, growth factors, and cytokines that orchestrate the activities of both osteoclast and osteoblast cells. Type II DM influences bone metabolism and Neuropeptides-leptin and NPY2 receptor’s in hypothalamic control bone formation with osteoblast activity. We tried to distinct alteration of bone metabolism in OLETF rat from 8wks to 52wks.
Animals and treatment: Serum samples were collected in eleven male OLETF and LETO (control) rats, femoral BMD and percent body fat were measured in 8, 25, 40, 52wks of age. In 25wks of age, all the OLETF rats developed Type II DM. In 52wks of age, rats were sacrificed and brain sections were made for immunohistochemistry. Hormones, growth factors and bone markers were measured by radioimmunoassay.
Results: Body weight and percent body fat in OLETF rat were higher than that of LETO rat in whole time (p<0.001); but BMD was lower than control (p<0.05) from 40wks of age. OLETF rat hypothalamic arcuate neuron cell NPY2 receptor were strongly pattern expressed than LETO rat. OLETF rat testosterone was decreased in 25wks and significantly lower in 40 and 52wks (p<0.05); serum leptin and IGF-I levels were higher (p<0.05) in whole time; insulin levels were higher from 8wks to 40wks(p<0.05), but in 52wks lower (p<0.05) than LETO rat; free T4 were higher in 8wks and 25wks (p<0.05), but in 40wks there was no difference, in 52wks lower than LETO rat; corticosterone level was lower in 8wks (p<0.05), but higher in 25wks, 40wks, and 52wk (p<0.05). OLETF rat serum CTx was higher (p<0.05),
but OPG was lower (p<0.05) in 40wks and 52wks.
Conclusion: OLETF rat had low bone density after 40wks of age and this finding could be correlated with low level of testosterone, high level of corticosterone and leptin in serum, and also NPY2-R over-expression in hypothalamic arcuate nuclei.
TABLE OF CONTENTS
ABSTRACT……….i
TABLE OF CONTENTS ………….………..………iii
LIST OF FIGURES…………...…….……….v
LIST OF TABLES..……..……….………..………vi
ABBREVIATION………..………...………..vii
I. INTRODUCTION…...………1
II. METEIRALS AND METHODS……….3
A. ANIMALS AND TREATMENT………3
B. PHYSICAL MEASUREMENT………..4 C. BIOCHEMICAL ANALYSIS……….4 D. IMMUNOHISTOCHEMISTRY……….5 E. STATISTICAL ANALYSIS……….6 III. RESULTS………....7 IV. DISCUSSION……….………10 V. CONCLUSION……….………...14 REFERENCES..………..19 국문요약……….26
LIST OF FIGURES
Fig. 1. BODY WEIGHT ………..………..15 Fig. 2. BODY COMPOSITION ……….15 Fig. 3. BONE MINERAL DENSITY ………15 Fig. 4. MEMBRAIN EXPRESSION of Ob-R AND NPY2-R IN ARCUATE AND HYPOTHALAMIC………..… 17 Fig. 5. CTx….……….18 Fig. 6. OPG……….18
LIST OF TABLE
Table 1. Fasting glucose, insulin, Leptin, Testosterone, Corticosterone, IGF-I andfree T4 in 8wks, 25wks, 40wks and 52wks……….16 Table 2. Expression of Ob-R and NPY2-R at arcuate in LETO rats and OLETF
rats .………..…17
ABBREVIATION
DM diabetes mellitus BMD bone mineral density NPY neuropeptide Y
OLETF Otsuka Long-Evans Tokushima Fatty LETO Long-Evans Tokushima
IPGTT Intraperitoneal glucose tolerance test %CV percent coefficient of variation
OPG osteoprotegerin CTx C-terminal telopeptides Ob-R leptin receptor
NPY2-R neuropeptide Y2 receptor
RANKL receptor activator of NF-kB ligand
RANK receptor activator of nuclear factor kappa B TGF-β transforming growth factor-β
I. INTRODUCTION
It has well established that Type І diabetes mellitus (DM) is one of the reason of second osteoporosis (Shires R et al, 1981; Goodman WG and Hori MT, 1984), but Type II DM still has controversial as the reason of the osteoporosis (Weinstock RS et al, 1989; el Miedany YM et al, 1999; Christensen JO and Svendsen OL, 1999; Leidig-Bruckner G and Ziegler R, 2001). Previous study had demonstrated that bone mineral density (BMD) is intimated with body composition, high BMD associated with high body composition (Felson DT et al, 1993).
Otsuka Long-Evans Tokushima Fatty (OLETF) rat is the model of Type II DM, lacking CCK-A receptors are hyperphagic, obese, and diabetic (SHENG BI et al, 2001). OLETF rat’s weight has difference to libitum-fed Long-Evans Tokushima (LETO) rat’s from 5wks old, OLETF rat’s weight is significant higher than LETO rat’s in 40wks old, and the body weight gaps is about 200g (Kawano K et al, 1994; Kawano K et al, 1996). It is well known that level of OLETF rat’s glucose will be elevated from 18wks and will be developed DM in 24wks; albuminuria will be increased from 30wks, and pancreas ß-cell secreted insulin’s function will be decreased from 36wks (Kazuya K et al, 1999).
Bone metabolism has influenced with hormones, growth factors, and cytokines that orchestrate the activities of both osteoclast and osteoblast cells. Previous studies showed that neuropeptides and leptin have relationship with bone (Bjurholm A ,1991; Herzog H ,2002; Yun-Jung Leea et al, 2002; J Cornish et al, 2002; Melanie Henry et al ,2005). Leptin is a 16-KDa protein, which made by white fat cells, and its concentration in the blood varies with the fat load, which limited by reducing the secretion of hypothalamic eating stimulator,
neuropeptide (James F and Whitfield, PhD 1998). There are four possibilities for leptin controls bone formation: an autocrine, paracrine and/or endocrine mechanism or, as was the case for the rest of function of leptin, a neuroendocrine mechanism. From SHU’s study (SHU TAKEDA and GERARD KARSENTY, 2001), leptin did not act on osteoblasts directly, it acted on osteoblasts through an autocrine, paracrine or endocrine mechanism. Neuropeptide Y (NPY) is a downstream modulator of leptin action, possibly at the level of the arcuate and hypothalamicnucleus where NPY neurons are known to expression both leptin receptors and Y2 receptors. Leptin receptors and NPY2 receptors are present on NPY-expressing neurous of hypothalamic arcuate nucleus and are likely to share some common signaling pathways (Stephens, T.W. et al.1995; Broberger, C. et al, 1997; Baskin, D.G. et al, 1999; King, P.J. et al, 2000). It had demonstrated that hypothalamic arcuate Leptin and NPY2 receptor control of bone formation with osteoblast activity (Paul A Baldock et al, 2005).
This study was designed to find the distinct alteration of bone metabolism in OLETF rat from 8wks to 52wks.
II. MATEIRIALS AND METHODS
A. ANIMALS AND TREATMENT
6wks old eleven male OLETF rats and eleven age-matched male LETO rats were obtained as a generous gift of the Tokushima Research Institute, Otsuka Pharmaceutical Tokushima, Japan. Rats were individually housed and maintained on a 12:12-h light-dark cycle (lights on at 8:00 AM) with bottle water available ad libitum, and chows available ad libitum. Body weight was measured monthly, and from the 24wks old, it was measured weekly.
In 8wks, 25wks, 40wks, 52wks after over night fasting, all the rats were deeply anesthetized with U.S.P between AM 9 to AM 12, for were collected serum to measure hormones and bone markers. In 25wks, all the rats were done intraperitoneal glucose tolerance test (IPGTT). After overnight fasting, the rats were anesthetized with U.S.P, blood were collected with 24 gauge catheter in tail vein, and injected 50% glucose in peritoneal 2g/kg (Kazuya Ket al, 1999), collected blood after injected glucose 1 hour and 2 hours. The blood was preserved in 4℃ about 60minutes, blood samples were centrifuged 15minutes in 4℃ with 2500rpm. Serum and plasma were collected and preserved in -70℃ deep freezer until biochemical measurement. The plasma glucose levels were measured with blood sugar measuring instrument (Beckman, Stockholm, Sweden). Only rats that satisfied peak plasma glucose >300 mg/dl and plasma glucose at 120min >200mg/dl was diagnosed as Type II DM; rats that satisfied Peak plasma glucose >300 mg/dl or plasma glucose at 120min >200mg/dl was diagnosed impaired glucose tolerance (Kazuya K et al, 1999).
B. PHYSICAL MEASUREMENT
All the rats were deeply anesthetized with ketamine hydrochloride and Zylazine hydrochloride for measure body fat and femoral BMD at the 8wks, 24wks, 40wks and 52wks. It was measured using PIXImus Ⅱ densitometer (PIXImusTM Series; GE LUNAR, Madison, WI, USA) with 80/35 X-ray source, beam current 500µA, and scan resolution 0.18 x 0.18 mm, specifically designed for small animals. To ensure clinical integrity of the PIXImus, calibration of the instrument was conducted using thirty SD rats were measured twice, Results are given in g/cm2 and PIXImus Ⅱ percent coefficient of variation (%CV) was measured 1.7%. BMD was measured at left femur; total body was sectioned eight part, measure eight sections and combinded.
C. BIOCHEMICAL ANALYSIS
Serum and plasma samples in 8wks, 25wks, 40wks and 52wks were produced radioimmunoassay with rat insulin RIA kit (Linco Research Inc., St Charles, MO, USA), rat leptin RIA kit (Linco Research Inc., St Charles, MO, USA), rat corticosterone RIA kit (DPC Co., Los Angeles, CA, U.S.A), rat IGF-I RIA kit (DSL-2900, DSL.Inc, Texas, USA), human free T4 RIA kit (DPC Co., Los Angeles, CA, U.S.A), human testosterone RIA kit (DPC Co., Los Angeles, CA, U.S.A). Insulin kit intraassay %CV (coefficient of variation) is 2.7%, leptin kit %CV is 1.5%, corticosterone kit %CV is 4.3%, free T4 kit %CV is 5-10%, testosterone kit %CV is 5-18%, IGF-I kit %CV is 3.8-6.1%.
Bone resorption markers osteoprotegerin (OPG) and C-terminal telopeptides (CTx) were produced ELISA assay with Osteoprotegerin for mouse and rat (BI-20602, biomedical Medizinprodukte DMbH, Australia) and RatLapsTM ELISY kit (Nordic Bioscience Diagnostics, Denmark). OPG kit intraassay %CV is 5%-10%, CTx kit intraassay %CV is 5.6%.
D. IMMUNOHISTOCHEMISTRY
52wks old eleven LETO rats and eleven OLETF rats were deeply anethetized intra-peritoneally with 5% chloral hydrate solution 100 mg/kg i.p (Fluka 00672. Germany) and perfused via the ascending aorta with 300ml of calcium free Tyrode’s solution (37℃), followed by 300ml (37℃) of mixture of 4% paraformaldehyde and 0.2% picric acid diluted in 0.16 M phosphate buffer (pH 6.9 , Ulrika Smedh et al ,1998;Marie-Louise et al, 1998;
PABLO BRUMOVSKY et al, 2005) and 200ml ice cold the same fixative. Brains were
removed from the cranium quickly, post fixed for 90minutes at 4℃ with 4% paraformaldehyde and 0.16M phosphate buffer, 0.2% picric acid and finally immersed in 10% sucrose diluted in phosphate-buffered saline (PBS; pH 7.4) containing 0.01% sodium azide (Sigma, St. Louis, MO) and 0.02% Bacitracin (Sigma) at 4℃ for 24 hours. All tissue was embedded in Tissue-Tek O.C.T compound (Sakura, Torrence, CA) and serially sectioned in a cryostat (Microm, Heidelberg, Germany). Sections were cut 5µm and mounted on saline-coated micro slides, and incubated at room temperature for one hour with goat polyclonal anti-serum to the leptin receptor (ob-R) (diluted 1:100; anti-serum sc-1834; lot, G116; Santa Cruz, CA, USA) and rabbit antibody against the NPY2 receptor (NPY2-R)
(1:500; Neuromics, Minneapolis, MN; catalogue No. RA14112). After rinsing in phosphate-buffered saline (PBS; 0.1M phosphate buffer, PH 7.4, 0.15M Nacl), sections were incubated for 30 minutes at room temperature respectvely with anti-goat immunoglobulins (dilution 1:250; DAKO, Glostryp, Denmark) secondary and LSAB2 system-HRP(DAKO, Carpinteria, CA, USA) secondary antibodies. Immunostaining was visualized by using 3, 3’-diaminobenzidine (DAB) solution (DAKO, CA, USA), and counterstained with Mayer’s hematoxylin.
A semiquantitative assessment for Ob-R and NPY2-R expression was done accordiong to the following criteria: Negative (<5% positive staining of neuron cells), 1+ (5-24% positive staining of neuron cells), 2+ (25-50% positive staining of neuron cells), and 3+( >76% positive staining of neuron cells).
E. STATISTICAL ANALYSIS
The data were statistically analyzed using SPSS 11.5 software. The continuous variables are expressed as mean ± standard deviation (SD) categorical data were compared using independent t-test. A value of P<0.05 was considered statistically significant.
III. RESULTS
A AA
A. . . . BODY WEIGHT AND BODY COMPOSITION
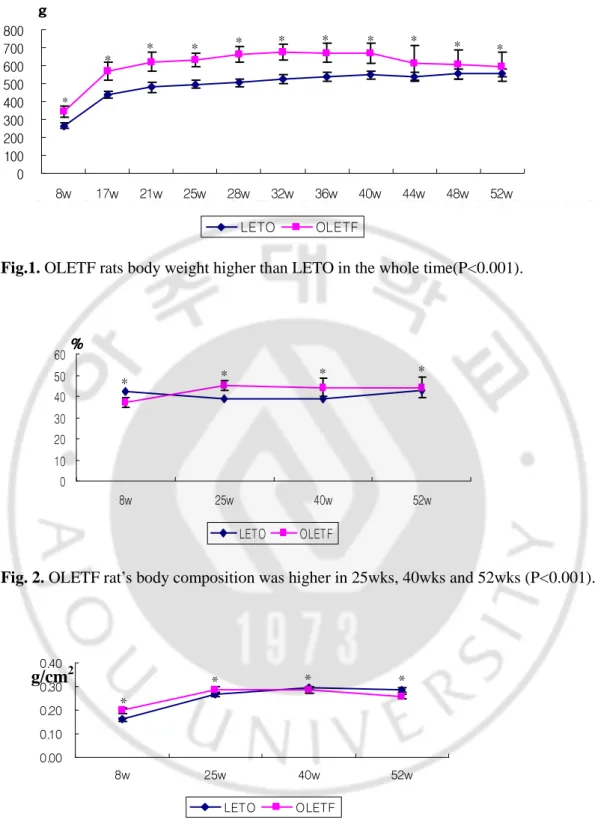
OLETF rat’s weight (Fig. 1.) was significant higher than LETO rat’s weight in the whole time (p<0.001), and the weight gaps were about 200g from 28wks to 40wks. OLETF rat’s body composition (Fig. 2.) was significant lower than LETO rat’s composition in 8wks, but significant higher in 25wks, 40wks and 52wks respectively (37.26±2.17 vs. 42.21±1.26, p<0.001; 44.89±2.26 vs. 38.93±1.44, p<0.001; 44.28±4.28 vs. 39.06±1.64, p<0.001; 44.09±4.85 vs. 42.69±1.62, p<0.001, respectively). OLETF rat’s femur BMD was significant higher than LETO rat’s in 8wks and 25wks (0.198±0.014 vs. 0.161±0.007, p<0.05; 0.285±0.014 vs. 0.267±0.011, p<0.05, respectively), but it was significant lower in 40wks and 52wks (0.284±0.012 vs. 0.293±0.008, p<0.05; 0.258±0.010 vs. 0.285±0.011, p<0.05, respectively) (Fig. 3.).
B. FASTING GLUCOSE AND HORMONES
In 25wks, 40wks and 52wks, OLETF rat’s fasting glucose was significantly higher than LETO rat’s (p<0.05). There was no difference between LETO rat’s insulin and OLETF rat’s insulin in 8wks; OLETF rat’s insulin was significant higher than LETO rat’s in 25wks and 40wks (p< 0.05); OLETF rat’s serum insulin was significant lower than LETO rat’s in 52wks (p<0.05). OLETF rat’s insulin was increased in 25wks and decreased in 40wks (p<0.05); LETO rat’s insulin was no significant difference during study. OLETF rat’s leptin was significant higher than LETO rat’s leptin in whole time (Table. 1), and the peak of OLETF rat’s letpin was found in 25wks.
OLETF rat’s serum testosterone was decreased in 25wk and definite lower in 40wks and in 52wks(p<0.05); OLETF rat’s serum IGF-I levels was significant higher than LETO rat’s in the whole time (p<0.05); OLETF rat’s free T4 was significant higher than LETO rat’s in 8wks and 25wks (p< 0.05); there was no significant difference in 40wks between two groups; OLETF rat’s free T4 was significant lower than LETO rat’s in 52wks (p<0.05); OLETF rat’s corticosterone was significant lower than LETO rat’s in 8wks (p<0.05), but significant higher in 25wks, 40wks and 52wks (p<0.05)(Table.1).
C. Ob-R AND NPY2-R PROTEIN EXPRESSION IN HYPOTHALAMIC ARCUATE
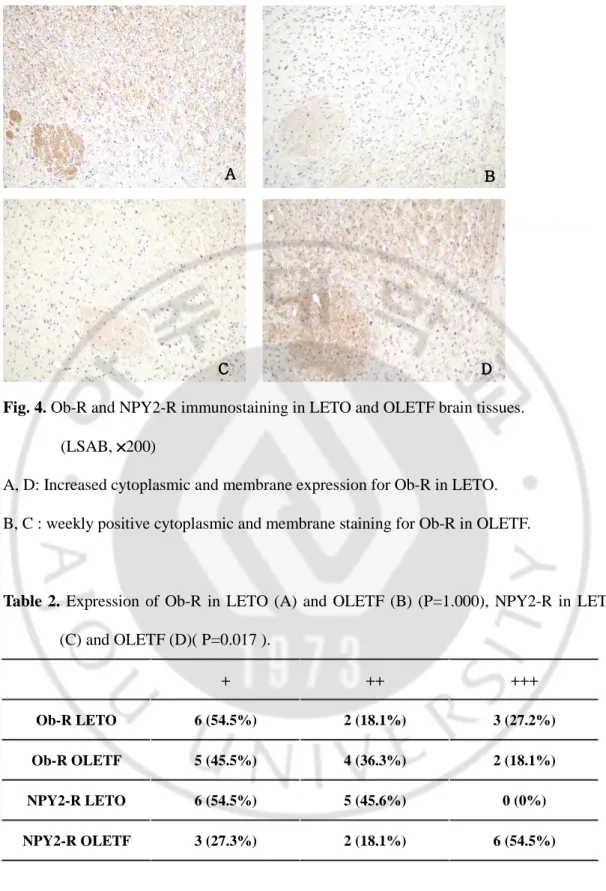
In hypothalamic arcuate of rat brain tissues Ob-R and NPY2-R consistently expressed in the membrane and cytoplasm of the neuron cells. Ob-R protein more highly expressed in LETO rat’s hypothalamic arcuate neuron cells but not statistically significant (p=1.000). LETO rat’s exhibited a variable degree for Ob-R protein expression: 3(+) in 27.2%, 2(+) in 18.1% and 1(+) in 54.5%. In OLETF rat’s brain tissues 3(+) Ob-R was seen only in 18.1% of cases, 2(+) and 1(+) was seen in 36.3% and 45.5% of cases respectively. NPY2-R protein significantly higher in OLETF rat’s hypothalamic arcuate neuron cells than LETO rat’s (p=0.017). In OLETF rat’s, 3(+) expression of NPY2 was seen in 54.5% OLETF rat’s hypothalamic arcuate neuron cells, but in LETO rat’s, there was no case showed 3(+) imuunoreactivity of expression of NPY2-R. (Fig. 4, Table. 2)
D D D
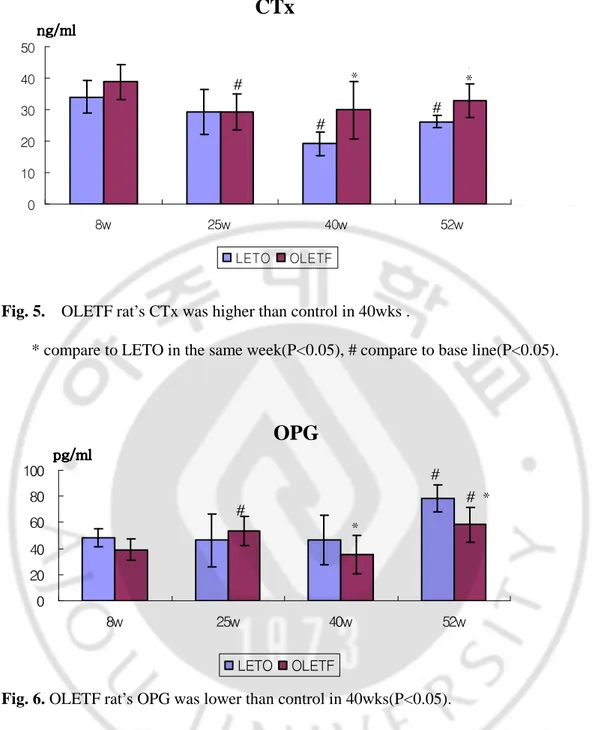
25wks (38.87±5.50 vs. 34.06±5.14, p>0.05; 29.30±5.67 vs. 29.26±7.11, p>0.05, respectively); but OLETF rat’s serum CTx was significant higher than LETO rat’s serum CTx from 40wks (29.90±9.20 vs. 19.20±3.81, p<0.05; 32.71±5.35 vs. 26.24±1.83, p<0.05, respectively) (Fig. 5). OLETF rat’s and LETO rat’s serum OPG were no significant difference in 8wks and 25wks; OLETF rat’s was significant lower than LETO rat’s in 40wks and 52wks (35.39±15.03 vs. 46.38±19.18, p<0.05; 72.39±20.56 vs. 70.55±43.935, p<0.05) (Fig. 6).
IV.
DISCUSSION
Bone metabolism, which was influenced by hormones, growth factors, and cytokines, orchestrate the activities of both osteoclast and osteoblast cells. Bone mass is maintained through a balance between bone formation and resorption, there are three possible mechanisms by which a lower bone volume can be achieved, the first is to decrease bone formation, the second is to increase bone resorption, and the third is combination of the first and the second. OLETF rat’s body weight and body composition was significant higher than LETO rat’s body weight and body composition, but OLETF rat’s bone mineraldensity was significant lower LETO rat’s from 40wks in this study.
Sex steroids and parathyroid hormone are well known hormones in regulating bone resorption. No hormone has been shown to control bone formation. As type II DM model, male OLETF rat was developed DM in 24wks, and the function of insulin secretion was reduced from 36week. In patients with Type II DM, male hypogonadism has been reported (Fushimi H et al, 1989). Although obesity or Type II DM is closely related to gonadal dysfunctions, details of the mechanism remain unclear (Kawano K et al, 1992). It is also well known, when the serum testosterone decreased, the osteoblast cell production of transforming growth factor- ß (TGF-ß) was also decreased. TGF-ß treatment increase bone formation parameters in vitro and in vivo and decreases osteoclaste cell survival in vitro. In this study, all of the OLETF rats are developed DM in 25wks, serum testosterone also decreased in 25wks. In 40wks and 52wks, that was the similar as the former study (KATSUMORI KOMAKI et al, 2005), and it leads to increase of bone resorption. Because
hormone in this study.
Conflicting reports existed in regarding the influence of impaired insulin secretion and metabolic control on bone metabolism (McNair P et al, 1979; Munoz-Torres M et al, 1996). In vivo, local insulin treatment to the hemicalvaria in nondiabetic mice increased osteoid volume and the number of osteoblasts (Cornish J et al, 1996). High extracellular glucose levels have been found to cause changes in osteoblastic gene expression (Hough S et al, 1981), inhibit osteoblast-like cell growth (Terada M et al, 1998) and promote osteoclastic bone resorption (Williams JP et al, 1997). From the change of OLETF rat’s insulin and fasting glucose in this study, we can infer that decreased insulin may decrease bone formation, high level of glucose may increase bone resorption.
Serum IGF-I was correlated with body composition and BMD has been confirmed in former study (H. N. Rosen et al, 1995). The IGF-I circulated in blood and interaction on epiphyseal growth plate increased unilateral bone growth significantly (J. Isgaard et al, 1986). In this study, OLETF rat serum IGF-I was higher than LETO in the whole time before 40wks, but decreased in 40wks indicated that bone formation may also decreased from 40wks.
It is well known that Glucocoid hormones increase bone resorption. Corticosterone is the main glucocoid hormone in rat, and the high level of corticosterone decrease bone formation; in human, glucocorticoid decrease osteoblast differentiation and increase bone loss. In this study, OLETF rat’s corticosterone was significant higher than LETO rat’s from 40wks to 52wks, so corticosterone may also influence the BMD.
Exceeded thyroid hormone stimulates bone resorption, resulting in increased bone turnover and both cortical and trabecular bone loss (Meunier PJ et al, 1972; Mosekilde L and Melsen F, 1978). In this study, the free T4 have no significant difference between two groups
in 40wks, indicated that free T4 may have no influence in bone metabolism of OLETF rat. Leptin is almost exclusively produced by fat with a very strong association between serum leptin and fat mass (Maffei M et al, 1995; Considine RV et al, 1996; Thomas T et al, 2000). Leptin’s effect on BMD is complex and likely to be mediated through direct and indirect mechanisms (Reseland JE and Gordeladze JO, 2002; Ruhl C and Everhart J, 2002; Reid IR and Comish J, 2004). Previous study showed that as a potent inhibitor of bone formation, leptin acting through the central nervous system in mice (Ducy et al, 2000), it enhances osteoblast formation and inhibits osteoclast generation (Holloway WR et al, 2002; Cornish J et al, 2002). Centrally, leptin has been shown to inhibit bone formation through a hypothalamic relay, an effect that is inhibited using blockers (Ducy P et al, 2000; Cock TA and Auwerx J, 2003). The leptin pathway acts both to stimulate bone formation when serum leptin levels are absent and to suppress bone formation when present in excess (Ducy, P. et al, 2000). OLETF rat serum leptin levels was significant higher than LETO rat from 8wks to 52wks, and in 8wks and in 25wks was significant higher BMD than LETO rat indicated that 8wks and 25wks serum leptin wasn’t exceeded, but from 40wks was exceeded. NPY2-R expressed strongly pattern in OLETF rat hypothalamic arcuate NPY2 was mediated with serum letpin, when leptin was higher, NPY2-R was over expressed, and it decreased bone formation. From Paul’s study (Paul A. Baldock et al, 2002), hypothalamic Y2 receptor deletion were significantly increased bone formation in mice. In this study, high level of serum leptin was observed from 8wks to 25wks indicated that serum leptin in this period was very important in evaluation of BMD. NPY2 in hypothalamic arcuate functions is also important in evaluation of BMD in post 40wks.
activator of NF-kB ligand (RANKL) regulation osteoclast specialization (Yasuda H et al, 1998). RANKL was position on membrain and combination with osteoclast progenitor receptor activator of nuclear factor kappa B (RANK), increase the osteoclast cell’s formation and activity. RANKL’s bone resorption activity was regulated with OPG, and OPG was combination with RANKL, and interrupt RANKL and RANK interaction than control inhibite osteoclast (Suda T et al, 1999; Hofbaner LC et al, 2000). From OPG level lower in OLETF rat than LETO rat in 40wks and 52wks, we found that the bone resorption in OLETF rat was more activity than LETO rat. CTx was formed depend on cathepsin K which is important enzyme of bone’s collegen resolution (Bonde M et al, 1997), because the high level of CTx was reflection excellent of resorption. OLETF rat’s CTx was higher than LETO in 40wks and 52wks in this study, both of bone resorption marker reflection that OLETF rat resorption was excellent in 40wks and 52wks than the LETO rat, it also indicated that OLETF rat’s bone resorption more activity than LETO rat from 40wks.
For the limitation of this study, body composition was measured with PIXImusII which is the model of small animal, the rat body was sectioned eight parts, and the data were combinded. All the rats were anethetized more than ten times and blood sample were collected five times, rat’s body weight was not increased significantly like other studies.
VI. CONCLUSION
OLETF rat had low bone density after 40wks of age and this finding could be correlated with low level of testosterone, high level of corticosterone and leptin in serum, and also NPY2-R over-expression in hypothalamic arcuate nuclei.
.
Fig. 1. OLETF rat’s weight was higher than LETO in whole time (P<0.001). Fig.1. OLETF rats body weight higher than LETO in the whole time(P<0.001).
Fig. 2. OLETF rat’s body composition was higher in 25wks, 40wks and 52wks (P<0.001).
Fig. 3. OLETF rat’s femur BMD was lower than LETO (P<0.05) in 40wks and 52wks. 0 100 200 300 400 500 600 700 800 8w 17w 21w 25w 28w 32w 36w 40w 44w 48w 52w LETO OLETF * * * * * * * * * * * g g g g 0.00 0.10 0.20 0.30 0.40 8w 25w 40w 52w LETO OLETF * * * * 0 10 20 30 40 50 60 8w 25w 40w 52w LETO OLETF * * * * % % % % g/cm2
Ta b l e 1 . F a s t i n g g l u c o s e , I n s u l i n , L e p t i n , Te s t o s t e r o n e , I G F - I , f r e e T 4 , a n d C o r t i c o s t e r o n e i n 8 w k s , 2 5 w k s , 4 0 w k s a n d 5 2 w k s . 8 w k s 2 5 w k s 4 0 w k s 5 2 w k s L E T O O L E T F L E T O O L E T F L E T O O L E T F L E T O O L E T F ( n = 1 1 ) ( n = 1 1 ) ( n = 1 1 ) ( n = 1 1 ) ( n = 1 1 ) ( n = 1 1 ) ( n = 1 1 ) ( n = 1 1 ) G l u c o s e - - - - - - 1 2 0 . 4 6 ± 6 . 6 4 1 3 5 . 7 8 ± 7 . 7 4* 1 5 9 . 8 6 ± 8 . 5 4 2 3 2 . 9 7 ± 1 8 . 7 7* 1 3 1 . 2 7 ± 2 3 . 5 0 3 2 2 . 2 6 ± 1 3 3 . 9 6* ( m g / d l ) I n s u l i n 0 . 5 4 9 ± 0 . 1 5 4 0 . 5 8 5 ± 0 . 1 0 0 0 . 7 3 ± 0 . 2 9 1 . 9 3 1 ± 0 . 4 9 3* # 0 . 6 0 ± 0 . 1 8 7 0 . 7 6 1 ± 0 . 4 3# 0 . 7 8 0 ± 0 . 2 0 9 0 . 6 3 1 ± 0 . 1 4 6 ( n g / m l ) L e p t i n 3 . 1 2 ± 1 . 0 4 7 . 0 4 ± 1 . 5 2* 1 0 . 6 8 ± 2 . 0 5# 2 9 . 7 9 ± 7 . 7 7* # 4 . 3 1 ± 0 . 7 9# 1 1 . 9 3 ± 5 . 2 1* # 6 . 8 9 ± 0 . 8 9# 5 . 8 9 ± 2 . 6 3# ( n g / m l ) ( n g / m l ) ( n g / m l ) ( n g / m l ) Te s t o s t o s t e r o n e 3 2 1 . 4 ± 1 5 1 . 2 3 4 9 . 7 ± 1 1 5 . 9 2 2 6 . 0 ± 9 4 . 1 1 7 6 . 5 ± 3 2 . 9# 2 1 8 . 7 ± 7 4 . 5 1 0 1 . 6 ± 3 6 . 5* # 1 6 6 . 7 ± 6 7 . 6 9 2 . 5 ± 1 8 . 2* ( n g / d L ) I G F - I 1 0 1 1 . 6 ± 4 4 . 3 1 2 8 8 . 4 ± 9 1 . 2* 1 0 4 3 . 5 ± 6 9 . 4 1 3 7 3 . 7 ± 1 5 5 . 7* 8 2 5 . 6 ± 3 4 . 0# 1 2 9 7 . 4 ± 1 5 8 . 4* 1 5 5 5 . 4 ± 1 4 1 . 9# 1 8 2 5 . 6 ± 1 5 5 . 9* # ( n g / m l ) f r e e T 4 1 . 2 8 4 ± 0 . 0 8 9 1 . 5 4 8 ± 0 . 1 6 5* 1 . 0 5 1 ± 0 . 1 1 3# 1 . 4 3 4 ± 0 . 0 8 7* # 1 . 0 4 8 ± 0 . 0 7 1 1 . 0 5 3 ± 0 . 0 7 9# 0 . 6 0 8 ± 0 . 0 7 3# 0 . 4 2 3 ± 0 . 0 8 2* # ( n g / d L ) C o r t i c o s t e r o n e 4 0 5 . 6 ± 4 1 . 4 2 6 2 . 2 ± 5 1 . 7* 1 9 5 . 3 ± 2 5 . 8 #2 4 1 . 4 ± 5 5 . 1* 3 5 0 . 0 ± 6 1 . 2# 4 1 5 . 9 ± 8 1 . 4# 2 0 1 . 3 ± 3 4 . 9 # 3 5 1 . 2 ± 6 3 . 3* ( n g / m l ) * : p < 0 . 0 5 c o m p a r e d t o L E T O . # : p < 0 . 0 5 c o m p a r e d t o b a s e l i n e
Fig. 4. Ob-R and NPY2-R immunostaining in LETO and OLETF brain tissues. (LSAB, ××××200)
A, D: Increased cytoplasmic and membrane expression for Ob-R in LETO. B, C : weekly positive cytoplasmic and membrane staining for Ob-R in OLETF.
Table 2. Expression of Ob-R in LETO (A) and OLETF (B) (P=1.000), NPY2-R in LETO (C) and OLETF (D)( P=0.017 ). + ++ +++ Ob-R LETO 6 (54.5%) 2 (18.1%) 3 (27.2%) Ob-R OLETF 5 (45.5%) 4 (36.3%) 2 (18.1%) NPY2-R LETO 6 (54.5%) 5 (45.6%) 0 (0%) NPY2-R OLETF 3 (27.3%) 2 (18.1%) 6 (54.5%) B BB B C C C C DDDD A A A A
Fig. 5. OLETF rat’s CTx was higher than control in 40wks .
* compare to LETO in the same week(P<0.05), # compare to base line(P<0.05).
Fig. 6. OLETF rat’s OPG was lower than control in 40wks(P<0.05).
* compare to LETO in the same week(P<0.05), # compare to base line(P<0.05).
0 10 20 30 40 50 8w 25w 40w 52w LETO OLETF * # * ng/ml ng/ml ng/ml ng/ml
CTx
0 20 40 60 80 100 8w 25w 40w 52w LETO OLETF * * pg/ml pg/ml pg/ml pg/mlOPG
# # # # # #REFERENCES
1. Baskin, D.G., Breininger, J.F., and Schwartz, M.W. Leptin receptor mRNA identifies a subpopulation of neuropeptide Y neurons activated by fasting in rat hypothalamus. Diabetes. 48:828-833, 1999
2. Bjurholm A: Neuroendocrine peptides in bone. Int Orthop.15(4):325-9,1991
3. Broberger, C., Landry, M., Wong, H et al. Subtypes Y1 and Y2 of the neuropeptide Y receptor are respectively expressed in pro-opiomelanocortin- and neuropeptide-Y-containing neurons of the rat hypothalamic arcuatee nucleus. Neuroendocrinology. 66:393-408, 1997
4. Bonde M, Garnero P, Fledelius C et al. Measurement of bone degradation products in serum using antibodies reactive with an isomerized form of an 8 aminoacid sequence of C-telopeptide of type 1 collagen. J Bone Miner Res 12(7):1028-34, 1997
5. Christensen JO, Svendsen OL. Bone mineral in pre- and postmenopausal women with insulin-dependent and non-insulindependent diabetes mellitus. Osteoporos Int 10:307– 311, 1999
6. Cinti S, Frederich RC, Zingaretti MC et al. Immunohistochemical localization of leptin and uncoupling protein in white and brown adipose tissue. Endocrinology 138:797-804, 1997
7. Cock TA, Auwerx J. Leptin: cutting the fat off the bone. Lancet 362:1572–1574, 2003
8. Considine RV, Sinha MK, Heiman ML et al. Serum immunoreactive- leptin concentrations in normal-weight and obese humans. N Engl J Med 334:292–29, 1996
9. Cornish J, Callon KE, Reid IR. Insulin increases histomorphometric indices of bone formation in vivo. Calcif Tissue Int 59:492–5, 1996
10. Cornish J, Callon KE, Bava U et al. Leptin directly regulates bone cell function in vitro and reduces bone fragility in vivo. J Endocrinol 175:405–415, 2002
11. Ducy, P., Amling, M., Takeda, S. et al. Leptin inhibits bone formation through a hypothalamic relay: a central control of bone mass. Cell 100:197-207, 2000
12. El Miedany YM, el Gaafary S, el Baddini MA. Osteoporosis in older adults with non-insulin-dependent diabetes mellitus: Is it sex related? Clin Exp Rheumatol 17:561–567, 1999
13. Felson DT, Zhang Y, Hannan MT et al. Effects of weight and body mass index on bone mineral density in men and women: the Framingham study. J Bone Miner Res 8:567-573, 1993
14. Friendman JM, Halaas JL. Leptin and the regulation of the body weight in mammals. Nature (Lond) 395:763-770, 1998
15. Fushimi H, Hovie H, Inoue T et al. Low testosterone levels in diabetic men and anmals: a possible role in testicular importance. Diabet Res Clin Pract 6: 297-301, 1989
16. Golden PL. Maccagnan TJ, Pardridge WM: Human blood-brain barrier leptin receptor. Binding and endocytosis in isolated human brain microvessels. J Clin Invest 99:14-18,
1997
17. Goodman WG, Hori MT. Diminished bone formation in experimental diabetes. Relationship to osteoid maturation and mineralization. Diabetes 33:825–831, 1984
18. Herzog H: Hypothalamic Y2 Receptors: Central Coordination of Energy Homeostasis and Bone Mass .Regulation.Drug News Perspect. 15(8):506-510, 2002
19. H. N. Rosen, V. Chen, A. Cittadini et al. Treatment with growth hormone and IGF-I in growing rats increases bone mineral content but not bone mineral density. J.Bone Miner, Res 10: 1352-1358, 1995
20. Hofbaner LC, Khosla S, Dunstan CR et al. The roles of osteoprotegerin and osteoprotegerin ligand in the paracrine regulation of bone resorption. J Bone Miner Res 15:2-12, 2000
21. Holloway WR, Collier FM, Aitken CJ et al. Leptin inhibits osteoclast generation. J Bone Miner Res 17:200–209, 2002
22. Hough S, Avioli LV, Bergfeld MA et al. Correction of abnormal bone and mineral metabolism in chronic streptozotocin-induced diabetes mellitus in the rat by insulin therapy. Endocrinology 108:2228–34, 1981
23. James F. Whitfield, PhD, Leptin—A New Member of the Bone Builders’ Club? FRSC.
24. J Cornish, K E Callon, U Bava et al. Leptin directly regulates bone cell function in vitro and reduces bone fragility in vivo Journal of Endocrinology 175:405–415, 2002
25. J. Isgaard, A. Nilsson, A. Lindahl et al. Effects of local administration of GH and IGF-I on longitudinal bone growth in rats. Am. J. Physio. 250:E367-E372, 1986
26. Kawano K, Hirashima T, Mori S et al. OLETF(Otsuka Long Evans Tokushima Fatty) rat; a new NIDDM rat strain. Diab Res Clin Pract 24:317-320, 1994
27. Kawano K, Hirashima T, Mori S et al. Spontaneous long-term hyperglycemic rat with diabetic complications. Diabetes 41:1422-1428, 1992
28. Kawano K, Hirashima T, Mori S et al. OLETF(Otsuka Long Evans Tokushima Fatty) rat; a new NIDDM rat strain. Diab Res Clin Pract 24:317-320, 1994
29. Kawano K, Hirashima T, Mori S et al. Spontaneously diabetic rat “OLETF” as a model for NIDDM in humans. In Frontiers in animal Diabetic Reserch. Lesson from Animal Diabetes II: ed. Shafrir E Boston Birkhauser :225-236,1996
30. KATSUMORI KOMAKI, YASUHIRO OHNO and NORIHIKO AOKI. Gonadal hormones and gonadal function in type 2 diabetes model OLETF(Otsuka Long Evans Tokushiwa Fatty)Rats. Endocrine Journal 52(3):345-351, 2005
31. Kazuya Kawano, Tsukasa Hirashima, Shigehito Mori et al. Establishment of the OLETF rat. Obesity and NIDDM. Lessons from the OLETF Rat. 1-11, 1999
32. King, P.J., Williams, G., Doods, H et al. Effect of a selective neuropeptide Y Y(2) receptor antagonist, BIIE0246 on neuropeptide Y release. Eur. J. Pharmacol. 396:R1- R3, 2000
33. Leidig-Bruckner G, Ziegler R. Diabetes mellitus a risk for osteoporosis? Exp Clin Endocrinol Diabetes 109(Suppl 2):S493–514, 2001
34. Maffei M, Halaas J, Ravussin E et al. Leptin levels in human and rodent: measurement of plasma leptin and ob RNA in obese and weight-reduced subjects. Nat Med 1:1155– 1161, 1995
35. Marie-Louise Håkansson, Hilary Brown, Nico Ghilardi et al. Leptin Receptor Immunoreactivity in Chemically Defined Target Neurons of the Hypothalamus.The Journal of Neuroscience. 18(1):559–572, 1998
36. McNair P, Madsbad S, Christiansen C et al. Bone loss in diabetes: effects of metabolic state. Diabetologia 17:283–6, 1979
37. Melanie Henry, Lorraine Ghibaudi, Jun Gao et al. Hwa: Energy Metabolic Profile of Mice after Chronic Activation of Central NPY Y1, Y2, or Y5 Receptors. OBESITY RESEARCH 13(1):36-47, 2005
38. Meunier PJ, Bianchi GCS, Edouard CM et al. Bony manifestations of thyrotoxicosis. Orthop ClinNorth Am 3:745–74, 1972
39. Mosekilde L, Melsen F. Effect of antithyroid treatment on calcium–phosphorus metabolism in hyperthyroidism. III. Bone histomorphometry. Acta Endocrino87:751–8, 1978
40. Munoz-Torres M, Jodar E, Escobar-Jimenez F et al. Bone mineral density measured by dual X-ray absorptiometry in Spanish patients with insulin-dependent diabetes mellitus. Calcif Tissue Int 58:316–9, 1996
41. PABLO BRUMOVSKY, DAVOR STANIC, SAM SHUSTER et al. .Neuropeptide Y2 Receptor Protein Is Present in Peptidergic and Nonpeptidergic Primary Sensory Neurons of the Mouse. THE JOURNAL OF COMPARATIVE NEUROLOGY 489:328– 348, 2005
42. Paul A Baldock, Amanda Sainsbury, Susan Allison et al. Hypothalamic Control of Bone Formation: Distinct Actions of Leptin and Y2 Receptor Pathways:JOURNAL OF BONE AND MINERAL RESEARCH 20(10):1851-1857, 2005
43. Reid IR, Comish J. Direct actions of leptin on bone remodeling. Calcif Tissue Int 74:313–316,2004
44. Reseland JE, Gordeladze JO. Role of leptin in bone growth: central player or peripheral supporter? FEBS Lett 528:40–42, 2002
46. Robert S. Weinstein, Robert L. Jilka, A. Michael Parfitt, and Stavros C. Manolagas. Inhibition of Osteoblastogenesis and Promotion of Apoptosis of Osteoblasts andOsteocytes by Glucocorticoids. J. Clin. Invest 102: 274-282, 1998
47. Ruhl C, Everhart J. Relationship of serum leptin concentration with bone mineral density in the United States population. J Bone Miner Res 17:1896–1903, 2002
48. SHENG BI, ELLEN E. LADENHEIM, GARY J. SCHWARTZ et al. MORAN :role for NPY overexpression in the dorsomedial hypothalamus in hyperphagia and obesity of OLETF rats :Am J Physiol Regulatory Integrative Comp Physiol. 281:R254-R260, 2001
49. Shires R, Teitelbaum SL, Bergfeld MA et al.The effect of streptozotocin-induced chronic diabetes mellitus on bone and mineral homeostasis in the rat. J Lab Clin Med 97:231–240, 1981
50. SHU TAKEDA and GERARD KARSENTY. Central control of bone formation. J Bone Miner Metab 19: 195-198, 2001
51. Stephens, T.W. et al.. The role of neuropeptide Y in the antiobesity action of the obese gene product. Nature. 377:530-532, 1995
52. Suda T, Takahashi N, Udagawa N et al. Modulation of osteoclast differentiation and function by the new members of the tumor necrosis factor receptor and ligand families. Endocrine Rev 20: 345-357, 1999
53. Terada M, Inaba M, Yano Y et al. Growth-inhibitory effect of a high glucose concentration on osteoblast-like cells. Bone 22:17–23, 1998
54. Thomas T, Burguera B, Melton III LJ et al. Relationship of serum leptin levels with body composition, sex steroid, and insulin levels in men and women. Metabolism 49:1278–1284, 2000
55. Ulrika Smedh,,CA Marie-Louise Håkansson, Björn Meister and Kersten Uvnäs Moberg. Leptin injected into the fourth ventricle inhibits gastric emptying .NeuroReport 9:297–301, 1998
56. Weinstock RS, Goland RS, Shane E et al. Bone mineral density in women with type II diabetes mellitus. J Bone Miner Res 4:97–101, 1989
57. Williams JP, Blair HC, McDonald JM et al. Regulation of osteoclastic bone resorption by glucose. Biochem Biophys Res Commun 235:646–51, 1997
58. Yasuda H, Shima N, Nakagawa N et al. osteoclast differentiation factor is a ligand for osteoprotegerin/osteoclastogenesis-inhibitory factor and is identical to TRANCE/RANK. Proc Natl Acad Sci U.S.A 95:3597-3602, 1998
59. Yun-Jung Leea, Jung-Hyun Parkb, Sung-Kyu Juc et al. _Leptin receptor isoform expression in rat osteoblasts and their functional analysis :FEBS Letters 528 :43-47, 2002
-국문요약국문요약국문요약국문요약-
OLETF쥐
쥐
쥐
쥐 골대사
골대사
골대사
골대사 변화
변화
변화
변화
아주대학교 아주대학교아주대학교 아주대학교 대학원대학원대학원대학원 의학과의학과의학과 의학과 신 신신 신 영영영영 희희희희 (지도교수지도교수지도교수지도교수: 정정정 윤정 윤윤윤 석석석석) 배경 배경배경 배경: OLETF쥐는 제2형 당뇨병 모델 쥐이다. 골대사는 호르몬이나 성장인자, cytokines, 조 골세포와 파골세포의 활성의 영향을 받는다. 제2형 당뇨병은 골대사에 영향을 주며 hypothalamic arcuate의 렙틴과 NPY2은 조골세포의 활성을 조절함으로써 뼈의 생성을 지배 한다. 본 연구의 목적은 OLETF쥐와 LETO쥐에서 8주에서 52주 사이의 골대사 변화를 관 찰하는 것이다. 대상 대상대상 대상 및및및및 방법방법방법: 11마리의 OLETF 웅성 쥐와 연령을 맞춘 11마리의 LETO 웅성 쥐를 대상방법 으로 하였다. 8주, 25주, 40주, 52주에 마취한 후 채혈하여 혈청을 얻고 골밀도와 체조성을 측정하였다. 25주에는 IPGTT를 시행하여 모든 OLETF쥐에서 당뇨병이 진행되었음을 확인 하였다. 52주에 쥐를 희생시켜 대뇌의 hypothalamic arcuate에서 랩틴과 NPY2 수용체의 발 현을 면역조직학방법으로 관찰하였다. 혈청에서 각종 호르몬과 성장인자, 골대사 표지자 를 측정하였다. 결과 결과결과 결과: 체중, 체조성은 모든 시기에 OLETF쥐에서 LETO쥐보다 높았다 (P<0.001). 그러나 골밀도는 40주부터 대조군보다 통계적으로 의미있게 낮았다 (p<0.05). OLETF쥐 뇌의 hypothalamic arcuate의 NPY2의 수용체는 LETO쥐보다 강하게 발현되었다. OLETF 쥐의 테 스토스테론은 25주부터 감소하다가 40주와 52주에는 통계적으로 명확하게 LETO쥐보다 낮아진다 (P<0.05). OLETF쥐의 혈청내의 렙틴, IGF-I과 인슐린의 농도는 모든 시기에 대조 군보다 높았다 (P<0.05). free T4는 8주와 25주에는 높았다가 (P<0.05), 40주에는 대조군과 차이를 보이지 않았으며, 52주에는 오히려 낮았다. 코르티코스테론은 8주에는 낮으나 (P<0.05), 25주, 40주, 52주에는 대조군보다 높았다 (P<0.05). 40주와 52주의 OLETF쥐의 혈 청 CTx 는 대조군보다 높으나 (P<0.05), OPG는 오히려 낮았다 (P<0.05).결론 결론결론
결론: OLETF쥐에서 40주부터 골밀도가 낮게 나타난 것은 혈액내의 고농도의 렙틴, 그리 고 hypothalamic arcuate에서 NPY2수용체의 과발현과 연관이 있으며, 40주부터 성선기능이 저하되고 코르티코스테론이 과분비되어 혈액내의 렙틴과 hypothalamic arcuate의 NPY2로 인한 골흡수 증가를 감당할 수 없기 때문으로 생각된다.
핵심되는 핵심되는핵심되는