2014; 39(2): 1-12
† Corresponding Author: Hyeon Chang Kim, PhD
Department of Preventive Medicine, Yonsei University College of Medicine, 50 Yonsei-ro, Seodaemun-gu, Seoul 120-752, Korea. Tel: +82-2-2228-1873
E-mail: [email protected]
* This study was supported by grants from the Korean Health Technology R&D Project (HI13C0715). [접수일: 2014년 06월 11일, 수정일: 2014년 08월 12일, 게재확정일: 2014년 10월 06일]
Abstract
Ji Hye Park1),
Hyeon Chang Kim
2)†,Ju-Mi Lee
2),Dong Phil Choi
1),Bo Mi Song
1),Seung Won Lee
1),Hansol Choi
1),Joo Young Lee
2),Il Suh
2)1)Department of Public Health, Yonsei University Graduate School 2)Department of Preventive Medicine, Yonsei University College of Medicine
Objectives: We investigated anthropometric measures of obesity, including body mass index (BMI),
waist circumference (WC), and waist-to-height ratio (WHtR) in their associations with metabolic abnormalities in Korean adults.
Methods: Study participants were 1,399 male and 2,325 female community dwellers aged 40-79 years.
Assessed metabolic variables included blood pressure, fasting glucose, insulin resistance, triglycerides, HDL cholesterol, LDL cholesterol, alanine aminotransferase, and gamma-glutamyl transferase. Associations of anthropometric measures per 1-SD increase with each metabolic abnormality were assessed using logistic regression analysis.
Results: The adiposity measurements were significantly associated with all of the metabolic abnormalities,
only except for with LDL cholesterol in men. In men, hypertension was more strongly associated withBMI (OR=1.58) than WC (OR=1.40) or WHtR (OR=1.44) or WHtR (OR=1.75); and hypertriglyceridemia was more closely associated with WC (OR=1.91) than BMI (OR=1.79) or WHtR (OR=1.87). In women, three adiposity measurements had similar association with metabolic abnormalities.
Conclusions: Simple anthropometric measurements can be used to screen high-risk individuals of
metabolic abnormalities in Korean men and women, although certain obesity indicators are more strongly with a specific kind of metabolic abnormality in men.
Keywords: Metabolic abnormalities, Anthropometric measures, Body mass index, Waist circumference,
Waist-to-height ratio
Measures of Adiposity in the Identification of Metabolic
Abnormalities in Middle-aged and Older Korean Adults
Ⅰ. INTRODUCTION
The metabolic syndrome is defined by a clustering of multiple metabolic abnormalities including impaired glucose, insulin resistance, high blood pressure, dyslipidemia [1]. The syndrome frequently accompanies other metabolic abnormalities such as nonalcoholic fatty liver disease (NAFLD) or elevated liver enzyme or chronic inflammation [2-4]. The rapid socioeconomic growth in Korea has caused in lifestyle changes, such as Westernized diet and sedentary behavior, which have led to an increase in the prevalence of metabolic syndrome from 24.9% in 1998 to 31.3% in 2007 [5]. This increasing prevalence is of considerable concern because many studies show that people with the metabolic abnormalities are at increased risk for developing diabetes mellitus and cardiovascular disease [6,7]. Obesity is a strong risk factor for metabolic disorders. Body mass index (BMI) is the most commonly used measure of obesity, but its relation with abdominal visceral fat is dependent on age and gender [8]. Ageing is associated with increase in fat mass and decreases in fat-free mass even if body weight remains stable [9]. Moreover, BMI cannot measure the change of body fat distribution in the elderly. Therefore, BMI is a weak indicator of metabolic abnormalities [10,11]. Since many studies reported that abdominal obesity is more important to the metabolic abnormalities [12-14], waist circumference (WC) [15-17] and waist-to-height ratio (WHtR) [18-20] have been suggested to measure abdominal obesity. Several investigators have concluded that the WC and WHtR are more strongly associated with metabolic abnormalities than BMI is. Plenty of
data are available on the relationship between obesity and adverse health outcomes in the Western populations. However there is only limited number of community-based studies which examined the association of anthropometric indices of obesity with metabolic abnormalities in Koreans. Therefore, we evaluated the associations between anthropometric indices of obesity and metabolic abnormalities among community-dwelling Korean adults. We additionally sought evidence as to identify the best anthropometric predictor of the metabolic abnormalities.
Ⅱ. METHODS
A. Participants
This is a cross-sectional investigation analyzing baseline data collected for a prospective community-based cohort study of the Korean genome epidemiology study (KoGES). Subjects of the current investigation were 4,828 people who were enrolled between 2008 and 2010, aged 40-79 years, and living in the community of Kangwha Island, Incheon, South Korea. Among them, we excluded 1,104 participants who were using antihypertensives, antidiabetics, or lipid lowering drugs and/ or having a history of cardiovascular disease, cancer, or fatty liver disease. Finally, 3,724 participants (1,399 men and 2,325women) were eligible for the current analysis. All participants provided written informed consents, and the study protocol was approved by the Institutional Review Board.B. Definition of Metabolic Abnormalities
high blood pressure (systolic blood pressure≥140 mmHg or diastolic blood pressure ≥90 mmHg) [21], 2) high fasting glucose (≥126 mg/dL) [22], 3) high insulin resistance (homeostasis model assessment of insulin resistance ≥2.5) [23], 4) high triglycerides (≥150 mg/dL) [24], 5) low high-density lipoprotein (HDL) cholesterol (<40 mg/dL) [24], 6) high low-density lipoprotein (LDL) cholesterol (≥160 mg/dL) [24], 7) high alanine aminotransferase (ALT) (≥43 IU/L), 8) high gamma-glutamyl transferase (GGT) (>50 IU/L) [25].
C. Measurements
Detailed methods for the measurements were previously reported elsewhere [26,27]. Participants were individually interviewed using standardized questionnaires to obtain information about their general characteristics, medical history, medication use, and lifestyle behaviors, such as smoking (current smokers or nonsmokers), alcohol intake (current alcohol drinkers or nondrinkers), and level of exercise (regular exercise or no exercise). The anthropometric measurements included height, weight, and waist circumference. We measured height and weight with subjects in light clothing and calculated BMI by dividing weight by height (kg/m2).
Waist circumference was measured mid-level between the inferior margin of the ribs and the superior border of iliac crest using a tape measure (SECA-200; SECA, Hamburg, Germany). The WHtR was calculated as the ratio of waist circumference and height. Resting blood pressure was measured twice by an automatic sphygmomanometer (Dinamap 1846 SX/P; GE Healthcare, Waukesha, WI, USA) with the participant in the sitting
position at least 5 minute intervals. If the difference between the first and second measurement was more than 10 mmHg, a third measurement was performed. The average of the last two measurements was used for the analysis. Blood samples were collected from the antecubital vein after at least an 8 hour fast. Enzymatic methods were applied to measure fasting plasma glucose, triglycerides, total cholesterol, HDL cholesterol, hemoglobin A1c (HbA1c), insulin, C-reactive protein (CRP), ALT and GGT (ADVIA 1650; Siemens Healthcare Diagnostics Inc., Deerfield, IL, USA). LDL cholesterol was calculated using the Friedewald’ method [28]. The measure for insulin resistance, the homeostasis model assessment of insulin resistance (HOMA-IR), was calculated as fasting insulin (U/mL)×fasting glucose (mg/dL)/405 [29].
D. Statistical Analyses
Comparison between men and women was made using independent t-test and chi-square test. Since some variables included in the analysis were markedly skewed, Spearman correlation coefficients were used to determine correlation between obesity indices and metabolic risk factors. Multiple logistic regression analysis was used to assess the odds ratio for the individual metabolic abnormalities per one unit increase in the measures of adiposity. Furthermore, the receiver operating characteristic (ROC) analysis was used to compare the discriminative power of BMI, WC, and WHtR. All statistical analyses were performed using SAS version 9.2 (SAS Inc., Cary, NC, USA).
Ⅲ. RESULTS
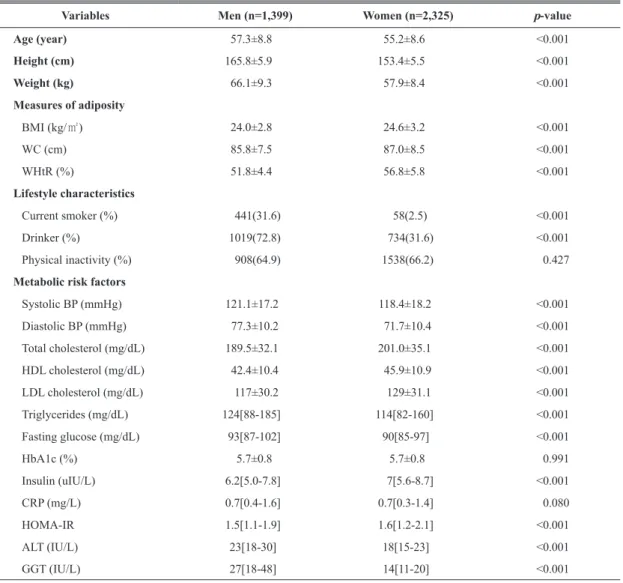
General characteristics for men and women participants were shown in Table 1. The variables were significantly different between men and women, with the exception of HbA1c and CRP.
Men had higher blood pressure, triglycerides, fasting glucose and liver enzyme than women. Women had higher BMI, WC, WHtR, total cholesterol, HDL cholesterol, LDL cholesterol, insulin and HOMA-IR than men.
Table 1. General characteristics and anthropometric measurements
Data are expressed as means ±standard deviation, median [inter quartile range]
BMI: body mass index, WC: waist circumference, WHtR: waist to height ratio,BP: bloodpressure, HDL: high density lipoprotein, LDL: low density lipoprotein, CRP: C-reactive protein, HOMA-IR: homeostasis model for insulin resistance, ALT: alanine aminotransferase, GGT: gamma-glutamyl transferase
Variables Men (n=1,399) Women (n=2,325) p-value
Age (year) 57.3±8.8 55.2±8.6 <0.001 Height (cm) 165.8±5.9 153.4±5.5 <0.001 Weight (kg) 66.1±9.3 57.9±8.4 <0.001 Measures of adiposity BMI (kg/㎡) 24.0±2.8 24.6±3.2 <0.001 WC (cm) 85.8±7.5 87.0±8.5 <0.001 WHtR (%) 51.8±4.4 56.8±5.8 <0.001 Lifestyle characteristics Current smoker (%) 441(31.6) 58(2.5) <0.001 Drinker (%) 1019(72.8) 734(31.6) <0.001 Physical inactivity (%) 908(64.9) 1538(66.2) 0.427
Metabolic risk factors
Systolic BP (mmHg) 121.1±17.2 118.4±18.2 <0.001 Diastolic BP (mmHg) 77.3±10.2 71.7±10.4 <0.001 Total cholesterol (mg/dL) 189.5±32.1 201.0±35.1 <0.001 HDL cholesterol (mg/dL) 42.4±10.4 45.9±10.9 <0.001 LDL cholesterol (mg/dL) 117±30.2 129±31.1 <0.001 Triglycerides (mg/dL) 124[88-185] 114[82-160] <0.001 Fasting glucose (mg/dL) 93[87-102] 90[85-97] <0.001 HbA1c (%) 5.7±0.8 5.7±0.8 0.991 Insulin (uIU/L) 6.2[5.0-7.8] 7[5.6-8.7] <0.001 CRP (mg/L) 0.7[0.4-1.6] 0.7[0.3-1.4] 0.080 HOMA-IR 1.5[1.1-1.9] 1.6[1.2-2.1] <0.001 ALT (IU/L) 23[18-30] 18[15-23] <0.001 GGT (IU/L) 27[18-48] 14[11-20] <0.001
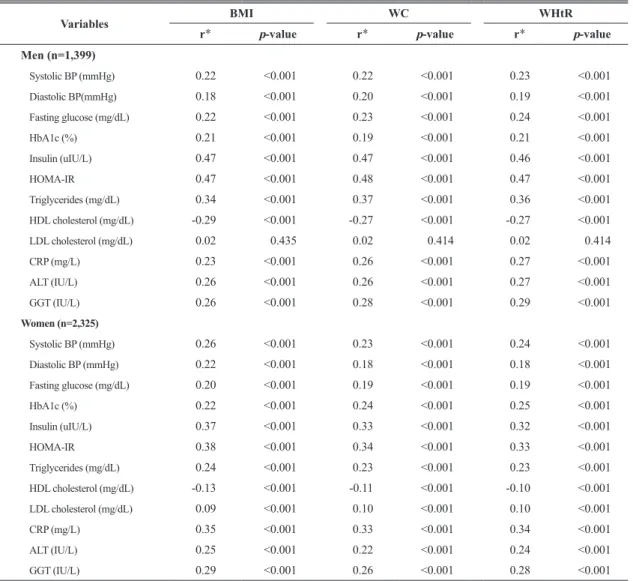
Table 2 shows correlation coefficients between obesity indices and metabolic variables, after adjusting for age, smoking, physical activity, and alcohol intake. BMI, WC and WHtR are all significantly correlated with blood pressure, fasting glucose, HbA1c, insulin, HOMA-IR,
triglycerides, HDL cholesterol, CRP, ALT and GGT in both sexes. However, the correlation between obesity indices and LDL cholesterol, was significantonly in women (p<0.001), but not in men (p=0.435).
*Partial Spearman coefficient adjusted for age, smoking, physical activity, and alcohol intake.
BMI: body mass index, WC: waist circumference, WHtR: waist to height ratio, BP: blood pressure, HDL: high density lipoprotein, LDL: low density lipoprotein, HOMA-IR: homeostasis model for insulin resistance, CRP: C-reactive protein, ALT: alanine aminotransferase, GGT: gamma-glutamyl transferase
Variables BMI WC WHtR
r* p-value r* p-value r* p-value
Men (n=1,399) Systolic BP (mmHg) 0.22 <0.001 0.22 <0.001 0.23 <0.001 Diastolic BP(mmHg) 0.18 <0.001 0.20 <0.001 0.19 <0.001 Fasting glucose (mg/dL) 0.22 <0.001 0.23 <0.001 0.24 <0.001 HbA1c (%) 0.21 <0.001 0.19 <0.001 0.21 <0.001 Insulin (uIU/L) 0.47 <0.001 0.47 <0.001 0.46 <0.001 HOMA-IR 0.47 <0.001 0.48 <0.001 0.47 <0.001 Triglycerides (mg/dL) 0.34 <0.001 0.37 <0.001 0.36 <0.001 HDL cholesterol (mg/dL) -0.29 <0.001 -0.27 <0.001 -0.27 <0.001 LDL cholesterol (mg/dL) 0.02 0.435 0.02 0.414 0.02 0.414 CRP (mg/L) 0.23 <0.001 0.26 <0.001 0.27 <0.001 ALT (IU/L) 0.26 <0.001 0.26 <0.001 0.27 <0.001 GGT (IU/L) 0.26 <0.001 0.28 <0.001 0.29 <0.001 Women (n=2,325) Systolic BP (mmHg) 0.26 <0.001 0.23 <0.001 0.24 <0.001 Diastolic BP (mmHg) 0.22 <0.001 0.18 <0.001 0.18 <0.001 Fasting glucose (mg/dL) 0.20 <0.001 0.19 <0.001 0.19 <0.001 HbA1c (%) 0.22 <0.001 0.24 <0.001 0.25 <0.001 Insulin (uIU/L) 0.37 <0.001 0.33 <0.001 0.32 <0.001 HOMA-IR 0.38 <0.001 0.34 <0.001 0.33 <0.001 Triglycerides (mg/dL) 0.24 <0.001 0.23 <0.001 0.23 <0.001 HDL cholesterol (mg/dL) -0.13 <0.001 -0.11 <0.001 -0.10 <0.001 LDL cholesterol (mg/dL) 0.09 <0.001 0.10 <0.001 0.10 <0.001 CRP (mg/L) 0.35 <0.001 0.33 <0.001 0.34 <0.001 ALT (IU/L) 0.25 <0.001 0.22 <0.001 0.24 <0.001 GGT (IU/L) 0.29 <0.001 0.26 <0.001 0.28 <0.001
Table 3. Association with anthropometric obesity indices and metabolic abnormalities
Adjustment for age, smoking, physical activity, and alcohol intake.
1)high blood pressure (a systolic blood pressure ≥140 mmHg or diastolic blood pressure ≥90 mmHg [21], 2)high fasting glucose (≥126 mg/dL)
[22], 3)high insulin resistance (defined as HOMA-IR ≥2.5) [23], 4)high triglycerides (≥150 mg/dL) [24], 5)low HDL cholesterol (<40 mg/dL) [24], 6)high LDL cholesterol (≥160 mg/dL) [24], 7)high ALT (≥43 IU/L), 8)high GGT (>50 IU/L) [25]
BMI: body mass index, WC: waist circumference, WHtR: waist to height ratio, HDL: high density lipoprotein, LDL: low density lipoprotein, HOMA-IR: homeostasis model for insulin resistance, ALT: alanine aminotransferase, GGT: gamma-glutamyl transferase
Metabolic abnormalities Odds ratio (95% confidence interval) per 1-SD increase in
BMI WC WHtR
Men (n=1,399)
High blood pressure1) 1.58 (1.29, 1.93) 1.40 (1.14, 1.71) 1.44 (1.17, 1.76)
High glucose2) 1.44 (1.14, 1.84) 1.79 (1.40, 2.30) 1.75 (1.37, 2.24) High HOMA-IR3) 2.54 (2.10, 3.07) 2.55 (2.11, 3.08) 2.44 (2.02, 2.95) High triglycerides4) 1.79 (1.58, 2.03) 1.91 (1.68, 2.17) 1.87 (1.64, 2.12) Low HDL cholesterol5) 1.68 (1.50, 1.90) 1.64 (1.46, 1.84) 1.63 (1.45, 1.83) High LDL cholesterol6) 1.03 (0.85, 1.26) 1.15 (0.95, 1.39) 1.17 (0.97, 1.42) High ALT7) 1.70 (1.41, 2.07) 1.64 (1.35, 1.99) 1.74 (1.43, 2.12) High GGT8) 1.43 (1.24, 1.63) 1.48 (1.29, 1.70) 1.51 (1.31, 1.73) Women (n=2,325)
High blood pressure1) 1.32 (1.09, 1.61) 1.34 (1.08, 1.68) 1.29 (1.02, 1.62)
High glucose2) 1.98 (1.65, 2.38) 2.01 (1.61, 2.51) 1.92 (1.52, 2.42) High HOMA-IR3) 2.25 (1.99, 2.55) 2.28 (1.99, 2.60) 2.20 (1.92, 2.52) High triglycerides4) 1.47 (1.34, 1.61) 1.55 (1.40, 1.70) 1.56 (1.41, 1.72) Low HDL cholesterol5) 1.24 (1.13, 1.35) 1.19 (1.09, 1.30) 1.17 (1.06, 1.28) High LDL cholesterol6) 1.17 (1.05, 1.30) 1.23 (1.09, 1.37) 1.23 (1.09, 1.39) High ALT7) 1.82 (1.51, 2.18) 1.89 (1.52, 2.36) 2.01 (1.60, 2.53) High GGT8) 1.72 (1.46, 2.04) 1.74 (1.42, 2.12) 1.86 (1.51, 2.30) Table 3 shows the odds ratio for each metabolic abnormality associated with one unit increase in the adiposity measurements, after adjusting for age, smoking, physical activity, and alcohol intake. The adiposity measurements were associated with all of the metabolic abnormalities. Exceptionally, high LDL cholesterol level in men was not associated with any of obesity measures. In male subjects,
among the three adiposity measurements, BMI was most strongly associated with high blood pressure (OR: 1.58, 95% CI: 1.29-1.93) WC was most strongly associated with high fasting glucose (OR: 1.79, 95% CI: 1.40-2.30) and high triglycerides (OR: 1.91, 95% CI: 1.68-2.17). However, in women, all three adiposity measures showed similar magnitude of associations with metabolic abnormalities.
Table 4. Receiver operating characteristic curve of anthropometric obesity indices and metabolic abnormalities
1)high blood pressure (a systolic blood pressure ≥140 mmHg or diastolic blood pressure ≥90 mmHg [21], 2)high fasting glucose (≥126 mg/dL)
[22], 3)high insulin resistance (defined as HOMA-IR ≥2.5) [23], 4)high triglycerides (≥150 mg/dL) [24], 5)low HDL cholesterol (<40 mg/dL) [24], 6)high LDL cholesterol (≥160 mg/dL) [24], 7)high ALT (≥43 IU/L), 8)high GGT (>50 IU/L) [25]
AUC: area under the receiver operating characteristic curve, CI: confidence interval, BMI: body mass index, WC: waist circumference, WHtR: waist to height ratio, HDL: high density lipoprotein, LDL: low density lipoprotein, HOMA-IR: homeostasis model for insulin resistance, ALT: alanine aminotransferase, GGT: gamma-glutamyl transferase
Metabolic abnormalities BMI WC WHtR
AUC (95% CI) AUC (95% CI) AUC (95% CI)
Men (n=1,399)
High blood pressure1) 0.633 (0.58, 0.69) 0.608 (0.55, 0.67) 0.603 (0.55, 0.66)
High glucose2) 0.603 (0.54, 0.67) 0.654 (0.59, 0.72) 0.654 (0.59, 0.72) High HOMA-IR3) 0.735 (0.69, 0.78) 0.736 (0.70, 0.78) 0.715 (0.67, 0.76) High triglycerides4) 0.642 (0.61, 0.67) 0.627 (0.60, 0.66) 0.624 (0.60, 0.65) Low HDL cholesterol5) 0.655 (0.63, 0.68) 0.669 (0.64, 0.70) 0.651 (0.62, 0.68) High LDL cholesterol6) 0.507 (0.45, 0.56) 0.533 (0.48, 0.59) 0.530 (0.48, 0.59) High ALT7) 0.643 (0.59, 0.70) 0.653 (0.60, 0.71) 0.642 (0.59, 0.69) High GGT8) 0.598 (0.56, 0.63) 0.617 (0.58, 0.65) 0.601 (0.57, 0.64) Women (n=2,325)
High blood pressure1) 0.583 (0.51, 0.66) 0.572 (0.50, 0.65) 0.543 (0.49, 0.60)
High glucose2) 0.692 (0.60, 0.78) 0.679 (0.60, 0.76) 0.675 (0.61, 0.74) High HOMA-IR3) 0.722 (0.67, 0.78) 0.710 (0.66, 0.76) 0.697 (0.67, 0.73) High triglycerides4) 0.619 (0.58, 0.66) 0.634 (0.60, 0.67) 0.643 (0.62, 0.67) Low HDL cholesterol5) 0.566 (0.53, 0.60) 0.562 (0.53, 0.60) 0.562 (0.54, 0.59) High LDL cholesterol6) 0.552 (0.48, 0.63) 0.571 (0.51, 0.63) 0.573 (0.54, 0.61) High ALT7) 0.655 (0.59, 0.73) 0.664 (0.60, 0.73) 0.672 (0.61, 0.73) High GGT8) 0.656 (0.61, 0.70) 0.646 (0.60, 0.69) 0.654 (0.60, 0.71) the AUC of BMI was greater than that of WC or WHtR in the prediction of high blood pressure, high fasting glucose, high HOMA-IR, low HDL cholesterol, and high GGT the AUC of WHtR was greater than that of BMI or WC in the prediction of high triglycerides, high LDL cholesterol, and high ALT. The area under the curve (AUC) of the three anthropometric indices in the prediction of metabolic abnormalities are shown in Table 4. In men, the AUC of WC was greater than that of BMI or WHtR in the prediction of high fasting glucose, high HOMA-IR, low HDL cholesterol, high LDL cholesterol, high ALT, and high GGT. In women,
Ⅳ. DISCUSSION
This study showed strong associations between anthropometric measures and metabolic abnormalities in apparently healthy Korean adults. In male adults, BMI was more closely association with high blood pressure, while WC was more closely associated with high glucose and triglycerides. On the basis of discriminative power, BMI and WHtR were better predictors of metabolic abnormalities than WC in female, whereas WC is the best predictor in male. Among various measurements of obesity, BMI is the most frequently used in epidemiologic and clinical studies. However, BMI is not a good measure of visceral fat, the key determinant of metabolic abnormalities. Some authors have reported that WC and WHtR are better at predicting metabolic risk factors [30-32]. Compared to BMI, WC is more sensitive because increase of muscle mass might lead to little change of BMI but apparent changes in WC and WHtR. In the practice, WC can be a more convenient measure than WHtR, since ratios generally have larger measurement error than both their numerators and denominators [33-35]. On the other hand, WHtR can be used widely from children to adults with support of consumer-friendly conversion charts, but WC may not suit all groups and does not reflect body stature [36]. Some studies reported that WHtR correlates better with body fat mass than WC does [37].These results suggest that BMI, WC, and WHtR may have different associations with metabolic abnormalities.
In our analysis, all of BMI, WC and WHtR showed strong associations with metabolic
abnormalities, although certain obesity indicators are more strongly with a specific kind of metabolic abnormality in male adults. More specifically, high blood pressure was more strongly associated with BMI, and high fasting glucose and triglycerides levels were more closely associated with WC. In addition, we used ROC analysis to address the issue of discriminative performance. WC seems to be a better predictor of metabolic abnormality in men, while BMI and WHtR seem to be better than BMI in women. However, the difference in the magnitude of association and discriminative power was not big enough to choose the single best index. Our findings are only in partial agreement with the observation that specific simple anthropometric index is helpful for predicting the metabolic abnormalities in Korean adults [38,39]. We would like to recommend measuring BMI, WC and WHtR in health screenings, because all the three indices can be easily measured together and we can predict better a specific component of metabolic abnormalities by measuring three indices.
This study has the following limitations. First, the current study had no data directly assessing deposition of central fat such as dual X-ray absorptiometry body composition analysis. Thus, we could not address the relationship between direct measures of regional fat distribution and metabolic abnormalities. Second, our analysis was based on a cohort study from one rural area and limited to relatively healthy individuals. Thus, these results cannot be generalized for the entire Korean adult population. Third, this is a cross-sectional analysis. We could not determine whether the anthropometric measures predict change in metabolic profile or onset of new
metabolic abnormalities.
Since metabolic syndrome or its individual metabolic abnormalities predict future risk of cardiovascular disease [40,41], our study underscores the potential importance of reduction of adiposity for prevention of metabolic abnormalities and cardiovascular disease. In addition we support that anthropometric obesity measures, which are simple, inexpensive, reliable, and suitable for various settings, can predict metabolic abnormalities instead of using restricted mobility and expensive equipment.
REFERENCES
[1] Liese AD, Mayer-Davis EJ, Haffner SM. Development of the multiple metabolic syndrome: an epidemiologic perspective. Epidemiologic Reviews 1998; 20(2): 157-172. [2] Pickup J, Mattock M, Chusney G, BurtD. NIDDM
as a disease of the innate immune system: association of acute-phase reactants and interleukin-6 with metabolic syndrome X. Diabetologia 1997; 40(11): 1286-1292.
[3] Festa A, D’Agostino R, Howard G, Mykkänen L, Tracy RP, Haffner SM. Chronic subclinical inflammation as part of the insulin resistance syndrome the insulin resistance atherosclerosis study (IRAS). Circulation 2000; 102: 42-47. [4] Yudkin JS, Stehouwer C, Emeis J, Coppack S.
C-reactive protein in healthy subjects: associations with obesity, insulin resistance, and endothelial dysfunction a potential role for cytokines originating from adipose tissue?. Arteriosclerosis, Thrombosis, and Vascular Biology 1999; 19(4): 972-978. [5] Lim S, Shin H, Song JH, Kwak SH, Kang SM,
Won YJ, Choi SI, Park KS, Jang HC, Koh KK. Increasing prevalence of metabolic syndrome in Korea: the Korean national health and nutrition examination survey for 1998–2007. Diabetes Care 2011; 34(6): 1323-1328.
[6] Isomaa B, Almgren P, Tuomi T, Forsén B, Lahti K, Nissén M, Taskinen MR, Groop L.
Cardiovascular morbidity and mortality associated with the metabolic syndrome. Diabetes care 2001; 24(4): 683-689.
[7] Trevisan M, Liu J, Bahsas FB, Menotti A. Syndrome X and mortality: a population-based study. Risk factor and life expectancy research group. American Journal of Epidemiology 1998; 148(10): 958-966.
[8] Jackson AS, Stanforth PR, Gagnon J, Rankinen T, Leon AS, Rao DC, Skinner JS, Bouchard C, Wilmore JH. The effect of sex, age and race on estimating percentage body fat from body mass index: the heritage family study. International Journal of Obesity and Related Metabolic Disorders 2002; 26(6): 789-796.
[9] Gallagher D, Ruts E, Visser M, Heshka S, Baumgartner RN, Wang J, Pierson RN, Pi-Sunyer FX, Heymsfield SB. Weight stability masks sarcopenia in elderly men and women. American Journal of Physiology, Endocrinology and Metabolism 2000; 279(2): E366-E375.
[10] Mukuddem-Petersen J, Snijder MB, van Dam RM, Dekker JM, Bouter LM, Stehouwer CD, Heine RJ, Nijpels G, Seidell JC. Sagittal abdominal diameter: no advantage compared with other anthropometric measures as a correlate of components of the metabolic syndrome in elderly from the Hoorn Study. The American Journal of Clinical Nutrition 2006; 84(5): 995-1002.
[11] McCarthy H, Cole T, Fry T, Jebb S, Prentice A. Body fat reference curves for children. International Journal of Obesity 2006; 30(4): 598-602. [12] Zimmet P, Magliano D, Matsuzawa Y, Alberti
G, Shaw J. The metabolic syndrome: a global public health problem and a new definition. Journal of atherosclerosis and thrombosis 2005; 12(6): 295-300.
[13] Fox CS, Massaro JM, Hoffmann U, Pou KM, Maurovich-Horvat P, Liu CY, Vasan RS, Murabito JM, Meigs JB, Cupples LA, D’Agostino RB Sr, O’Donnell CJ. Abdominal visceral and subcutaneous adipose tissue compartments: association with metabolic risk factors in the Framingham heart study. Circulation 2007; 116(1): 39-48.
[14] Despres JP, Lemieux I. Abdominal obesity and metabolic syndrome. Nature 2006; 444(7121): 881-887.
[15] Seidell J, Oosterlee A, Deurenberg P, Hautvast J, Ruijs J. Abdominal fat depots measured with computed tomography: effects of degree of obesity, sex, and age. European Journal of Clinical Nutrition 1988; 42(9): 805-815.
[16] Janssen I, Heymsfield SB, Allison DB, Kotler DP, Ross R. Body mass index and waist circumference independently contribute to the prediction of nonabdominal, abdominal subcutaneous, and visceral fat. The American Journal of Clinical Nutrition 2002; 75(4): 683-688.
[17] Pouliot MC, Després JP, Lemieux S, Moorjani S, Bouchard C, Tremblay A, Nadeau A, Lupien PJ. Waist circumference and abdominal sagittal diameter: best simple anthropometric indexes of abdominal visceral adipose tissue accumulation and related cardiovascular risk in men and
women. The American Journal of Cardiology 1994; 73(7): 460-468.
[18] Ashwell M, Hsieh SD. Six reasons why the waist-to-height ratio is a rapid and effective global indicator for health risks of obesity and how its use could simplify the international public health message on obesity. International Journal of Food Sciences and Nutrition 2005; 56(5): 303-307.
[19] Savva S, Tornaritis M, Savva M, Kourides Y, Panagi A, Silikiotou N, Georgiou C, Kafatos A. Waist circumference and waist-to-height ratio are better predictors of cardiovascular disease risk factors in children than body mass index. International Journal of Obesity and Related Metabolic Disorders 2000; 24(11): 1453-1458. [20] Hara M, Saitou E, Iwata F, Okada T, Harada
K. Waist-to-height ratio is the best predictor of cardiovascular disease risk factors in Japanese schoolchildren. Journal of Atherosclerosis and Thrombosis 2001; 9(3): 127-132.
[21] Chobanian AV, Bakris GL, Black HR, Cushman WC, Green LA, Izzo JL Jr, Jones DW, Materson BJ, Oparil S, Wright JT Jr, Roccella EJ. The seventh report of the joint national committee on prevention, detection, evaluation, and treatment of high blood pressure: the JNC 7 report. The Journal of the American Medical Association 2003; 289(19): 2560-2571.
[22] Association AD. Diagnosis and classification of diabetes mellitus. Diabetes Care 2010; 33(suppl 1): S62-S69.
[23] Taniguchi A, Fukushima M, Sakai M, Kataoka K, Nagata I, Doi K, Arakawa H, Nagasaka S, Tokuyama K, Nakai Y. The role of the body mass index and triglyceride levels in identifying insulin-sensitive and insulin-resistant variants
in Japanese non-insulin-dependent diabetic patients. Metabolism 2000; 49(8): 1001-1005. [24] Expert Panel on Detection E. Executive
summary of the third report of the national cholesterol education program (NCEP) expert panel on detection, evaluation, and treatment of high blood cholesterol in adults (Adult Treatment Panel III). The Journal of the American Medical Association 2001; 285(19): 2486-2497. [25] Grundy SM, Cleeman JI, Daniels SR,
Do-nato KA, Eckel RH, Franklin BA, Gordon DJ, Krauss RM, Savage PJ, Smith Jr. SC, Spertus JA, Costa F. Diagnosis and management of the metabolic syndrome an American heart association/national heart, lung, and blood institute scientific statement. Circulation 2005; 112: 2735-2752.
[26] Suh M, Lee JY, Ahn SV, Kim HC, Suh I. C-reactive protein and carotid intima-media thickness in a population of middle-aged Koreans. Journal of Preventive Medicine and Public Health 2009; 42(1): 29-34.
[27] Lee JM, Kim HC, Cho HM, Oh SM, Choi DP, Suh I. Association between serum uric acid level and metabolic syndrome. Journal of Preventive Medicine and Public Health 2012; 45(3): 181-187. (Korean)
[28] Friedewald WT, Levy RI, Fredrickson DS. Estimation of the concentration of low-density lipoprotein cholesterol in plasma, without use of the preparative ultracentrifuge. Clinical Chemistry 1972; 18(6): 499-502.
[29] Matthews D, Hosker J, Rudenski A, Naylor B, Treacher D, Turner R. Homeostasis model assessment: insulin resistance and β-cell function from fasting plasma glucose and insulin concentrations in man. Diabetologia 1985;
28(7): 412-419.
[30] Hsieh SD, Yoshinaga H, Muto T. Waist-to-height ratio, a simple and practical index for assessing central fat distribution and metabolic risk in Japanese men and women. International Journal of Obesity and Related Metabolic Disorders 2003; 27(5): 610-616.
[31] Schneider HJ, Klotsche J, Stalla GK, Wittchen HU. Obesity and risk of myocardial infarction: the INTERHEART study. The Lancet 2006; 367(9516): 1052; author reply 1054.
[32] Schneider HJ, Glaesmer H, Klotsche J, Bohler S, Lehnert H, Zeiher AM, März W, Pittrow D, Stalla GK, Wittchen HU. Accuracy of anthropometric indicators of obesity to predict cardiovascular risk. The Journal of Clinical Endocrinology and Metabolism 2007; 92(2): 589-594.
[33] Kato M, Takahashi Y, Inoue M, Tsugane S, Kadowaki T, Noda M. Comparisons between anthropometric indices for predicting the metabolic syndrome in Japanese. Asia Pacific Journal of Clinical Nutrition 2008; 17(2): 223-228.
[34] Allison DB, Paultre F, Goran MI, Poehlman ET, Heymsfield SB. Statistical considerations regarding the use of ratios to adjust data. International Journal of Obesity and Related Metabolic Disorders 1995; 19(9): 644-652. [35] Nordhamn K, Sodergren E, Olsson E, Karlstrom
B, Vessby B, Berglund L. Reliability of anthropometric measurements in overweight and lean subjects: consequences for correlations between anthropometric and other variables. International Journal of Obesity and Related Metabolic Disorders 2000; 24(5): 652-657. [36] Ashwell M, Hsieh SD. Six reasons why the
waist-to-height ratio is a rapid and effective global indicator for health risks of obesity and how its use could simplify the international public health message on obesity. International Journal of Food Sciences Nutrition 2005; 56(5): 303-307.
[37] Bosy-Westphal A, Geisler C, Onur S, Korth O, Selberg O, Schrezenmeir J, Müller MJ. Value of body fat mass vs anthropometric obesity indices in the assessment of metabolic risk factors. International Journal of Obesity 2006; 30(3): 475-483.
[38] Shao J, Yu L, Shen X, Li D, Wang K. Waist-to-height ratio, an optimal predictor for obesity and metabolic syndrome in Chinese adults. The Journal of Nutrition Health and Aging 2010; 14(9): 782-785.
[39] Park SH, Choi SJ, Lee KS, Park HY. Waist circumference and waist-to-height ratio
as predictors of cardiovascular disease risk in Korean adults. Circulation Journal 2009; 73(9): 1643-1650.
[40] Borg R, Kuenen J, Carstensen B, Zheng H, Nathan D, Heine R, et al. HbA1c and mean blood glucose show stronger associations with cardiovascular disease risk factors than do postprandial glycaemia or glucose variability in persons with diabetes: the A1C-derived average glucose (ADAG) study. Diabetologia 2011; 54(1): 69-72.
[41] Skilton MR, Moulin P, Sérusclat A, Nony P, Bonnet F. A comparison of the NCEP-ATPIII, IDF and AHA/NHLBI metabolic syndrome definitions with relation to early carotid atherosclerosis in subjects with hypercholesterolemia or at risk of CVD: evidence for sex-specific differences. Atherosclerosis 2007; 190(2): 416-422.