저작자표시-비영리-변경금지 2.0 대한민국 이용자는 아래의 조건을 따르는 경우에 한하여 자유롭게 l 이 저작물을 복제, 배포, 전송, 전시, 공연 및 방송할 수 있습니다. 다음과 같은 조건을 따라야 합니다: l 귀하는, 이 저작물의 재이용이나 배포의 경우, 이 저작물에 적용된 이용허락조건 을 명확하게 나타내어야 합니다. l 저작권자로부터 별도의 허가를 받으면 이러한 조건들은 적용되지 않습니다. 저작권법에 따른 이용자의 권리는 위의 내용에 의하여 영향을 받지 않습니다. 이것은 이용허락규약(Legal Code)을 이해하기 쉽게 요약한 것입니다. Disclaimer 저작자표시. 귀하는 원저작자를 표시하여야 합니다. 비영리. 귀하는 이 저작물을 영리 목적으로 이용할 수 없습니다. 변경금지. 귀하는 이 저작물을 개작, 변형 또는 가공할 수 없습니다.
Detection of Novel Genomic Markers for
Predicting Prognosis in Hepatocellular Carcinoma
Patients by Integrative Analysis of Copy Number
Aberrations and Gene Expression Profiles: Results
from a Long-Term Follow-Up
by
Detection of Novel Genomic Markers for
Predicting Prognosis in Hepatocellular Carcinoma
Patients by Integrative Analysis of Copy Number
Aberrations and Gene Expression Profiles: Results
from a Long-Term Follow-Up
by
Hyo Jung Cho
A Dissertation Submitted to The Graduate School of
Ajou University in Partial Fulfillment of the Requirements for
the Doctor of Philosophy degree in Medicine
Supervised by
Jae Youn Cheong, M.D., Ph.D.
Major in Medicine
Department of Medical Sciences
The Graduate School, Ajou University
This certifies that the dissertation
of Hyo Jung Cho is approved.
SUPERVISORY COMMITTEE
Sung Won Cho
Jae Youn Cheong
Kwang Jae Lee
Young Seok Kim
Soon Sun Kim
The Graduate School, Ajou University
December, 18th, 2015
i
- ABSTRACT –
Detection of Novel Genomic Markers for Predicting
Prognosis in Hepatocellular Carcinoma Patients by
Integrative Analysis of Copy Number Aberrations and
Gene Expression Profiles: Results from a Long-Term
Follow-Up
Aims The aim of this study was to explore for novel genomic biomarker predicting
hepatocellular carcinoma (HCC) prognosis by integrative analysis of DNA copy number aberrations (CNAs) and gene expression profiles. Array comparative genomic hybridization and expression array were performed on 45 and 31 HCC samples, respectively. To identify functionally important genes, concordant results of DNA copy number and gene expression were retrieved by integrative analysis.
Results Cox regression analysis indicated that the CNAs in 192 genomic regions
were significantly associated with OS (P<0.05). Integrative analysis capturing concordant results demonstrated that the low expression of TLE4 (P=0.041) and XPA (P=0.006) were associated with poor OS. In the analysis of tumor recurrence, 514 genomic regions with CNAs were associated with recurrence. Integrative analysis revealed that the overexpression of 16 genes including FGR (P=0.003), RELA (P=0.049), LTBP3 (P=0.050), and RIN1 (P=0.023) were significantly associated with shorter time to tumor recurrence. On multivariate analysis, FGR and XPA were independent risk factor of early recurrence and poor overall survival respectively.
Conclusions Integrated analysis of CNAs and gene expression profiles correlated
with long-term follow-up data successfully identified potential prognostic markers predicting survival and tumor recurrence in patients with HCC who underwent surgical resection.
Keywords hepatocellular carcinoma, integrative analysis, copy number aberration,
ii
TABLE OF CONTENTS
ABSTRACT ··· i
TABLE OF CONTENTS ··· ii
LIST OF FIGURES ··· iii
LIST OF TABLES ··· iv
Ⅰ.INTRODUCTION ··· 1
Ⅱ.MATERIALS AND METHODS ··· 3
A. Patient characteristics and HCC sample collection ··· 3
B. Array comparative genomic hybridization ··· 4
C. Gene expression microarray profiling ···5
D. Statistical analysis ··· 6
Ⅲ.RESULTS ··· 7
A. Patient Copy number aberrations associated with overall survival and tumor recurrence ···7
B. Integrative analysis of copy number aberration and gene expression ···8
C. Candidate genes as potential prognostic biomarkers in HCC patients ···14
D. Genes and clinicopathologic variables which associated with early recurrence or poor oveall survival ···15
Ⅳ.DISCUSSION ···20
Ⅴ.CONCLUSION ···23
REFERENCES ···24
iii
LIST OF FIGURES
Fig. 1 Schematic overview of the integration analysis strategies ···10
Fig. 2 Kaplan-Meier curves for recurrence-free survival in hepatocellular carcinoma patients
treated with hepatic resection according to gene expression in tumor tissue. (A) FGR (B) RELA (C) LTBP3 (D) RIN1 ···16
Fig. 3 Kaplan-Meier curves for overall survival in hepatocellular carcinoma patients treated
with hepatic resection according to gene expression in tumor tissue. (A) TLE4 (B) XPA · · · 1 8
iv
LIST OF TABLES
Table 1. List of recurrence-related genes in hepatocellular carcinoma, identified by integrative analysis ··· 11 Table 2. List of overall survival-related genes in hepatocellular carcinoma, identified by integrative analysis ··· 13 Table 3. Multivariate analysis to evaluate independent risk factors of early recurrence
according to candidate gene expression in mRNA expression cohort. (N = 31)
···17 Table 4. Multivariate analysis to evaluate independent risk factors of poor overall survival according to candidate gene expression in mRNA expression cohort. (N = 31)
1
I.
Introduction
Hepatocellular carcinoma (HCC) is the fifth most common neoplasm in the world and represents the third leading cause of cancer mortality (Parkin et al., 2001). Prognosis of HCC is known to be poor; however, genomic markers related to patient prognosis have not yet been identified.
Analysis of DNA copy number aberrations (CNAs) is particularly important in cancer research because the amplification of oncogenes and/or deletion of tumor suppressor genes are critically involved in the pathogenesis of cancer development and progression (Kinzler and Vogelstein, 1996). CNAs are likely to influence gene expression; however, they are not essential to the transcriptional expression of most genes in cancer (Stranger et al., 2007). Overexpression of a gene could only be partially ascribed to DNA amplification because there might be multiple mechanisms involved in the upregulation of the gene (Hyman et al., 2002; Pollack et al., 2002; Huang et al., 2006). A recent study demonstrated that single nucleotide polymorphism and copy number variation genotypes were associated with 84% and 18% of the variation in those gene expression traits, respectively (Stranger et al., 2007). Another study showed that 62% of highly amplified genes demonstrated moderately or highly elevated expression in breast cancer (Pollack et al., 2002).
Array comparative genomic hybridization (CGH) has enabled the high-resolution detection of CNAs (Pollack et al., 1999). Combined analysis of array CGH and gene expression data, followed by functional validation, is regarded as a powerful tool for the discovery of cancer driver genes from genome-wide array-based strategies. In HCC, CNAs occur frequently and contribute to gene expression profiles (Katoh et al., 2005). Several studies have reported the results of integrative analysis of CNAs and expression profiles in HCC samples, but few have focused on the prognostic impact of candidate genes in patients with HCC (Midorikawa et al., 2006).
In the current study, we applied integrative analytical methods to correlate CNAs obtained from array CGH and the corresponding gene expression profiles obtained from oligonucleotide microarray in HCC samples. We then searched for the genomic markers predicting patient outcome using long-term follow-up data regarding overall survival (OS)
2
3
II. Materials and Methods
A. Patient characteristics and HCC sample collection
HCC specimens were obtained from 50 patients who had underwent hepatic resection for HCC treatment at Ajou University Hospital (Suwon, Republic of Korea) between March 1995 and March 2003. Control liver samples were obtained from 25 patients who had underwent hepatic resection for management of metastatic liver tumor from gastrointestinal malignancies. The biospecimens for this study were provided by the Ajou Human Bio-Resource Bank, a member of the National Biobank of Korea, which is supported by the Ministry of Health and Welfare. Specimens were reviewed by one expert pathologist and pathological diagnosis of HCC was based on international consensus panel (2012). Data about the gender, age, etiology of liver disease, tumor number, tumor size, vascular invasion, alpha-fetoprotein (AFP), histologic grade of HCC according to the Edmonson-Steiner grading system, HCC stage according to the modified Union for International Cancer Control (UICC), OS, and tumor recurrence were collected from medical records. Overall survival was defined as the period from treatment day to the last follow-up or death caused by HCC. Disease-free survival was defined as the interval between treatment day and the confirmation day of HCC recurrence. The recurrence of HCC was defined as newly developed lesions on CT which showed early enhancement in the arterial phase with washout in the late phase. The median follow-up period was 83 months (range = 3–202 months). Among the obtained specimens, array CGH analysis and messenger RNA (mRNA) expression profiling were performed in 45 and 31 HCC tissues, respectively. Twenty-six specimens of HCC were analyzed for both array CGH and expression array. The baseline clinical and tumor characteristics of patients are depicted in Supplementary Table S1. Etiology of liver disease was divided by chronic hepatitis B, chronic hepatitis C, and others including alcoholic liver disease, autoimmune hepatitis, Wilson’s disease, and other cryptogenic causes.
Written informed consent was obtained from all study subjects. This study was approved by the Institutional Review Board at Ajou University Hospital (GN3-07-400).
4
B. Array comparative genomic hybridization
We used arrays of 4,041 bacterial artificial chromosomes clones (MACArray™ KARYO 4000 genome array; Macrogen Inc., Seoul, Korea), including 1,440 cancer-related genes, at a resolution of 1 Mb for scanning the entire genome for copy number changes. Each clone was printed in triplicate in a 12mm × 12mm square area. The array platforms are described in detail in the Supplementary Materials and Methods. Images of fluorescence signals were acquired by a GenePix 4000V Microarray Scanner (Axon instrument, Foster City, CA, USA). Analysis of fluorescence signal intensities was performed using the array software package MAC Viewer™ (Macrogen, Inc.). Raw data for the 45 HCC samples are available from the Gene Expression Omnibus database (GSE65237).
5
C. Gene expression microarray profiling
Gene expression microarray analysis of the RNA from 31 tumors was performed using an Illumina HumanHT-12 v4 Expression BeadChip array (Illumina, Inc., San Diego, CA, USA) according to the manufacturer's instructions. Detailed information describing procedures of microarray analysis is available in the Supplementary Materials and Methods.
6
D. Statistical analysis
To analyze array CGH data, the automatic segmentation of DNA spots was applied and subtraction of background noise was performed, thereafter we calculated the total intensity and the intensity ratio of the two dyes for each spot. The resulting values were normalized based on intensity, and data were log2 transformed and the mean log2 ratio
(sample/reference) of the triplicate spots was calculated. A smoothing step was performed using locally weighted regression.
To verify genomic regions associated with copy number differences between normal and HCC samples, the chi-square test was performed with Monte Carlo simulation. The threshold for chromosomal gain and loss was defined as 0.001 < P-value < 0.05, and the threshold for chromosomal amplifications and homozygous deletions was defined as a P-value < 0.001.
Cox proportional hazard regression analysis was performed to investigate the effect of DNA copy number and gene expression profile on OS and tumor recurrence coupled with clinical follow-up data. To identify clones associated with clinical variables in HCC, logistic regression analysis was carried out. Patients were divided into two groups according to the status of each clinical variable (tumor size: < 5cm vs. ≥ 5cm, stage: UICC I/II vs. III/IV, vascular invasion: negative vs. positive, differentiation: Edmonson grade I/II vs. III/IV, and AFP: < 200 ng/ml vs ≥ 200 ng/ml) for logistic regression analysis. A P-value < 0.05 was regarded as statistically significant. All statistical tests were performed with SPSS version 19.0 (SPSS, Chicago, IL, USA).
7
III. Results
A. Copy number aberrations associated with overall survival and tumor recurrence
Genomic regions with frequent chromosomal gain and loss in HCC samples, distinguished by comparison to normal liver samples, were identified by analysis of array CGH data. Chromosomal gain in 1q and deletion in 4q were the most frequently observed aberrations. Amplified and deleted genomic regions were also identified.
In Cox regression analyses to identify recurrence-related genomic regions, 234 genomic regions with CNAs were found to be significantly associated with tumor recurrence (P < 0.05). These genomic regions were frequently located at 3p, 4p, 4q, 9p, 9q, and 14q. Forty-eight amplified genomic regions, which were located at chromosomes 1p, 8q, 11q, and 20q, were also significantly associated with tumor recurrence. Additionally, 232 deleted genomic regions were also revealed as statistically significant recurrence-associated regions. These deleted regions were frequently located at chromosome 3p, 4p, 4q, 9p, 9q, and 14q. Cox regression analysis revealed that 192 genomic regions with CNAs, located at chromosome 4p15, 4p16, 9p11, 9p12, and 9p13, were significantly associated with OS in patients with HCC. In addition, 42 amplified regions and 176 deleted genomic regions were associated with OS. Amplified genomic regions were frequently located at chromosome 1p35, 1p36, 1q44, and 11q13, while the deleted regions were frequently located at 1p13, 4q12, 4p15, 4p16, 9p12, 9p13, 9p21, 9q33, and 13q31.
8
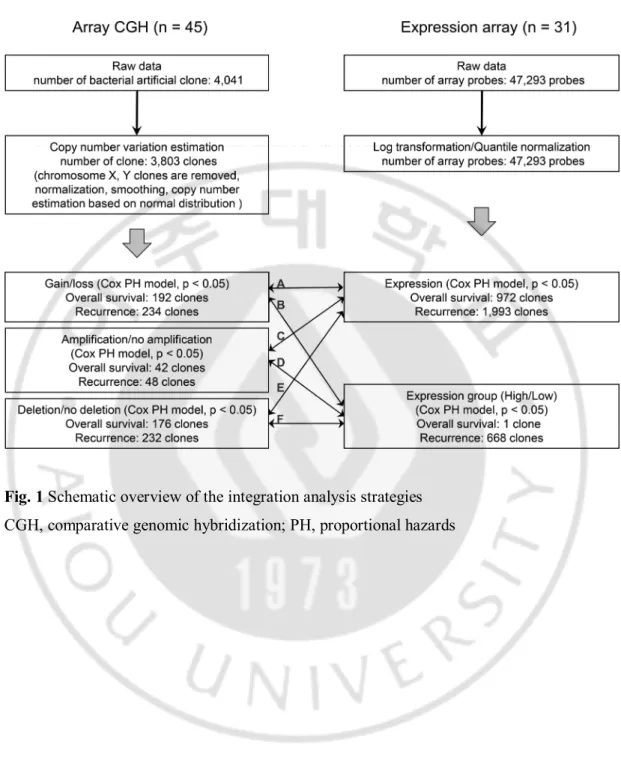
B. Integrative analysis of copy number aberration and gene expression
For Cox regression analysis according to gene expression levels, patients were divided into two groups based on gene expression status: high expression (defined as expression greater than the mean levels) versus low expression (expression lower than mean expression levels). Fig. 1 shows an overview of integrative analysis strategies of DNA copy number and gene expression. Integrative analysis strategies were applied as follows; A: gene dosage as copy number × gene expression level, B: gene dosage as copy number × high or low gene expression, C: gene amplification × gene expression level, D: gene amplification × high or low gene expression, E: gene deletion × gene expression level, F: gene deletion × high or low gene expression.
We next retrieved concordant results of DNA copy number and corresponding gene expression based on the results of integrative analysis. In regard to recurrence-associated genes, 15 candidate genes were identified (Table 1). Among these genes, seven, including
Gardner-Rasheed feline sarcoma viral (FGR; hazard ratio [HR] = 5.30, P = 0.003), v-rel avian reticuloendotheliosis viral oncogene homolog A (RELA; HR = 2.48, P = 0.049),
microfibrillar-associated protein 2 (MFAP2; HR = 2.03, P = 0.041), solute carrier family 35, member E2 (SLC35E2; HR = 28.26, P = 0.034), Ras and Rab interactor 1 (RIN1; HR = 3.95, P = 0.023), protein phosphatase 2, regulatory subunit B', beta isoform (PPP2R5B; HR =
1650.63, P = 0.008), and latent transforming growth factor beta binding protein 3 (LTBP3; HR = 2.41, P = 0.050), were selected by the integrative analysis shown in C and D of Fig. 1. Overexpression of these genes showed higher risk of shorter time to recurrence in HCC patients who underwent hepatic resection. Integration of recurrence-associated deleted regions with gene expression was analyzed (Fig. 1; E and F integrative analysis). As a result, eight genes, including mitochondrial ribosomal protein L50 (MRPL50; HR = 97.74, P = 0.014), FERM and PDZ domain containing 1 (FRMPD1; HR = 10700, P = 0.012), nuclear
receptor subfamily 4, group A, member 3 (NR4A3; HR = 13900, P = 0.021), sperm associated antigen 8 (SPAG8; HR = 3144.44, P = 0.048), unc-13 homolog B
(Caenorhabditis elegans) (UNC13B; HR = 12.02, P = 0.024), glutaredoxin, cysteine rich 1
(LOC389207; HR = 177000, P = 0.019), mitogen-activated protein kinase associated protein
1 (MAPKAP1; HR = 36.48, P = 0.019), and Wolf-Hirschhorn syndrome candidate 1
9
expression levels. Namely, patients with low expression of these genes showed shorter time to recurrence.
Next, integrative analysis was performed to identify survival-associated genes, and four candidate genes were selected (Table 2). Among them, N-acetylated alpha-linked acidic
dipeptidase-like 1 (NAALADL1; HR = 1.76, P = 0.043) was selected by C integrative
analysis shown in Fig. 1. Patients with high NAALADL1 expression and amplification of corresponding genomic lesions showed increased risk of poor survival compared to the other HCC patients. Integration of survival-related deleted regions with corresponding gene expression (Fig. 1; E integration) showed that transducin-like enhancer of split 4 (TLE4; HR = 2.97, P = 0.041), nudix (nucleoside diphosphate linked moiety X)-type (NUDT; HR = 1.86,
P = 0.045), and xeroderma pigmentosum, complementation group A (XPA; HR = 4.23, P =
0.006) had concordant results between the CNAs and corresponding gene expression. Low expression of these genes had a negative impact on OS.
10
Fig. 1 Schematic overview of the integration analysis strategies
11
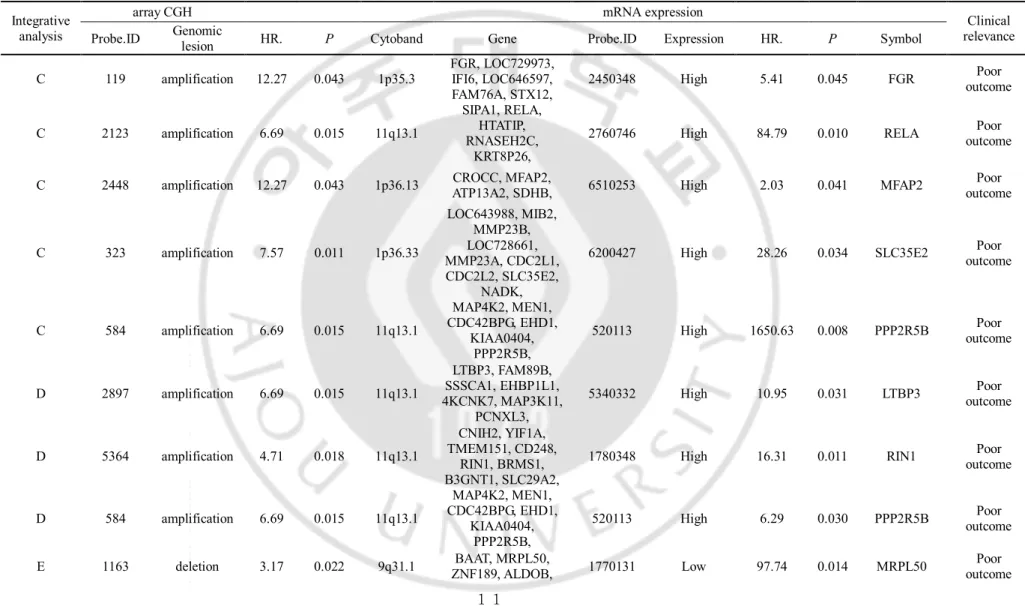
Table 1. List of recurrence-related genes in hepatocellular carcinoma, identified by integrative analysis
Integrativeanalysis
array CGH mRNA expression
Clinical relevance Probe.ID Genomic lesion HR. P Cytoband Gene Probe.ID Expression HR. P Symbol
C 119 amplification 12.27 0.043 1p35.3 FGR, LOC729973, IFI6, LOC646597, FAM76A, STX12,
2450348 High 5.41 0.045 FGR outcome Poor
C 2123 amplification 6.69 0.015 11q13.1
SIPA1, RELA, HTATIP, RNASEH2C,
KRT8P26,
2760746 High 84.79 0.010 RELA outcome Poor
C 2448 amplification 12.27 0.043 1p36.13 CROCC, MFAP2, ATP13A2, SDHB, 6510253 High 2.03 0.041 MFAP2 outcome Poor
C 323 amplification 7.57 0.011 1p36.33 LOC643988, MIB2, MMP23B, LOC728661, MMP23A, CDC2L1, CDC2L2, SLC35E2, NADK,
6200427 High 28.26 0.034 SLC35E2 outcome Poor
C 584 amplification 6.69 0.015 11q13.1
MAP4K2, MEN1, CDC42BPG, EHD1,
KIAA0404, PPP2R5B,
520113 High 1650.63 0.008 PPP2R5B outcome Poor
D 2897 amplification 6.69 0.015 11q13.1
LTBP3, FAM89B, SSSCA1, EHBP1L1, 4KCNK7, MAP3K11,
PCNXL3,
5340332 High 10.95 0.031 LTBP3 outcome Poor
D 5364 amplification 4.71 0.018 11q13.1
CNIH2, YIF1A, TMEM151, CD248,
RIN1, BRMS1, B3GNT1, SLC29A2,
1780348 High 16.31 0.011 RIN1 outcome Poor
D 584 amplification 6.69 0.015 11q13.1
MAP4K2, MEN1, CDC42BPG, EHD1,
KIAA0404, PPP2R5B,
520113 High 6.29 0.030 PPP2R5B outcome Poor E 1163 deletion 3.17 0.022 9q31.1 ZNF189, ALDOB, BAAT, MRPL50, 1770131 Low 97.74 0.014 MRPL50 outcome Poor
12
E 1417 deletion 10.95 < 0.001 9p13.2 FRMPD1, 2190577 Low 1.07E+04 0.012 FRMPD1 outcome Poor E 2042 deletion 3.17 0.022 9q22.33-9q31.1 NR4A3, 3140736 Low 1.39E+05 0.021 NR4A3 outcome Poor
E 2199 deletion 10.95 < 0.001 9p13.3 CA9, TPM2, TLN1, CREB3, GBA2, LOC646945, KIAA0258, PC-3, LOC646947, NPR2, SPAG8,
2100605 Low 3144.44 0.048 SPAG8 outcome Poor
E 410 deletion 10.95 < 0.001 9p13.3
KIAA1539, LOC730110,
UNC13B, 2850138 Low 12.02 0.024 UNC13B
Poor outcome E 4900 deletion 4.18 < 0.001 4p13 LOC389207, 106860239 Low 1.77E+05 0.019 LOC389207 outcome Poor E 972 deletion 7.02 0.025 9q33.3 LOC51145, PBX3, MAPKAP1, 3610471 Low 36.48 0.019 MAPKAP1 outcome Poor
F 161 deletion 7.02 0.014 4p16.3 LETM1, LOC643073, WHSC1, 4280288 Low 10.27 0.035 WHSC1 outcome Poor
CGH, comparative genomic hybridization; HR, hazard ratio
13
Table 2. List of overall survival-related genes in hepatocellular carcinoma, identified by integrative analysis
Integrative analysis
array CGH mRNA expression
Clinical relevance Probe.ID Genomic lesion HR. P Cytoband Gene Probe.ID Expression HR. P Symbol
C 397 amplification 5.07 0.033 11q13.1 NAALADL1, CDCA5, ZFPL1, C11orf2, TM7SF2, ZNHIT2
3450735 High 1760.25 0.042 NAALADL1 Poor outcome
E 1119 deletion 3.01 0.036 9q21.31 TLE4 50433 Low 524.38 0.033 TLE4 Poor outcome E 2048 deletion 4.19 0.006 9p13.3 C9orf48, KIF24,
NUDT2,
3120019 Low 14.86 0.041 NUDT2 Poor outcome
E 2335 deletion 4.19 0.006 9p13.3
UBAP1 C9orf48,
KIF24, NUDT2
3120019 Low 14.86 0.041 NUDT2 Poor outcome
E 2720 deletion 3.65 0.015 9q22.33 NCBP1, XPA, C9orf97, 940408 Low 138.65 0.026 XPA Poor outcome E 2890 deletion 3.65 0.015 9q22.33 NCBP1 XPA, LOC392371 940408 Low 138.65 0.026 XPA Poor outcome
14
C. Candidate genes as potential prognostic biomarkers in HCC patients
We next performed a systematic literature review for the 20 genes that achieved statistical significance in integrative analysis to identify genes that were candidates as potential prognostic biomarkers in patients with HCC. Six genes were finally identified as biologically plausible potential putative oncogenes and tumor suppressor genes since these genes have been reported as cancer-associated genes in various human malignancies and have shown concordance with our results. Four genes: FGR, RELA, RIN1, and LTBP3, were theorized to be putative oncogenes, since their overexpression was associated with
recurrence in patients with HCC undergoing surgical resection. In contrast, TLE4 and XPA were supposed to have a role as tumor suppressor genes, since their low expression was associated with poor OS in patients with HCC.
15
D. Genes and clinicopathologic variables which associated with early recurrence or poor OS
Fig. 2 shows that significant differences of recurrence free survival according to
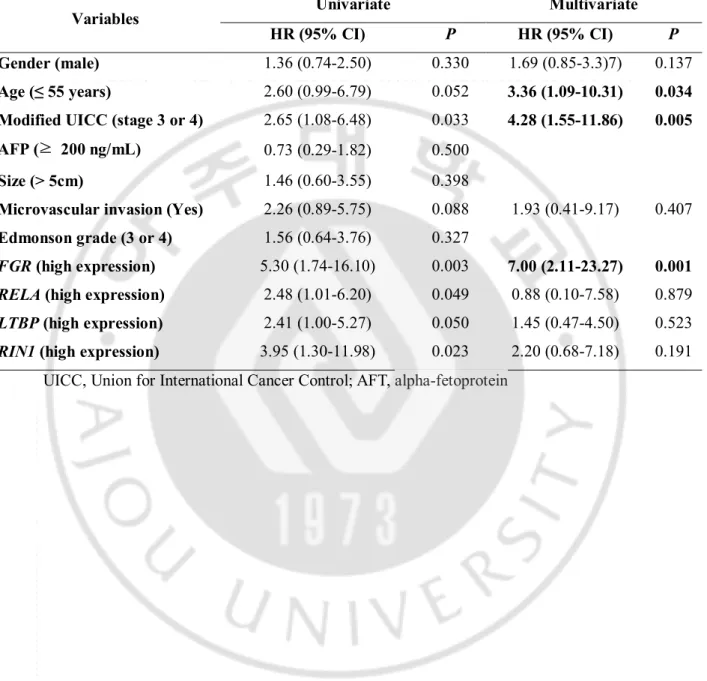
expression level of FGR, RELA, RIN1, and LTBP3 on Kaplan-Meier analysis. The patients with high expression levels of each gene had significantly shorter recurrence free survival than patients with low gene expression levels. On univariate Cox regression analysis, modified UICC stage 3 or 4 (HR = 2.60, 95% confidence interval [CI] = 1.29–7.10, P = 0.011) were also significant predictive factors for a shorter overall survival rate in addition to four candidate genes. Variables which P value was less than 0.1 in univariate analysis, including modified UICC, microvascular invasion, and four candidate genes, were entered into multivariate analysis with previously reported important risk factors such as gender and age. Multivariate analysis revealed that age ≤55 years (HR = 3.36, 95% CI = 1.09–10.31, P = 0.034), modified UICC stage 3 or 4 (HR = 4.28, 95% CI = 1.55-11.86, P = 0.005), and high expression of FGR (HR = 7.00, 95% CI = 2.11–23.27, P = 0.001) were independent
predictive factors for early recurrence of HCC in patients who underwent surgical treatment. (Table 3)
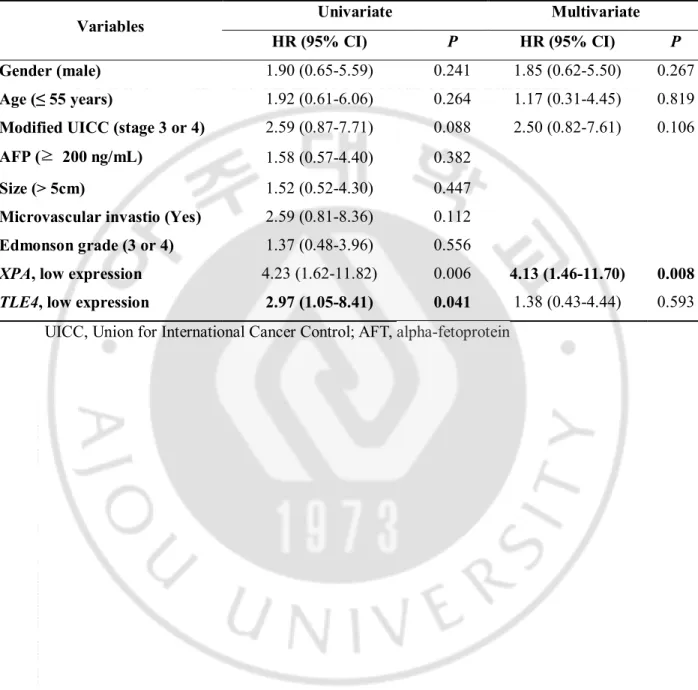
On Kaplan-Meier analysis, patients with low expression of TLE4 or XPA had significantly poor overall survival compared to high expression group (Fig. 3). However, there was no significant clinicopathologic variables on univariate Cox regression analysis. Multivariate Cox regression analysis revealed that low XPA expression (HR = 4.13, 95% CI = 1.46-11.70,
16
Fig. 2Kaplan-Meier curves for recurrence-free survival in hepatocellular carcinoma patients treated with hepatic resection according to gene expression in tumor tissue
17
Table 3. Multivariate analysis to evaluate independent risk factors of early recurrence
according to candidate gene expression in mRNA expression cohort. (N = 31)
Variables Univariate Multivariate
HR (95% CI) P HR (95% CI) P
Gender (male) 1.36 (0.74-2.50) 0.330 1.69 (0.85-3.3)7) 0.137
Age (≤ 55 years) 2.60 (0.99-6.79) 0.052 3.36 (1.09-10.31) 0.034
Modified UICC (stage 3 or 4) 2.65 (1.08-6.48) 0.033 4.28 (1.55-11.86) 0.005
AFP (≥ 200 ng/mL) 0.73 (0.29-1.82) 0.500
Size (> 5cm) 1.46 (0.60-3.55) 0.398
Microvascular invasion (Yes) 2.26 (0.89-5.75) 0.088 1.93 (0.41-9.17) 0.407
Edmonson grade (3 or 4) 1.56 (0.64-3.76) 0.327
FGR (high expression) 5.30 (1.74-16.10) 0.003 7.00 (2.11-23.27) 0.001 RELA (high expression) 2.48 (1.01-6.20) 0.049 0.88 (0.10-7.58) 0.879
LTBP (high expression) 2.41 (1.00-5.27) 0.050 1.45 (0.47-4.50) 0.523
RIN1 (high expression) 3.95 (1.30-11.98) 0.023 2.20 (0.68-7.18) 0.191 UICC, Union for International Cancer Control; AFT, alpha-fetoprotein
18
Fig. 3 Kaplan-Meier curves for overall survival in hepatocellular carcinoma patients treated
with hepatic resection according to gene expression in tumor tissue (A) TLE4 (B) XPA
19
Table 4. Multivariate analysis to evaluate independent risk factors of poor overall survival
according to candidate gene expression in mRNA expression cohort. (N = 31)
Variables Univariate Multivariate
HR (95% CI) P HR (95% CI) P
Gender (male) 1.90 (0.65-5.59) 0.241 1.85 (0.62-5.50) 0.267
Age (≤ 55 years) 1.92 (0.61-6.06) 0.264 1.17 (0.31-4.45) 0.819
Modified UICC (stage 3 or 4) 2.59 (0.87-7.71) 0.088 2.50 (0.82-7.61) 0.106
AFP (≥ 200 ng/mL) 1.58 (0.57-4.40) 0.382
Size (> 5cm) 1.52 (0.52-4.30) 0.447
Microvascular invastio (Yes) 2.59 (0.81-8.36) 0.112
Edmonson grade (3 or 4) 1.37 (0.48-3.96) 0.556
XPA, low expression 4.23 (1.62-11.82) 0.006 4.13 (1.46-11.70) 0.008 TLE4, low expression 2.97 (1.05-8.41) 0.041 1.38 (0.43-4.44) 0.593
20
IV.
Discussion
The molecular pathogenesis of HCC is not yet fully understood, and only a few studies concentrate on the prognostic significance of HCC-related genes (Lee et al., 2004; Katoh et al., 2005; Hoshida et al., 2008; Nault et al., 2013). In the present study, we tried to identify prognostic biomarkers in HCC patients by performing integrative analysis of CNAs and expression levels of the corresponding genes, coupled with analysis of clinical features, which included long-term up data collected over more than 10 years (median follow-up of 83 months). Consequently, we identified six potential genomic markers predicting long-term prognosis in patients with HCC that underwent hepatic resection. On the basis of these results, we confirmed the oncogenic role of previously identified genes, including FGR,
RELA, RIN1, and LTBP3, and suggested TLE4 and XPA as potential tumor suppressor genes
in HCC patients.
Genes with copy number variation have more potential to be main drivers of carcinogenesis because CNAs have a substantial impact on gene expression levels (Midorikawa et al., 2006). However, presence of CNAs is not the sole factor affecting gene expression. Thus, integrative strategies correlating CNAs with gene expression to identify genes with functional relevance for tumor development and progression are a critical step in developing genomic biomarkers, as genes with a correlation between the CNAs present and gene expression are likely to be functionally related to the pathogenesis of HCC development and/or progression. In addition, genes associated with patient prognosis might have the potential to be biologically selected during cancer progression. In the current study, we integrated array CGH data with gene expression and restricted our investigation only to genes that showed correlations between the copy number and the transcriptome and investigated whether their expression was associated with survival or tumor recurrence. Finally, we identified biologically plausible, prognostic genes of which the expression levels correlated with CNAs in HCC tissues based on long-term follow-up data.
FGR is a member of the SRC family of protein tyrosine kinases (Hanks et al., 1988). SRC has been regarded as an oncogene because it is frequently overexpressed in various
human malignancies including HCC (Thomas and Brugge, 1997). Several researchers suggested that FGR might act as an oncogene complementary to SRC (Edwards et al., 2003; Hu et al., 2004; Kim et al., 2011). FGR overexpression has been reported to be associated
21
with poor survival in patients with leukemia (Lee et al., 2004; Szczepanek et al., 2012), lymphoma (Sharp et al., 1989), and glioblastoma (Hui et al., 2001). In the present study,
FGR overexpression increased the risk of shorter time to recurrence after surgical resection.
To our knowledge, this is the first study that identifies FGR as a potential oncogene in HCC.
RELA was overexpressed in various cancers, including head and neck, breast, stomach,
and liver cancer (Cogswell et al., 2000; Sasaki et al., 2001; Chen et al., 2008). One recent study reported that RelA/nuclear factor-κB was constitutively activated by HBx, and RelA expression was linked with poor histologic differentiation in hepatitis B virus-associated HCC (Fan et al., 2015). Another study reported that blockage of RelA attenuated the suppressive effect of hepatocyte nuclear factor 4α on hepatoma cell metastasis. (Ning et al., 2014) Consistent with these previous reports, HCC patients with RELA overexpression showed higher risk of recurrence in the present study.
RIN1 overexpression has been shown to be associated with poor prognosis in various
human malignancies (Senda et al., 2007; Tomshine et al., 2009; Yu et al., 2012). Contradictory to the expression in other cancers, RIN1 was downregulated in HCC tissues and it was associated with poor patient survival in patients with HCC (He et al., 2013). In the current study, the overexpression of RIN1 was associated with shorter time to recurrence after resection in HCC patients. This result is concurrent with the previous studies in other malignancies. Further studies are needed in order to identify the exact functional role of
RIN1 in HCC.
LTBP3 is involved in transforming growth factor-beta signaling and functions as a
regulator of cell migration and the cell cycle (Gualandris et al., 2000). LTBP3 expression is associated with tumor development in breast cancer and multiple myeloma (Li et al., 2014; Naba et al., 2014). A recent study using liver cancer cells reported that LTBP3 acts as a midkine-interacting protein that plays an important role in carcinogenesis and tumor progression (Ning et al., 2014). This report provides further support for our results, which showed that overexpression of LTBP3 was a marker of poor prognosis in patients with HCC.
TLE4 acts as a transcriptional corepressor and it is a well-known tumor suppressor gene
in a subset of acute myeloid leukemia (Mrozek et al., 2008). However, the expression profile and the role of TLE4 are unknown in other human cancers including HCC. The present study demonstrates that low expression of TLE4 is associated with poor OS in HCC patients, and
22
this result suggests that TLE4 also acts as a tumor suppressor gene in HCC as well as in AML.
XPA is a key player in the DNA repair system. A previous study reported an association
of XPA polymorphisms with prognosis in various cancers (Liu et al., 2012). Another study demonstrated that patients with high XPA expression showed better OS than other patients in ovarian cancer. In the current study, we elucidated that low expression of the XPA gene was associated with poor OS in HCC, suggesting XPA as a tumor suppressor gene in HCC.
This study revealed that high FGR expression, advanced tumor stage, and age (≤ 55 years) were independent risk factors of early recurrence, while low XPA expression was an independent poor prognostic genetic marker of survival in HCC who underwent hepatic resection. FGR and XPA are relatively well known oncogene and tumor suppressor gene in other malignancies as mentioned above, however, their clinical implication have never been demonstrated in HCC patients. To our knowledge, this is the first study to demonstrate prognostic implication of FGR and XPA in patients with HCC. Furthermore, four genes (RELA, RIN1, LTBP3 and TLE4) were novel markers which were not reported in terms of function related to tumorigenesis. Studied are needed to clarify the relationship between those genes and tumor biology.
23
V.
Conclusion
In conclusion, we combined data from high-resolution array CGH and mRNA expression profiles coupled with long-term follow-up data to identify prognostic biomarkers in patients with HCC. Four potential oncogenes, FGR, RELA, RIN1, and LTBP3, were associated with shorter time to recurrence, and two potential tumor suppressor genes, TLE4 and XPA, were associated with poor OS in HCC. FGR and XPA were independent risk factor of early recurrence and poor overall survival respectively.
24
References
1. EASL-EORTC clinical practice guidelines: management of hepatocellular carcinoma. J
Hepatol 56: 908-943, 2012
2. Chen Z, Yan B, Van Waes C: The Role of the NF-kappaB Transcriptome and Proteo me as Biomarkers in Human Head and Neck Squamous Cell Carcinomas. Biomark M
ed 2: 409-426, 2008
3. Cogswell PC, Guttridge DC, Funkhouser WK, Baldwin AS, Jr.: Selective activation of NF-kappa B subunits in human breast cancer: potential roles for NF-kappa B2/p52 a nd for Bcl-3. Oncogene 19: 1123-1131, 2000
4. Edwards J, Krishna NS, Witton CJ, Bartlett JM: Gene amplifications associated with t he development of hormone-resistant prostate cancer. Clin Cancer Res 9: 5271-5281, 2003
5. Fan H, Zhang H, Pascuzzi PE, Andrisani O: Hepatitis B virus X protein induces Ep CAM expression via active DNA demethylation directed by RelA in complex with EZ H2 and TET2. Oncogene, 2015
6. Gualandris A, Annes JP, Arese M, Noguera I, Jurukovski V, Rifkin DB: The latent tr ansforming growth factor-beta-binding protein-1 promotes in vitro differentiation of em bryonic stem cells into endothelium. Mol Biol Cell 11: 4295-4308, 2000
7. Hanks SK, Quinn AM, Hunter T: The protein kinase family: conserved features and deduced phylogeny of the catalytic domains. Science 241: 42-52, 1988
8. He H, Wu G, Liu H, Cheng Y, Yu Y, Wang Y, Liu Y: Low RIN1 expression in HC C is associated with tumor invasion and unfavorable prognosis. Am J Clin Pathol 14 0: 73-81, 2013
9. Hoshida Y, Villanueva A, Kobayashi M, Peix J, Chiang DY, Camargo A, Gupta S, Moore J, Wrobel MJ, Lerner J, Reich M, Chan JA, Glickman JN, Ikeda K, Hashimot o M, Watanabe G, Daidone MG, Roayaie S, Schwartz M, Thung S, Salvesen HB, Ga briel S, Mazzaferro V, Bruix J, Friedman SL, Kumada H, Llovet JM, Golub TR: Gen e expression in fixed tissues and outcome in hepatocellular carcinoma. N Engl J Med
359: 1995-2004, 2008
10. Hu Y, Liu Y, Pelletier S, Buchdunger E, Warmuth M, Fabbro D, Hallek M, Van Ette n RA, Li S: Requirement of Src kinases Lyn, Hck and Fgr for BCR-ABL1-induced B-lymphoblastic leukemia but not chronic myeloid leukemia. Nat Genet 36: 453-461, 2004
25
11. Huang J, Sheng HH, Shen T, Hu YJ, Xiao HS, Zhang Q, Zhang QH, Han ZG: Corr elation between genomic DNA copy number alterations and transcriptional expression in hepatitis B virus-associated hepatocellular carcinoma. FEBS Lett 580: 3571-3581, 2 006
12. Hui AB, Lo KW, Yin XL, Poon WS, Ng HK: Detection of multiple gene amplificati ons in glioblastoma multiforme using array-based comparative genomic hybridization.
Lab Invest 81: 717-723, 2001
13. Hyman E, Kauraniemi P, Hautaniemi S, Wolf M, Mousses S, Rozenblum E, Ringner M, Sauter G, Monni O, Elkahloun A, Kallioniemi OP, Kallioniemi A: Impact of DNA amplification on gene expression patterns in breast cancer. Cancer Res 62: 6240-624 5, 2002
14. Katoh H, Shibata T, Kokubu A, Ojima H, Loukopoulos P, Kanai Y, Kosuge T, Fukay ama M, Kondo T, Sakamoto M, Hosoda F, Ohki M, Imoto I, Inazawa J, Hirohashi S: Genetic profile of hepatocellular carcinoma revealed by array-based comparative ge nomic hybridization: identification of genetic indicators to predict patient outcome. J
Hepatol 43: 863-874, 2005
15. Kim HS, Han HD, Armaiz-Pena GN, Stone RL, Nam EJ, Lee JW, Shahzad MM, Nic k AM, Lee SJ, Roh JW, Nishimura M, Mangala LS, Bottsford-Miller J, Gallick GE, Lopez-Berestein G, Sood AK: Functional roles of Src and Fgr in ovarian carcinoma.
Clin Cancer Res 17: 1713-1721, 2011
16. Kinzler KW, Vogelstein B: Lessons from hereditary colorectal cancer. Cell 87: 159-17 0, 1996
17. Lee JS, Chu IS, Heo J, Calvisi DF, Sun Z, Roskams T, Durnez A, Demetris AJ, Th orgeirsson SS: Classification and prediction of survival in hepatocellular carcinoma by gene expression profiling. Hepatology 40: 667-676, 2004
18. Li B, Chen P, Qu J, Shi L, Zhuang W, Fu J, Li J, Zhang X, Sun Y, Zhuang W: Ac tivation of LTBP3 gene by a long noncoding RNA (lncRNA) MALAT1 transcript in mesenchymal stem cells from multiple myeloma. J Biol Chem 289: 29365-29375, 201 4
19. Liu J, Zhang Z, Cao XL, Lei DP, Wang ZQ, Jin T, Pan XL: XPA A23G polymorphi sm and susceptibility to cancer: a meta-analysis. Mol Biol Rep 39: 6791-6799, 2012 20. Midorikawa Y, Yamamoto S, Ishikawa S, Kamimura N, Igarashi H, Sugimura H, Mak
uuchi M, Aburatani H: Molecular karyotyping of human hepatocellular carcinoma usin g single-nucleotide polymorphism arrays. Oncogene 25: 5581-5590, 2006
26
21. Mrozek K, Marcucci G, Paschka P, Bloomfield CD: Advances in molecular genetics a nd treatment of core-binding factor acute myeloid leukemia. Curr Opin Oncol 20: 711 -718, 2008
22. Naba A, Clauser KR, Lamar JM, Carr SA, Hynes RO: Extracellular matrix signatures of human mammary carcinoma identify novel metastasis promoters. Elife 3: e01308, 2014
23. Nault JC, De Reynies A, Villanueva A, Calderaro J, Rebouissou S, Couchy G, Decae ns T, Franco D, Imbeaud S, Rousseau F, Azoulay D, Saric J, Blanc JF, Balabaud C, Bioulac-Sage P, Laurent A, Laurent-Puig P, Llovet JM, Zucman-Rossi J: A hepatocell ular carcinoma 5-gene score associated with survival of patients after liver resection.
Gastroenterology 145: 176-187, 2013
24. Ning BF, Ding J, Liu J, Yin C, Xu WP, Cong WM, Zhang Q, Chen F, Han T, Den g X, Wang PQ, Jiang CF, Zhang JP, Zhang X, Wang HY, Xie WF: Hepatocyte nucle ar factor 4alpha-nuclear factor-kappaB feedback circuit modulates liver cancer progress ion. Hepatology 60: 1607-1619, 2014
25. Parkin DM, Bray F, Ferlay J, Pisani P: Estimating the world cancer burden: Globoca n 2000. Int J Cancer 94: 153-156, 2001
26. Pollack JR, Perou CM, Alizadeh AA, Eisen MB, Pergamenschikov A, Williams CF, J effrey SS, Botstein D, Brown PO: Genome-wide analysis of DNA copy-number chang es using cDNA microarrays. Nat Genet 23: 41-46, 1999
27. Pollack JR, Sorlie T, Perou CM, Rees CA, Jeffrey SS, Lonning PE, Tibshirani R, Bo tstein D, Borresen-Dale AL, Brown PO: Microarray analysis reveals a major direct ro le of DNA copy number alteration in the transcriptional program of human breast tu mors. Proc Natl Acad Sci U S A 99: 12963-12968, 2002
28. Sasaki N, Morisaki T, Hashizume K, Yao T, Tsuneyoshi M, Noshiro H, Nakamura K, Yamanaka T, Uchiyama A, Tanaka M, Katano M: Nuclear factor-kappaB p65 (RelA) transcription factor is constitutively activated in human gastric carcinoma tissue. Clin
Cancer Res 7: 4136-4142, 2001
29. Senda K, Goi T, Hirono Y, Katayama K, Yamaguchi A: Analysis of RIN1 gene expr ession in colorectal cancer. Oncol Rep 17: 1171-1175, 2007
30. Sharp NA, Luscombe MJ, Clemens MJ: Regulation of c-fgr proto-oncogene expression in Burkitt's lymphoma cells: effect of interferon treatment and relationship to EBV st atus and c-myc mRNA levels. Oncogene 4: 1043-1046, 1989
27
d CP, de Grassi A, Lee C, Tyler-Smith C, Carter N, Scherer SW, Tavare S, Deloukas P, Hurles ME, Dermitzakis ET: Relative impact of nucleotide and copy number varia tion on gene expression phenotypes. Science 315: 848-853, 2007
32. Szczepanek J, Pogorzala M, Jarzab M, Oczko-Wojciechowska M, Kowalska M, Tretyn A, Wysocki M, Jarzab B, Styczynski J: Expression profiles of signal transduction ge nes in ex vivo drug-resistant pediatric acute lymphoblastic leukemia. Anticancer Res 3 2: 503-506, 2012
33. Thomas SM, Brugge JS: Cellular functions regulated by Src family kinases. Annu Rev
Cell Dev Biol 13: 513-609, 1997
34. Tomshine JC, Severson SR, Wigle DA, Sun Z, Beleford DA, Shridhar V, Horazdovsk y BF: Cell proliferation and epidermal growth factor signaling in non-small cell lung adenocarcinoma cell lines are dependent on Rin1. J Biol Chem 284: 26331-26339, 20 09
35. Yu HF, Zhao G, Ge ZJ, Wang DR, Chen J, Zhang Y, Zha TZ, Zhang K, Zhang M, Tan YF, Zhou SJ, Jiang C: High RIN1 expression is associated with poor prognosis i n patients with gastric adenocarcinoma. Tumour Biol 33: 1557-1563, 2012
28