이용자는 아래의 조건을 따르는 경우에 한하여 자유롭게 l 이 저작물을 복제, 배포, 전송, 전시, 공연 및 방송할 수 있습니다. 다음과 같은 조건을 따라야 합니다: l 귀하는, 이 저작물의 재이용이나 배포의 경우, 이 저작물에 적용된 이용허락조건 을 명확하게 나타내어야 합니다. l 저작권자로부터 별도의 허가를 받으면 이러한 조건들은 적용되지 않습니다. 저작권법에 따른 이용자의 권리는 위의 내용에 의하여 영향을 받지 않습니다. 이것은 이용허락규약(Legal Code)을 이해하기 쉽게 요약한 것입니다. Disclaimer 저작자표시. 귀하는 원저작자를 표시하여야 합니다. 비영리. 귀하는 이 저작물을 영리 목적으로 이용할 수 없습니다. 변경금지. 귀하는 이 저작물을 개작, 변형 또는 가공할 수 없습니다.
Differential regulation of mTORc1 and
mTORc2 by expression of BTG2
/TIS21/PC3inhibits breast cancer cell growth and
malignancy
by
Santhoshkumar Sundaramoorthy
Major in Molecular Medicine
Department of Biomedical Sciences
The Graduate School, Ajou University
Differential regulation of mTORc1 and
mTORc2 by expression of BTG2
/TIS21/PC3inhibits breast cancer cell growth and
malignancy
by
Santhoshkumar Sundaramoorthy
A Dissertation Submitted to The Graduate School of
Ajou University in Partial Fulfillment of the
Requirements for the Degree of Ph.D. in Biomedical
Sciences
Supervised by
In Kyoung Lim M.D., Ph.D.
Major in Molecular Medicine
Department of Biomedical Sciences
The Graduate School, Ajou University
i
- ABSTRACT-
Differential regulation of mTORc1 and mTORc2 by expression of BTG2/TIS21/PC3 inhibits breast cancer cell growth and malignancy.
12-O-tetradecanoyl phorbol-13-acetate (TPA)-inducible sequences 21 (TIS21)-an ortholog of B-cell translocation gene 2 (BTG2) in humans and pheochromocytoma cell-3 (PC3) in rats- is an antiproliferative and early growth response gene and belongs to a family of six proteins which includes BTG1-4 and Tob1, Tob2.All these proteins contain APRO domain at the N-terminus with highly conserved sequences termed Box A and Box B. However the C-terminus is less conserved except for the presence of PAM2 motif (Poly-A binding protein Motif 2) in Tob 1 and 2. BTG2 is induced following DN(Poly-A damage in a p53-dependentand -independent manner by protein kinase C-δ. BTG2 induces cell cycle arrest by inhibiting cyclin D1 and E, as well as CDK4, depending on pRB activity, and by interacting with cyclin B1/CDK1. BTG2is constitutively expressed in all human tissues but lost during the early stage of carcinogenesis and loss of BTG2 expression is associated with the size and grade of ER-positive breast cancers along with breast tumor progression. We previously reported that BTG2 inhibits invadopodia formation by downregulating reactive oxygen species (ROS) through targeting of the mDia genes and regulated AKT phosphorylation at S473 . We therefore tried to explore the mechanism of AKT activation by the BTG2gene and its outcome in breast carcinogenesis.
ii
growth; however, here, we proposed novel mechanisms of AKT1 for inhibiting both cancer progression and cancer growth following expression of the tumor suppressor, BTG2, in triple negative breast cancer cells via differential regulation of mTORc1 and mTORc2. Expression of BTG2 inhibited the mTOR-Raptor interaction, and increased mTOR binding to Rictor. BTG2 selectively induced phosphorylation of AKT1, not AKT2, by mTORc2 and reduced expression of PHLPP2, an AKT1-specific phosphatase. BTG2-induced pAKT1S473 degraded NFAT1, which regulates transcription of cytokines, chemokine receptors and possibly PHLPP2, resulting in modification of the tumor microenvironment. In human breast cancer tissues, expression of NFAT1 and PHLPP2 was significantly higher compared to the low expression of BTG2. In tsc-null and p53-null mouse embryonic fibroblasts (MEFs), BTG2 was substituted for the tsc gene, -a negative regulator of mTORc1 activation- , and was also evident in -null mice. Constitutive expression of BTG2 in the basal cells of normal mammary ducts was maintained in ductal-carcinoma in situ (DCIS) of human breast cancer but absent in infiltrating breast cancer, as examined by immunohistochemistry. Indeed, the relative risk of lymph node invasion in BTG2+ breast cancer patients was approximately 1/10th that of BTG2- patients, and overall survival of ER-LN+ breast cancer patients was significantly higher among BTG2 high expressers than low expressers. Indeed, BTG2 expression significantly inhibited the in vitro colony forming ability of triple negative breast cancer cells. We present here the signaling pathways that regulate cancer growth and progression by expression of BTG2, which inhibits cancer growth via the BTG2-tsc1/2-mTORc1-p70S6K axis and downregulates cancer progression via the BTG2-mTORc2-AKT1-NFAT1-PHLPP2 axis. Therefore, we suggest the BTG2 gene is a promising candidate to combat intractable breast cancer.
iii
TABLE OF CONTENTS
ABSTRACT ··· i
TABLE OF CONTENTS ··· iii
LIST OF FIGURES ··· vi
ABBREVIATIONS ··· viii
Part І ··· 1
I. INTRODUCTION ··· 1
II. MATERIALS AND METHODS ··· 5
A. MATERIALS ··· 5
B. METHODS ··· 5
1. Cell culture ··· 5
2. Adenoviral transduction of HeLa cells with BTG2 gene ··· 5
3. Cloning of κB-response element (κB-RE) into pGL3 basic vector ··· 5
4. Transfection analyses ··· 6
5. Chromatin immunoprecipitation (ChIP) assay ··· 6
6. Measurement of the level of reactive oxygen species ··· 7
7. Small interfering RNAs (siRNAs) and preparation of lentivirus with IκBα mutant ·· 7
8. RT-PCR ··· 7
9. Immunoblot analyses ··· 8
10. Cell synchronization and FACS analysis ··· 8
III. RESULTS ··· 9
A. BTG2 upregulates MnSOD expression in HeLa cells ··· 9
B. BTG2 activates NFκB-response element of MnSOD gene in the 2nd intron ··· 11
C. BTG2 mediated–NFκB activation is regulated by IκBα degradation ··· 14
D. BTG2-enhanced IκBα degradation is regulated by p-Akt1 ··· 17
E. BTG2 enhances G2/M arrest along with reduction of H2O2 level ··· 20
IV. DISCUSSION ··· 25
iv
Part ІI ··· 29
I. INTRODUCTION ··· 29
II. MATERIALS AND METHODS ··· 32
A. MATERIALS ··· 32
B. METHODS ··· 32
1. Cell Culture, Antibodies and Reagents ··· 32
2. Preparation of Ad-BTG2 virus and Reconstitution of BTG2 gene Expression ··· 32
3. mTOR Kinase Assays ··· 33
4. In vivo Analyses and Preparation of Mouse Tissues ··· 33
5. Chromatin Immunoprecipitation Analysis (ChIP) ··· 33
6. Immunohistochemistry and Survival Analysis ··· 33
7. Immunoprecipitation ··· 34
8. MTT assay ··· 34
9. Colony Formation assay ··· 34
10. FACS analysis: ··· 34
11. Transfections of siRNA and Plasmid DNAs ··· 34
12. Reverse transcriptional PCR and RT–qPCR ··· 35
13. Subcellular fractionation ··· 35
14. Live cell imaging of GFP-AKT PH localization ··· 35
15. GEO data analysis ··· 35
16. In-vitro Protein Purifications ··· 36
17. Statistical analysis ··· 36
III. RESULTS ··· 37
A. BTG2 differentially regulates the mTOR interaction with Raptor and Rictor ··· 37
B. Interaction of Raptor with BTG2 inhibits mTORc1 activity in breast cancer cells ·· 43
C. BTG2 upregulates mTORc2 activity in both normal and cancer cells ··· 50
D. Rictor activates AKT1, but not AKT2, in response to BTG2 expression ··· 55
E. BTG2-induced pAKT1S473 downregulates NFAT1 ··· 61
F. In vivo evidence of BTG2 expression that blocks breast cancer invasion ··· 69
IV. DISCUSSION ··· 78
v
REFERENCES ··· 83
국문요약 ··· 94
vi
LIST OF FIGURES
Fig. 1. Upregulation of MnSOD expression in HeLa cells by BTG2... 10
Fig. 2. Activation of NFκB-response element in the 2nd intron of MnSOD gene by BTG2 ··· 12
Fig. 3. Regulation of BTG2 mediated–NFκB activation by IκBα degradation ··· 15
Fig. 4. Regulation of BTG2-enhanced IκBα degradation via activation of PI3K-Akt1 · 18 Fig. 5. G2/M arrest along with reduction of H2O2 level in the BTG2 expresser ··· 21
Fig. 6. Crosstalk between PI3K-Akt and NFκB pathways after BTG2 expression ··· 24
Fig. 7. Forced expression of BTG2 induces AKT phosphorylation at Ser473 residue ··· 39
Fig. 8. BTG2 differentially regulates interaction of mTOR with Raptor and Rictor ···· 41
Fig. 9. Expression of BTG2 induces AKT phosphorylation that is localized to the cell membrane ··· 44
Fig. 10. Interaction of Raptor with BTG2 inhibits mTORc1 activity ··· 46
Fig. 11. Expression and activity of tsc1/2 can be upregulated by the BTG2 gene ··· 48
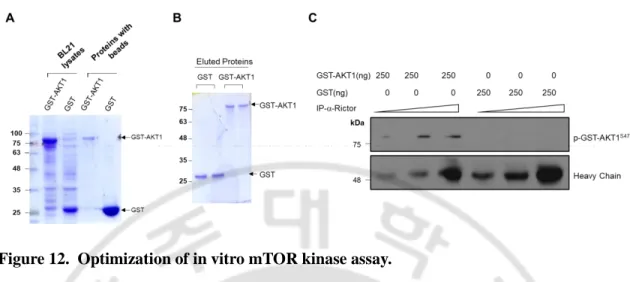
Fig. 12. Optimization of in vitro mTOR kinase assay ··· 51
Fig. 13. BTG2 upregulates mTORc2 activity in normal and cancer cells ··· 52
Fig. 14. Regulation of BTG2-mediated pAKT-S473 by PKCα ··· 54
Fig. 15. Rictor activates AKT1, but not AKT2, in response to BTG2 expression ··· 56
Fig. 16. PHLPP2 RNA and protein levels are elevated in human breast cancer cells and tumor tissues ··· 59
Fig. 17. BTG2-dependent modification of NFAT1 protein can be regulated by myristoylated AKT in the malignant breast cancer cells ··· 62
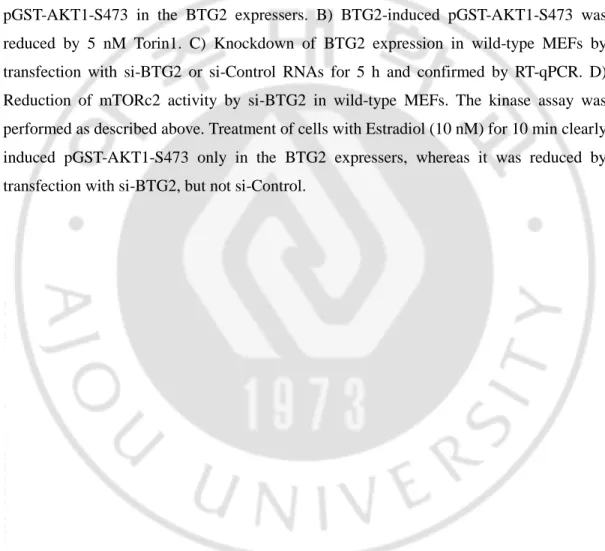
Fig. 18. BTG2-induced pAKT1-S473 downregulates NFAT1 activity in malignant cancer cells, which inhibits PHLPP2 expression ··· 64
Fig. 19. NFAT1 may be a AKT substrate and PHLPP2 gene can be a potential target of NFAT1 ··· 66
vii
Fig. 21. Differential expressions of BTG2 and AKT in normal and infiltrating ductal carcinoma of human breast ··· 73 Fig. 22. GEO data analysis show positive correlation between BTG2 and RICTOR (mTORc2) but negatively with PHLPP2 ··· 77 Table 1 ··· 82
viii ABBREVIATIONS:
BTG2: B-cell translocation gene 2; TIS21: TPA-inducible sequences 21; mTOR: mammalian target of rapamycin; RICTOR: Rapamycin insensitive companion of mTOR; PI3K: phosphatidylinositol 3-kinase; S6K1: Ribosomal protein S6 kinase 1; TSC: Tuberous sclerosis complex; GST: Glutathione S-transferase; PDK1: phosphoinositide-dependent kinase 1; siRNA: Small interfering RNA; DNA-PK: DNA-phosphoinositide-dependent protein kinase catalytic subunit; MEFs: Mouse embryonic fibroblasts; KO: Knockout MTT: 3-(4,5-Dimethylthiazol-2-yl)-2,5-diphenyltetrazolium bromide. GSK: Glycogen synthase kinase; ILK: Integrin-linked kinase; PKB: Protein kinase B; ser: serine; NFAT1: Nuclear factor of activated T cells ; RT-qPCR: RT quantitative –PCR: MnSOD: Manganese superoxide dismutase; IκB: Inhibtior of NF-κB; NF-κB: Nuclear factor kappa B; IKK: IκB Kinase; ROS: Reactive oxygen species.
- 1 -
Part. Ι
B-cell translocation gene 2 mediates crosstalk between PI3K/Akt1
and NFκB pathways which enhances transcription of MnSOD by
accelerating IκBα degradation in normal and cancer cells
I. INTRODUCTION
Human BTG2 belongs to the antiproliferative (APRO) gene family along with its orthologs, rat PC3 and mouse TIS21 [Matsuda S et al., 2001]. It potentiates NGF-induced differentiation of PC12 cells and protects neurons from apoptosis [Corrente G, et al., 2002]. In contrast, overexpression of BTG2 significantly enhances reactive oxygen species (ROS) generation after doxorubicin treatment of HeLa cells via burst of H2O2 by induced manganese-containing superoxide dismutase (MnSOD) without regulating catalase and glutathione peroxidase expression [Lim YB et al., 2008]. The APRO gene, including TIS21 [Fletcher BS et al., 1991], PC3 [Bradbury A, et al., 1991] and BTG2 [Rouault JP et al., 1996], has originally been reported as a primary response gene transiently expressed in the established cell lines in response to various stimulations, however, BTG2(BTG2) expression in mouse and human tissues has been shown to be rather constitutive [Melamed J et al., 2002], and it is found to be significantly reduced during carcinogenesis in the epithelial cells of thymus [Lim IK et al., 1995], prostate [Ficazzola MA et al., 2001], kidney [Struckmann K et al., 2004], breast [Kawakubo H et al., 2004], liver [Park TJ et al., 2008] and brain [Farioli-Vecchioli S et al., 2012]. Furthermore, the loss of BTG2 expression is related significantly with tumor grade, metastasis and resistance to cancer treatment, especially in the estrogen receptor positive breast cancers [Takahashi F et al., 2011]. In addition, BTG2 regulates cancer cell migration via regulations of ROS level and chemokines Cxcl3 and Cxcl12 [Farioli-Vecchioli S et al., 2012, Lim SK et al., 2012]. It has been reported that BTG2 plays a major role at the downstream of p53 gene [Kannan K et al., 2001], inhibits Ras-induced cell transformation [Boiko AD et al.,
- 2 -
2006] by inhibiting its activation to RasGTP via direct interaction with Ras protein [Buganim Y et al., 2010]. Therefore, BTG2 is also involved in the regulation of mutant p53 activities via inhibiting Ras-related cancer gene signatures [Solomon H et al., 2012]. All the above mentioned findings together strongly suggest the important roles of BTG2 played in carcinogenesis. BTG2 also regulates both G1/S and G2/ M phase arrest independent of p53 and pRB expression; G1/S phase arrest is regulated by inhibiting synthesis of cyclin E and cdk4 activity independent of pRB [Lim IK et al ., 1998], whereas BTG2 regulates G1/S progression in Prb dependent manner by reducing cyclin D1 expression [Guardavaccaro D et al., 2000]. Furthermore, BTG2 strongly induces G2/M phase arrest in U937 myelomonocytic leukemia (p53 null) and Huh7 (p53 mutant) hepatoma cells [Ryu MS et al., 2004], therefore, we earlier suggested BTG2 as a pan-cell cycle inhibitor independent of p53 and pRB activities via interaction with Pin1 in response to EGF stimulation [Hong JW et al., 2005]. Several reports suggest that BTG2 protein is a general activator of mRNA deadenylation. BTG2 overexpression caused accelerated deadenylation of reporters and of endogenous transcripts. It directly interacts with Caf1 which is a component of the CCR4–NOT deadenylase complex. These observations for the first time showed the role of BTG2 in the general control of mRNA decay [Mauxion F et al., 2008, Mauxion F et al., 2009, Winkler GS et al., 2010 ]. As mentioned above, BTG2 enhances MnSOD expression in HeLa cells after treatment with doxorubicin [Lim YB et al., 2008] and MnSOD has been suggested as a new type of tumor suppressor [Bravard A et al., 1992]. Overexpression of MnSOD inhibits the growth of a wide variety of cancer cells and protects oxygen-utilizing cells from the toxicity of ROS under physiologic condition [Church SL et al., 1993]. Furthermore, MnSOD expression is regulated at the transcriptional, translational and posttranslational levels, and Sp1 and AP-2 are reported to be homeotic transcriptional regulators of MnSOD [Xu Y et al., 1999, Xu Y et al., 2002], whereas induction of MnSOD expression requires the binding of NF-κB transcription factor (p65) to the enhancer element in the intron-2 of MnSOD gene [Xu Y et al., 1999]. In addition, acetylation of MnSOD influences its enzymatic activity in response to nutrient status or oxidative stress at the posttranslational level [Ozden O et al., 2011]. In the present study, we attempted to
- 3 -
answer the questions of whether MnSOD can be a direct transcriptional target of BTG2 or not, what is the mechanism of MnSOD induction by BTG2, what kinds of signal pathways regulate the induction of MnSOD expression, and what is outcome of MnSOD induction by BTG2 in cancer and normal cells. In fact, various lines of evidences suggest that free radical-scavenging agents inhibit neoplastic processes at the cellular and molecular levels [Burdon RH et al., 1993]. Tumor cells are low in MnSOD activity and its expression, compared to normal counterparts [Bravard A, et al., 1992], therefore, tumor cells may particularly be able to accumulate higher levels of superoxide or hydrogen peroxide than the normal, which may enhance survival and proliferation of the cancer cells. We observed in the present study that the expression of MnSOD was upregulated by BTG2 at the transcription level via degradation of IκBα in cancer and normal cells, and that underlying mechanism of APRO effect of BTG2 involved the crosstalk between PI3K-Akt1 and NFκB pathways, which resulted in the scavenge of ROS and increased p21WAF1 expression.
- 4 -
Purpose of this study
We have previously reported that BTG2 downregulate reactive oxygen species and also enhances susceptibility of cancer cells to Doxorubicin by inducing oxidative damage. In the same study we observed see a clear upregualtion of MnSOD when BTG2 was administered alone. Therefore we hypothesized that BTG2 might scavenge ROS in cancer cells by upregulating MnSOD and proceeded to find the mechanism of its activation. In the present study, we have investigated the mechanism of MnSOD upregulation and found that MnSOD transcripts were significantly upregulated when cancer cells were overexpressed with BTG2 by activating NFκB pathway by accelerating IKBdegradation.
- 5 -
II. MATERIALS AND METHODS
A. MATERIALS
Antibodies against α-tubulin, hemagglutinin (HA), IκBα, pIKKα/β-Ser176, pAkt, cyclinB1, p21WAF1 and BTG2 were purchased from Santa Cruz (Santa Cruz, CA), glutathione peroxidase (GPX), SOD1, MnSOD and catalase were from the Lab Frontier (Lab Frontier Life Science Institute, Seoul,
B. METHODS
1. Cells cultureHeLa cells were cultured in DMEM medium supplemented with 10% heat inactivated fetal bovine serum (FBS) in a humidified atmosphere containing 5% CO2 at 37°C. Wild type mouse embryo fibroblast (MEF) were prepared in our laboratory with 13.5 day old embryos isolated from wild type and BTG2-/- mice, and then cultured in DMEM with 10% FBS.
2. Adenoviral transduction of HeLa cells with BTG2 gene
Ad-BTG2 virus was prepared in our laboratory according to the method described previously [Park TJ et al., 2008] and infected to HeLa cells for 5 h, and then incubated in the complete media for 48 h until subjected to various analyses. Infection of Ad-LacZ was employed as the control of adenoviral transduction.
3. Cloning of κB-response element (κB-RE) into pGL3 basic vector
Cloning of enhancer element of MnSOD gene was performed in our laboratory by PCR amplification using human genomic DNAs isolated from HeLa cells as the template, and the upstream and downstream primers were obtained from the 2nd intron of MnSOD gene,
5′ ACCTCGAGTGATTGTGTTTGAAGTAAATG-3′ and 5′
AAAAAGCTTTGATTCCACAAGTAAAGG-3′, respectively. PCR amplification was performed using pfu polymerase (Takara Inc., Japan) according to the protocol;
- 6 -
Denaturation at 95°C for 30s, annealing at 55°C for 30s, and elongation at 72°C for 60s. The amplified PCR products were digested with XhoI and HindIII, and then subcloned into pGL3 basic luciferase reporter vector purchased from Promega (Madison, WI) using the same sites. The recombinant DNA sequences, κB-RE, were confirmed by nucleotide sequencing (Genotech Corp., Daejeon, Korea).
4. Transfection analyses
Increasing amounts of BTG2 cDNAs were cotransfected with either promoter construct or
κB-RE of MnSOD gene using Metafectane reagent (BionTex, Munich, Germany) and thymidine kinase promoterdriven Renilla luciferase plasmid as a control DNA. The activity of luciferase was measured by TD 20/20 luminometer (Turner BioSystems, Sunnyvale, CA) according to the instructions for the Dual-Luciferase Reporter Assay System (Promega, Madison, WI). All transfection experiments and luciferase assays were carried out in triplicate and repeated more than twice. Reporter construct
5. Chromatin immunoprecipitation (ChIP) assay
Binding of activated NFκB to the κB-RE was analysed by ChIP assay. Cells fixed with 1% formaldehyde were washed twice using ice-cold PBS containing protease inhibitors (1.0 mM PMSF, 1.0 μg/ml aprotinin, and 1.0 μg/ml pepstatin), and the cell pellets collected by centrifugation at 5,000 × g for 5 min at 4°C were resuspended in the lysis buffer (50 mM Tris–HCl, pH 8.1, 10 mM EDTA, and 1.0% SDS) containing protease inhibitors. Cross-linked chromatin was sonicated on ice to shear DNA to 200 to 1000 bp length and then centrifuged at 13,000 × g for 10 min to remove cell debris. The soluble chromatin was then diluted 10-fold in ChIP dilution buffer (16.7 mM Tris, 167 mM NaCl, 1.1% Triton X-100, and 0.01% SDS). The diluted soluble chromatin fraction was pre-cleaned by 30 μl protein Gagarose beads. Pre-cleaned chromatin was mixed with the anti-p65 antibody (ChIP grade, Santa Cruz) overnight at 4°C. Parallel control experiments were also performed with pre-immune control precipitates using unstimulated IgG. The antibody chromatin complex was pulled-down with protein G beads for 2 h rotation at 4°C. Protein G beads were then washed by rotation at 4°C with 400 μl of buffer in the following order; low salt immune complex wash buffer (20 mM Tris–HCl, pH 8.1, 150 mM NaCl, 2 mM EDTA, 1% Triton
- 7 -
X-100, 1% SDS), high salt immune complex wash buffer (20 mM Tris–HCl, pH 8.1, 500 mM NaCl, 2 mM EDTA, 1.0% Triton X-100, 1.0% SDS), LiCl immune complex wash buffer (10 mM Tris–HCl, pH 8.1, 0.25 mM LiCl, 1.0% deoxycholate, 1.0% Nonidet P 40, 0.1% SDS), followed by two washes with 10 mM Tris–HCl, pH 8.1 with 1.0 mM EDTA, pH 8.1. Precipitated immune complexes were eluted twice with 250 μl of elution buffer (1.0% SDS, 0.1 M NaHCO3) at room temperature for 15 min each. Reversal of cross-linking was performed by adding 20 μl of 5 M NaCl to the elution mixture and heating at 65°C overnight. The elutes were mixed with 0.5 M EDTA, 1.0 M Tris (pH 6.5) and 2 μl of 10 mg Proteinase K and shaken well. DNAs recovered by phenol:chloroform extraction and ethanol precipitation were resuspended in nuclease-free water for PCR amplification using the primers described Table 1.
6. Measurement of the level of reactive oxygen species
The intracellular H2O2 concentration was measured by FACS analysis using 20 μM 2′,7′-dichlorodihydrofluorescein diacetate (H2-DCFDA, Molecular Probes). Cells infected with Ad-BTG2 or Ad-LacZ were pretreated with H2-DCFDA for 10 min and then the fluorescence of dichlorodihydrofluorescein derived from oxidation of H2-DCFDA was measured.
7. Small interfering RNAs (siRNAs) and preparation of lentivirus with IκBα mutant The five sets of siBTG2 sequences and one set of siAtk1 used in the experiments are
described in the Table 1. The mixture containing siRNAs was prepared with a concentration of 4 μM each and used for transfection of normal and cancer cells using Lipofectamine 2000 (Invitrogen, Carlsbad, CA) according to the manufacturer’s instruction. Lentivirus with IκBα-mutant was prepared in 293 T cells by cotransfection of IκBα-mutant (Ser32, Ser36 to Ala32, Ala36) and pCMV-VSV-G helper constructs using Lipofectamine 2000. Viral supernatants were harvested in 48 h and filtered through a 0.22 μm filter (Millipore). HeLa cells (2 × 10⁵
/60 mm-diameter) were transduced with 250 μl of the supernatant. Culture medium was changed in 12 h and maintained for 2 days until analysis.
- 8 -
Total cellular RNAs (1.0 μg) isolated with RNAiso Plus were used for cDNA preparation
and then amplified by PCR kit (Takara Inc., Japan); First strand cDNA was synthesized using oligo-dT by reverse transcription reaction in 10 μl of reaction volume. The gene of interest was amplified by ExTaq polymerase in PCR kits using primer sequences described in the Table 1.
9. Immunoblot analyses
Cells were sonicated with RIPA buffer [50 mM Tris/ HCl, pH 7.5, 150 mM NaCl, 1.0% Nonidet P-40, 0.1% SDS, 0.5% deoxycholic acid, 50 mM sodium fluoride, 1.0 mM sodium vanadate, 1.0 mM phenylmethylsulfonyl fluoride (PMSF), 1.0 μg/ml leupeptin], and 40 μg of cell lysates were resolved on 8 to 12% SDS-PAGE in 25 mM Tris-glycine buffer. The gel-resolved proteins were then transferred to nitrocellulose membrane. The membranes were blocked with 5% nonfat skim milk in PBS containing 0.05% Tween 20 (PBST) for 1 h and then incubated with respective antibodies overnight at 4°C. Nitrocellulose membranes were washed three times with PBST and then incubated with horseradish peroxidaseconjugated secondary antibodies for 1 h. ECL (Amersham Biosciences, UK) kit was employed to visualize protein expression levels. Protein bands were quantified by relative optical densities using Image J software.
10. Cell synchronization and FACS analysis
HeLa cells were synchronized with 1.0 mM thymidine treatment for 20 h, released for 9 h and then treated again with thymidine for 13 h more before release from the treatment. In the meantime, cells were infected with 100 moi of Ad- BTG2 or Ad-LacZ for 5 h. Cell cycle analysis was performed by flow cytometry (BD FACScan II, BD Biosciences, San Jose, CA) after staining the DNA content with propidium iodide (Sigma) according to the manufacturer’s instruction. Cell cycle phases were analyzed by ModFit software.
- 9 -
III. RESULTS
A. BTG2 upregulates MnSOD expression in HeLa cells
We earlier showed that BTG2 sensitizes HeLa cells to doxorubicin treatment via induction of endogenous MnSOD expression [Lim YB et al., 2008]. To investigate molecular mechanism involved in MnSOD induction by BTG2, we overexpressed BTG2 gene in HeLa cells by DNA transfection and viral transduction, and found that BTG2 upregulated MnSOD expression in the dose-dependent manner both in its mRNA (Figure 1A and 1C) and protein (Figure 1B) levels. On the other hand, endogenous level of MnSOD expression in the BTG2−/− MEF along with wt-MEF was much lower in the BTG2−/− MEF than the control (Figure 1D), suggesting that the effect of BTG2 on MnSOD expression was both endogenously and exogenously regulated in mouse fibroblasts and cancer cells, and that there is a possibility of MnSOD gene as a direct target of BTG2.
- 10 -
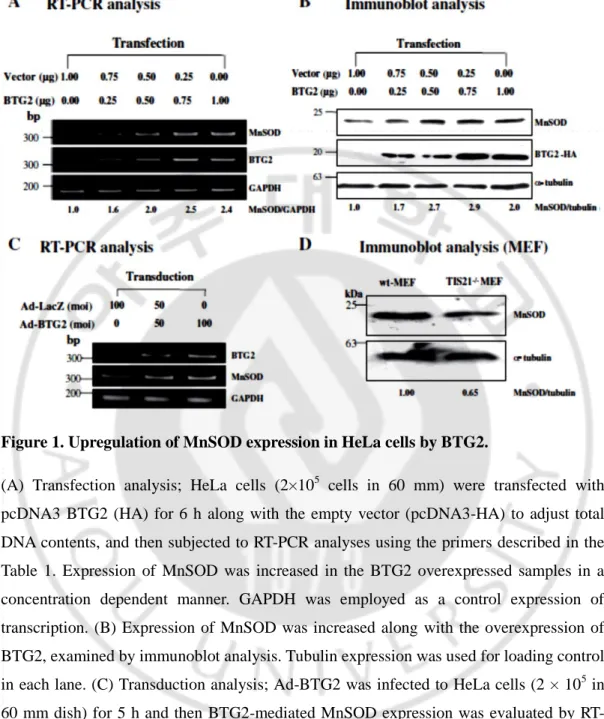
Figure 1. Upregulation of MnSOD expression in HeLa cells by BTG2.
(A) Transfection analysis; HeLa cells (2×10⁵ cells in 60 mm) were transfected with pcDNA3 BTG2 (HA) for 6 h along with the empty vector (pcDNA3-HA) to adjust total DNA contents, and then subjected to RT-PCR analyses using the primers described in the Table 1. Expression of MnSOD was increased in the BTG2 overexpressed samples in a concentration dependent manner. GAPDH was employed as a control expression of transcription. (B) Expression of MnSOD was increased along with the overexpression of BTG2, examined by immunoblot analysis. Tubulin expression was used for loading control in each lane. (C) Transduction analysis; Ad-BTG2 was infected to HeLa cells (2 × 10⁵ in 60 mm dish) for 5 h and then BTG2-mediated MnSOD expression was evaluated by RT-PCR. Expression of MnSOD was increased after Ad-BTG2 transduction. (D) To evaluate effect of endogenous gene on the expression of MnSOD, wild type-MEF and BTG2 knockout MEF lysates were subjected to immunoblot analysis. Endogenous level of MnSOD expression was lower in the BTG2−/−MEF than the wt-MEF, when measured by Image J software.
- 11 -
B. BTG2 activates NFκB response element of MnSOD gene in the 2nd intron
To investigate a mechanism of MnSOD induction by BTG2 in HeLa cells, we performed luciferase assay using the promoter DNA construct (−2215 to +42) of MnSOD gene ligated to the upstream of luciferase, however, there was no difference in the promoter activity by the expression of BTG2 gene (Figure 2A), except by Sp1, the positive control. Since inducible expression of MnSOD has been shown to be regulated by NFκB binding to the enhancer element of MnSOD gene [Xu Y et al., 1999], we subcloned the NF-κB response element (κB-RE) into the pGL3-BASIC vector and performed luciferase analysis with or without BTG2 coexpression. As shown in Figure 2B, the luciferase activity was increased with BTG2 coexpression, suggesting that BTG2 enhances the activity of κB RE in the MnSOD gene. Proteins of the transfected genes were monitored by immunoblot analyses and presented under the Figure 2A and 2B. To further investigate the BTG2-mediated activation of κB-RE of MnSOD gene, the activation of NFκB pathway in HeLa cells was evaluated by measuring the degradation of IκBα in proteasome [Alkalay I et al., 1995]. Increasing amounts of BTG2 expression significantly enhanced the degradation of IκBα protein along with MnSOD expression (Figure 2C). Moreover, when the cells were treated with MG132 to block ubiquitin proteasome pathway, BTG2-mediated MnSOD induction was accordingly reduced (Figure 2D). The data support our observation in Figure 2B that BTG2 increased transcription of MnSOD through the activation of κB-RE. To further confirm the activation of NFκB by BTG2, we performed ChIP analysis using the cell lysates obtained from the BTG2 and the LacZ expressers. As expected, the interaction of p65 with κB-RE was observed only in the BTG2 expresser, but not in the control (Figure 2E, lower panel). Since TPA has been known to induce MnSOD through NFκB pathway [DiDonato J et al., 1996; Kiningham KK et al., 2001], TPA treatment (100 ng/mL for 2 h) was employed as a positive control for the ChIP analysis. As expected, TPA induced binding of p65 to κB-RE of MnSOD gene (Figure 2E, upper panel). To further evaluate the upstream kinase of IκBα, phosphorylation of IKKα/β on serine176 residue was examined, and its minimal activation was observed along with significant degradation of IκBα in the BTG2 expresser without any other antioxidant scavenging enzymes such as catalase, GPX, or SOD1 (Figure 2F).
- 13 -
Figure 2. Activation of NFκB-response element in the 2nd intron of MnSOD gene by BTG2.
(A) MnSOD promoter analysis; Cells (0.5×10⁵/12wells) were cotransfected with BTG2 cDNA and promoter DNA of MnSOD gene and then subjected to luciferase analysis. Transfection of BTG2 up to 100 ng failed to activate promoter of MnSOD. Sp1 cDNA was employed as a positive control. Lower panel shows protein expressions of the transfected DNAs and loading control. (B) Cells were cotransfected with BTG2 cDNA and the κB-RE before luciferase assay. Expression of MnSOD was significantly increased with transfection of BTG2, indicating the activation of κB-RE by BTG2. Immunoblot analysis shows protein expression of BTG2-HA and loading control. (C) To further investigate the regulation of NFκB activation and MnSOD induction by BTG2 expression, IκBα degradation was examined by immunoblot analysis. Note the degradation of IκBα and MnSOD expression in the BTG2-dependent manner. (D) Transduction of HeLa cells with Ad-BTG2 was performed and then treated with 10 μM of MG132 for 1 h before RT-PCR analysis. MG132 abolished induction of MnSOD expression by BTG2, suggesting the upregulation of MnSOD expression by BTG2 via proteasomal degradation of IκBα. (E) Cell lysates with the LacZ or the BTG2 expressers were subjected to ChIP analysis with anti-p65 antibody, and then the interaction was verified by PCR reaction with the primers written in the Table 1. To verify our analysis, HeLa cells were treated with or without 100 ng of 12-O-tetradecanoylphorbol-13-acetate (TPA) for 2 h and then applied to ChIP assay as a positive and negative control. Unstimulated IgG was employed to exclude the nonspecific interaction. Inputs indicate total amount of κB-RE present in the samples. Note the interactions of p65 with κB-RE only in the BTG2 expressers and the TPA treated positive cells. (F) Immunoblot analyses showing the activation of IKKα/β in the BTG2 overexpressers without any changes in the expression of other anti-oxidant enzymes.
- 14 -
C. BTG2 mediated–NFκB activation is regulated by IκBα degradation
To further confirm the specificity of BTG2 effect on MnSOD expression via NFκB activation, HeLa cells were transfected with short interfering RNAs against BTG2 (siBTG2), and the changes of MnSOD and IκBα expression were evaluated by RT-PCR and immunoblot analyses, respectively. Knockdown of endogenous BTG2 downregulated MnSOD level (Figure 3A), whereas IκBα was further accumulated (Figure 3B). Moreover, transfection of siBTG2 also reduced the effect of exogenous BTG2 on the degradation of IκBα protein in the cells (Figure 3C). To confirm the effect of IκBα degradation on the BTG2- regulated MnSOD induction, successive transductions of the lentivirus with nondegradable IκBα mutant and the Ad-BTG2-HA were performed. As shown in Figure 3D, the BTG2-induced MnSOD expression was reduced by coinfection with IκBα-mutant which was unable to be disrupted (Figure 3E), supporting the activation of NFκB by BTG2 is specific and mediated via IκBα degradation.
- 16 -
Figure 3 Regulation of BTG2 mediated–NFκB activation by IκBα degradation.
(A) To confirm the effect of BTG2 on the activation of NFκB and its regulation of MnSOD induction, the mixture of five short interfering RNAs to BTG2 (siBTG2#1 - siBTG2#5) was transfected to HeLa cells for 48 h and then expression of MnSOD was analyzed by RT-PCR. The expression was downregulated by the concentration of siBTG2 dependently, indicating the regulation of MnSOD expression by endogenous BTG2. (B) Immunoblot analysis revealing the regulation of IκBα degradation by BTG2. Knockdown of endogenous BTG2 expression by transfection of HeLa cells with 100 nM siBTG2 abolished BTG2 protein expression, in contrast to the accumulation of IκBα. (C) Transfection of siBTG2 blocked the effect of exogenous BTG2 on IκBα degradation, indicating the same effect of the exogenous BTG2 and the endogenous BTG2 genes on the regulation of NFκB activation. (D) To further evaluate the effect of BTG2 gene on the IκBα degradation and the upregulation of MnSOD expression, HeLa cells were infected with lentivirus containing IκBα mutant (Ser32, 36Ala) prepared in our laboratory. Overexpression of the mutant reduced upregulation of MnSOD transcription stimulated by BTG2 gene. (E) Complete failure of the BTG2-mediated degradation of IκBα mutant (Ser32, 36Ala), examined by immunoblot analysis.
- 17 -
D. BTG2-enhanced IκBα degradation is regulated by p-Akt1.
We have earlier shown that the activation of Akt in response to estradiol requires BTG2 expression in MEF and bone marrow precursor cells (Lin--c-Kit+-Sca1+) [Kim BC et al., 2008]. Therefore, the possibility of crosstalk between PI3K-Akt and NFκB pathways was explored. When HeLa cells were transfected with BTG2, Akt phosphorylation on Serine473 was significantly increased (Figure 4A). To further explore the crosstalk between pAkt and IκBα degradation, PI3K inhibitors (LY294002 and Wortmanin) were applied to the test system and the effect of PI3K inactivation on the expression of IκBα and Akt activation was examined.The result in the 3rd and 4th lanes in Figure 4B and 4C clearly showed the regulation of NFκB activation by PI3K-Akt signal. To further specify the role of Akt1 in the activation of NFκB pathway, HeLa cells were transfected with siAkt1 (Figure 4D) and the inhibition of BTG2-mediated IκBα degradation was examined by immunoblot analysis. As expected, knockdown of Akt1 recovered BTG2-mediated degradation of IκBα expression in the siAkt1 and BTG2 cotransfected cells (Figure 4E). Moreover, ChIP assay revealed inhibition of p65 binding to κB-RE up to 40% by cotransfection of siAkt1 and BTG2 (3rd and 4th lanes in Figure 4F). These data strongly suggest the BTG2-mediated Akt1 activation at the upstream of IκBα degradation.
- 19 -
Fig. 4. Regulation of BTG2-enhanced IκBα degradation via activation of PI3K-Akt1.
(A) Immunoblot analysis showing the significant phosphorylation of Akt at Ser473 residue in the BTG2 expresser. To explore whether there is a crosstalk between PI3K and NFkB pathways, HeLa cells transfected with BTG2 were treated with PI3K inhibitors, LY294002 (B) and Wortmanin (C), respectively, and then regulation of IκBα degradation was examined by immunoblot analyses. Note significant inhibition of BTG2-mediated IκBα degradation after treatment with PI3K inhibitors, suggesting the cross-talk between PI3K-Akt and NFκB pathways by the expression of BTG2. (D) RT-PCR revealing the specific knockdown of Akt1, not Akt2, by the short interfering RNAs to Akt1. (E) BTG2-mediated IκBα degradation was significantly inhibited by transfection of siAkt1, whereas transfection of siControl failed to change IκBα degradation at all, supporting the specific effect of Akt1 on the activation of BTG2-mediated NFκB pathway. (F) To further specify the effect of Akt1 on the BTG2-mediated IκBα degradation, transfection of siAkt1 RNA was combined with Ad-BTG2 infection in HeLa cells, and then ChIP analysis was performed with anti-p65 antibody. As expected, interaction of p65 with κB-RE was significantly reduced in the BTG2 and siAkt1 coexpressers (1.9 vs. LacZ and siControl) than that of the BTG2 alone expresser (3.3 vs. LacZ and siControl), indicating downregulation of NFκB activation by siAkt1 (over 40%) and the activity of Akt1 at the upstream of NFkB activation in the presence of BTG2 expression. Inhibition of p65 binding to κB-RE after transfection of siAkt1 was quantified by Image J software, and the relative densities of kB-RE found in the ChIP assay based on those of the Input (ChIP/Input) were showed below the Figure 4F. The experiment was repeated (n = 3).
- 20 -
E. BTG2 enhances G2/M arrest along with reduction of H2O2 level.
To explore physiologic significance of BTG2 overexpression, HeLa cells were synchronized at the late G1 and early S phases by thymidine double blocks and the cell cycle progression was monitored for 12 h by FACS analysis after the release. Figures 5A (X-axis corresponds to DNA content and Y-axis represents number of event) and 5C revealed that the expression of cyclin B1 was delayed along with G2/M arrest in the BTG2 expressers at 4 h after the release and the phenomenon is well accordant with our previous report observed in U937 cells [Ryu MS et al., 2004]. When the percentage of cells in G1 and G2 phases were calculated using the ModFit software, Figure 5B clearly revealed G2/M arrest in the BTG2 expresser, compared with the LacZ control. BTG2- mediated MnSOD induction was preceded to p21WAF1 expression (Figure 5D) and the expression of p21WAF1 was evident both in the RNA and protein levels (Figure 5E) after transduction and transfection of BTG2 gene in HeLa cells. Furthermore, BTG2 expresser scavenged intracellular H2O2 level along with cell cycle progression from G1/S to G2/M phase (Figure 5F). All the results can be supported by the notion that NFκB enhances G2/M arrest via induction of p21WAF1 [Wuerzberger-Davis SM et al ., 2005].
- 23 -
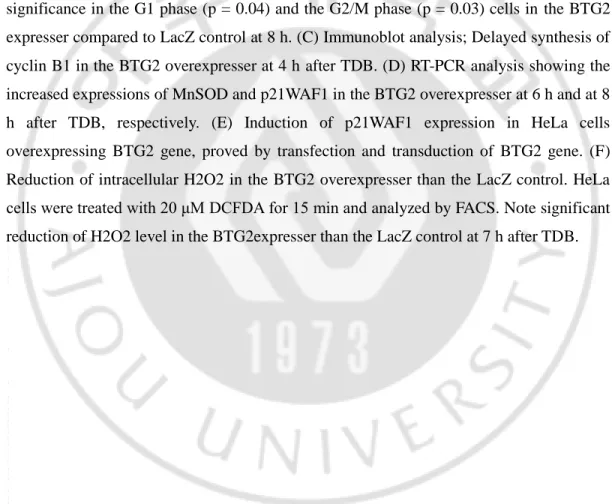
Figure 5. G2/M arrest along with reduction of H2O2 level in the BTG2 expresser.
(A) Cell cycle analysis; Cells were harvested at the indicated times after TDB for FACS analyses. The X-axis corresponds to DNA content and Y-axis indicates number of cells. Note significant G2/M arrest in the BTG2 expresser at 8 h compared with the LacZ. (B) The cells in each phase were analyzed by ModFit software, and the statistical difference between the LacZ and the BTG2 expressers were evaluated by paired t-test. Note statistical significance in the G1 phase (p = 0.04) and the G2/M phase (p = 0.03) cells in the BTG2 expresser compared to LacZ control at 8 h. (C) Immunoblot analysis; Delayed synthesis of cyclin B1 in the BTG2 overexpresser at 4 h after TDB. (D) RT-PCR analysis showing the increased expressions of MnSOD and p21WAF1 in the BTG2 overexpresser at 6 h and at 8 h after TDB, respectively. (E) Induction of p21WAF1 expression in HeLa cells overexpressing BTG2 gene, proved by transfection and transduction of BTG2 gene. (F) Reduction of intracellular H2O2 in the BTG2 overexpresser than the LacZ control. HeLa cells were treated with 20 μM DCFDA for 15 min and analyzed by FACS. Note significant reduction of H2O2 level in the BTG2expresser than the LacZ control at 7 h after TDB.
- 24 -
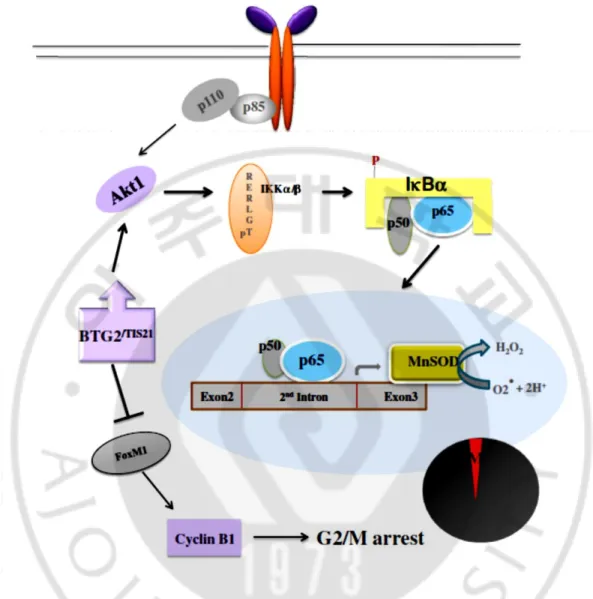
Figure 6. Crosstalk between PI3K-Akt and NFκB pathways after BTG2 expression in normal and cancer cells via activation of Akt1 and degradation of IκBα protein.
The endogenous and exogenous expressions of BTG2 significantly induces IκBα degradation via Atk1 activation in cancer and normal cells. The activated NFκB (p65) binds to the enhancer element on the 2nd intron, not promoter, of MnSOD gene and upregulates its transcription in response to BTG2 expression. The induction of MnSOD expression triggers scavenge of ROS level and the BTG2-mediated ROS reduction inhibits cell cycle progression at G2 phase entry via inhibition of cyclin B1 biosynthesis in contrast to the upregulation of p21WAF1 expression.
- 25 -
IV. Discussion
In the present study, we presented evidences on the crosstalk between PI3K-Akt and NFκB pathways after ectopic and endogenous BTG2 expressions in normal and cancer cells via activation of Akt1 and degradation of IκBα protein. The signals regulating MnSOD expression - the binding of NFκB (p65) to the enhancer element of MnSOD gene in response to BTG2 expression - significantly reduced ROS level and cyclin B1 biosynthesis as opposed to p21WAF1 induction, which resulted in G2/M arrest (Figure 6). It has been known that the homeotic expression of MnSOD is regulated by AP-2 and SP-1 binding to the promoter of MnSOD gene [Xu Y et al., 2002], whereas induced expression of MnSOD requires enhancer activation located in the 2nd intron [Xu Y et al., 1999]. Indeed, the upregulation of BTG2-enhanced MnSOD expression might be one of the intracellular cooperation between APRO gene and a tumor suppressor through the regulations of cell division cycle and intracellular ROS level, since the notion was supported by luciferase assays using promoter and enhancer element of MnSOD gene and by reverse correlations of IκBα and MnSOD expression, in addition to ChIP and immunoblot analyses (Figure 2). Specificity of the effects was further confirmed by RNA interference and IκBα (Ser32, Ser36 to Ala32, Ala36) mutant analysis in HeLa cells (Figure 3. Our present results are well supported by a recent study that BTG2 works as a coactivator of the antioxidant transcription factor, NFE2L2, which induces antioxidant gene expression including catalase and superoxide dismutases 1 and 2, thus BTG2 is able to protect human mammary epithelial cells from oxidative stress by H2O2 and other oxidants [Karve TM et al., 2012]. In contrast to our present result, HeLa cells have been shown to enhance cell death by H2O2 burst along with MnSOD induction when the cells are exposed to toxic dose (1.0 μg/ml) of doxorubicin [Lim YB et al., 2008]. Therefore, it is highly likely that the BTG2- mediated induction of MnSOD destines cell fate to either G2 arrest or cell death depending on the cellular context. Accordingly, the present study highlights the role of BTG2 as a regulator of ROS level by MnSOD induced via NFκB activation. Recently, there are several published reports on the crosstalk; in the growth and survival of primary effusion lymphoma cells [Hussain AR et al., 2012], malignant invasion and metastasis of NSCLC cells [Liang CH et al., 2013], and antiproliferative and proapoptotic effects of metformin in
- 26 -
various tumor cells [Chaudhary SC et al., 2012]. In addition, DHEA-induced proliferation of ventral prostate epithelial cells and T-cell activation are also finely tuned by NFκB activation via PI3K-Akt [Sun HZ et al., 2010; Cheng J et al., 2011]. However, the above reports did not identify any specific transducer between PI3K-Akt1 and NFκB pathways, whereas we presented here BTG2 as a signal mediator between the two pathways via accelerating IκBα degradation.
Nevertheless, how BTG2 induces Akt1 activity still needs to be characterized. The endogenous expression and activity of MnSOD are significantly downregulated in various cancer cells and tumor tissues as compared with counterpart normal cells [Dhar SK et al., 2012]. Many studies showed that deficiency of the enzyme activity might be due to the reduction of its transcription. In the present study, we presented for the first time precise signal pathways of MnSOD upregulation by BTG2, in addition to transcriptional regulation of MnSOD expression by enhancer activation of the gene in a BTG2-concentration dependant manner (Figure 1), clearly confirming the involvement of BTG2 in the regulation of MnSOD activity in vivo. In the synchronized HeLa cells, BTG2 downregulated cyclin B1 biosynthesis along with G2/M arrest (Figure 5A-5C). In addition, sequential inductions of MnSOD and p21WAF1 expressions (Figure 5D and 5E) can also be supported by the notion that NFκB enhances G2/M arrest via induction of p21WAF1 [Wuerzberger-Davis SM et al ., 2005]. Even though p21WAF1 is a p53 downstream gene, it is also regulated in the p53-independent manner by NFκB activation when the cells are treated with doxorubicin [Ma S et al., 2008], moreover, upstream promoter of p21WAF1 contains NFκB response elements [Hellin AC et al., 2000], supporting that NFκB has been considered as a transcription factor for p21WAF1 independent of p53. Fortuitously, all the available data indicate the BTG2-mediated NFκB activation via its interaction with κB-RE and subsequent upregulation of p21WAF1 in the p53 nonfunctioning cancer cells. Depending on the level of ROS, cellular responses are quite variable, ranging from transient to permanent growth arrest, or the cell cycle progression. The series of changes observed in the synchronized HeLa cells (Figure 5), e.g. delayed biosynthesis of cyclin B1 along with delayed entry into G2 phase at 4 h, increase of MnSOD expression at 6 h, significant reduction of H2O2 level at 7 h, and then p21WAF1 induction and G2/M phase
- 27 -
arrest at 8 h after the release from thymidine double blocks reflect a mechanism of APRO activity exhibited by BTG2. Nonetheless, cellular response to BTG2 expression would be diverse, depending on the cellular context and its ROS level.
- 28 -
V. Conclusion
It is well documented that cancer cells contain defective mitochondria and often reprogram their metabolic pathways to meet with their energy requirements during the process of tumor progression [Wallace DC., 2012]. The major metabolic phenotype described in Warburg effect is the shift of ATP generation from oxidative phosphorylation to glycolysis under physiologic oxygen concentration [Warburg., 1956 ]. Here, MnSOD plays a critical role in the maintenance of mitochondrial integrity, because cells lacking MnSOD are defective in ATP generation by impairing oxidative phosphorylation. Therefore, MnSOD has been regarded as a guardian of powerhouse in tumorigenesis models [Holley AK, Bakthavatchalu V et al., 2011]. Low level of MnSOD may create threat to mitochondrial function at the early stages of carcinogenesis [Oberley TD et al., 2004], therefore, cancer cells contain defective mitochondria due to lower expression of MnSOD. In that sense, it is worth to note that BTG2-induced MnSOD expression might be one of the early events of tumor suppression by maintaining the integrity of mitochondria. We have recently observed that exogenously expressed BTG2 was rapidly translocated to mitochondria in response to H2O2 in H9c2 cardiomyoblasts [Choi YW et al., 2013]. Therefore, we speculate that BTG2 might play a significant role in the modulation of mitochondrial defect in cancer cells. In vivo studies using BTG2 knockout mice might be helpful in finding the significance of BTG2 in carcinogenesis.
- 29 -
Part. ΙI
Differential regulation of mTORc1 and mTORc2 by expression of
BTG2 inhibits breast cancer cell growth and malignancy
I. INTRODUCTION
AKT has been isolated from murine lymphoma virus AKT8 [Bellacosa A et al., 1991], and AKT/protein kinase B, -a serine/threonine-specific kinase, -plays a pivotal role in multiple cellular processes, such as cell survival and death, cancer cell migration and invasion. The AKT family comprises AKT1/PKBα, AKT2/PKBβ and AKT3/PKBγ, and the kinase domains of these isoforms share homology to protein kinases A, G, and C, thereby making these proteins members of the family of AGC kinases [Franke TF et al., 2008.]. The inability of PDK1 to phosphorylate AKT at the S473 residue suggests the presence of a different protein kinase, which has tentatively been named PDK2. Experimental evidence revealed mTORc2, ILK, DNA-PK and PKC as potential candidates of PDK2 action in a cell context-dependent manner[Sarbassov DD et al., 2005; Persad S et al., 2001; Feng J et al., 2004; Partovian C et al., 2004]. Therefore, inhibition of the signaling cascade activated by AKT is considered to be an attractive target for therapeutic intervention in various cancers [Bellacosa A et al., 2005 ]. Recent data indicate opposing roles of AKT isoforms in the regulation of breast cancer migration, invasion, and metastasis versus cancer cell growth. In contrast to AKT2, which upregulates invasion and metastasis of breast cancer, AKT1 promotes mammary tumor growth, but inhibits cancer cell migration and metastasis [Arboleda MJ et al., 2003; Maroulakou IG et al., 2007; Mancini ML et al., 2016; Oom LM et al., 2015; Choi JA et al., 2016; Chin YR et al., 2010].
12-O-tetradecanoyl phorbol-13-acetate (TPA)-inducible sequences 21 (TIS21)-an ortholog of B-cell translocation gene 2 (BTG2) in humans and pheochromocytoma cell-3 (PC3) in rats- is an antiproliferative and early growth response gene [Matsuda S et al.,
- 30 -
2001] and belongs to a family of six proteins which includes BTG1-4 and Tob1, Tob2. All these proteins contain APRO domain at the N-terminus with highly conserved sequences termed Box A and Box B. However the C-terminus is less conserved except for the presence of PAM2 motif (Poly-A binding protein Motif 2) in Tob 1 and 2 [Mauxion F et al., 2009 ]. The N-terminus of human, mouse BTG2 and Tob2 is known to interact with CCR4-associated factor 1 (Caf1), also known as Cnot7 and involved in the CCR4-Not deadenylase complex [Yang X et al., 2008; Horiuchi M et al., 2009; Morel AP et al., 2003] thereby enhancing mRNA degradation significantly by accelerating Poly-A deadenylation [Mauxion F et al., 2008; Stupfler B et al., 2016; Ezzeddine N et al., 2007].
BTG2 expression in various tissues is frequently lost early in carcinogenesis [Lim IK et al., 1995; Ficazzola MA et al., 2001; Struckmann K et al., 2004; Kawakubo H et al., 2004; Farioli-Vecchioli S et al., 2007; Park TJ et al., 2008; Liu M et al., 2009] by epigenetic changes and miRNA regulation [Devanand P et al., 2014; Frampton AE et al., 2015; Tajima K et al., 2015]. BTG2 is induced following DNA damage in a p53-dependent [Rouault JP et al., 1996; Kannan K et al., 2001] and -independent manner by protein kinase C-δ [Ryu MS et al., 2004]. Overexpression of BTG2 induces cell cycle arrest in both normal and cancer cells by inhibiting expression of cyclin D1 and E, as well as CDK4, depending on pRB activity, and by interacting with cyclin B1/CDK1 [Guardavaccaro D et al., 2000; Lim IK et al., 1998]. BTG2 is constitutively expressed in several human tissues [Melamed J et al., 2002], and loss of BTG2 expression is associated with the size and grade of ER-positive breast cancers [Kawakubo H et al., 2006] along with breast tumor progression [Takahashi F et al., 2011]. The mechanism of breast cancer invasion by BTG2 is based on the inhibition of invadopodia formation by downregulating reactive oxygen species (ROS) through targeting of the mDia genes [Choi JA et al., 2016; Choi JA et al., 2013].
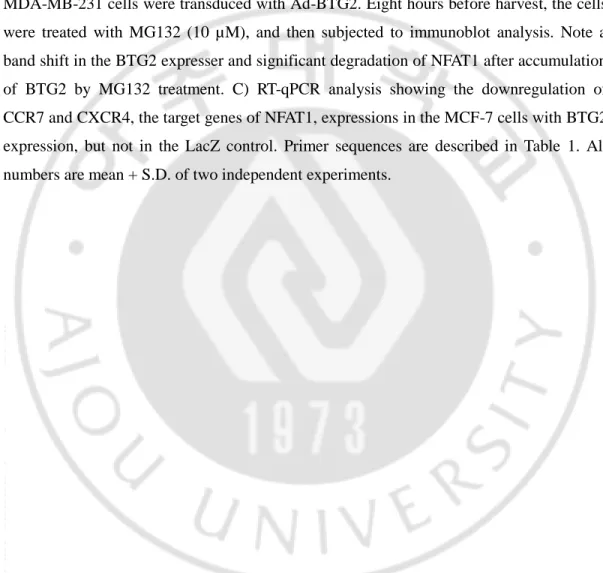
It is known that expression of NFAT1 stimulates breast cancer progression via neutrophil infiltration by IL-8 expression [Macian F., 2005; Muller MR, Rao A., 2010, 10(9): 645-656; Mancini M et al., 2009; Kaunisto A et al., 2015; Yiu GK et al., 2011], thereby promoting motility and migration of breast cancer cells, and that the myristoylated AKT-GSK3 signaling pathway enhances degradation of NFAT1 as well as downregulates its activity in breast cancer cells [Yoeli-Lerner M et al., 2009; Yoeli-Lerner M et al., 2005].
- 31 -
Purpose of this study
We previously reported that BTG2-knockout mouse embryonic fibroblasts (BTG2-KO-MEF) and hematopoietic precursor cells in female mice failed to activate AKT phosphorylation at the S473 residue, suggesting a significant role of BTG2 in the regulation of AKT activity [Kim BC et al., 2008]. We therefore tried to explore the mechanism of AKT activation by the BTG2 gene and its outcome in breast carcinogenesis. Here, we observed that activation of AKT1 by BTG2 resulted from differential regulation of mTORc1 and mTORc2, which inhibit expression of NFAT1 and PHLPP2, an AKT1-specific phosphatase. Moreover, BTG2 upregulated tsc1 expression and its activity in the p53-null condition; thus, we suggest a new mode of tumor suppressive activity of the BTG2 gene in human cancer, independent of p53 status, which involves stimulating AKT1 by mTORc2 as opposed to inhibiting mTORc1.
- 32 -
II. MATERIALS AND METHODS
A. MATERIALS
Antibodies against α-tubulin, hemagglutinin (HA), p-AKT-S473, GAPDH, AKT, p-IRS1-Y632, PKCα and GST were purchased from Santa Cruz (Santa Cruz, CA), and mTOR, Rictor, Raptor, p-p70S6K-T389, and p-mTOR-S2448 were from Cell Signalling Technology Inc. (Danvers, MA). β-actin and FLAG antibodies were from Sigma (St. Louis, MO), NFAT1 antibody was from Abcam (Cambridge, MA). Go6976 reagent was purchased from Calbiochem-Novabiochem Company (San Diego, CA). Cell treatment times and concentrations were mentioned in the legends for figures.
B. METHODS
1. Cells culture, Antibodies and Reagents
MDA-MB-231 and MDA-MB-468 were cultivated in RPMI media, EJ cells in DMEM, MEF with tsc+/+, tsc1-/- and tsc2-/- were in the DMEM high glucose media under the 5% CO2 incubator at 37°C along with 10% heat inactivated fetal bovine serum (FBS) except EJ cells (5% FBS). Antibodies against α-tubulin, hemagglutinin (HA), p-AKT-S473, GAPDH, AKT, p-IRS1-Y632, PKCα and GST were purchased from Santa Cruz (Santa Cruz, CA), and mTOR, Rictor, Raptor, p-p70S6K-T389, and p-mTOR-S2448 were from Cell Signalling Technology Inc. (Danvers, MA). β-actin and FLAG antibodies were from Sigma (St. Louis, MO), NFAT1 antibody was from Abcam (Cambridge, MA). Go6976 reagent was purchased from Calbiochem-Novabiochem Company (San Diego, CA).
2. Preparation of Ad-BTG2 virus and Reconstitution of BTG2 gene Expression
Adenovirus with BTG2 gene (Ad-BTG2) was prepared by transfection of hemagglutinin-tagged BTG2(BTG2-HA) cDNA into 293A cells according to the established method in our laboratory [Park TJ et al., 2008].
- 33 - 3. mTOR Kinase Assays
Assay protocol was adopted from Ikenoue et al []. Immunoprecipitates isolated from the cell lysates transduced with Ad-LacZ and Ad-BTG2 virus were used as the in vitro kinase source.
4. In vivo Analyses and Preparation of Mouse Tissues
Mice were maintained under the specific-pathogen-free condition and all animal procedures were followed by Ajou University Institutional Review Board. Organs collected from the BTG2-wild type (C57BL/6, 16 week-old) and BTG2-KO (17 week old) female mice (n = 3/each group/experiment) were snap-frozen in liquid nitrogen before use. Tissue homogenates were prepared in RIPA buffer and analysed by SDS-PAGE. The same protocol was applied for PHLPP2 protein expression analysis from human breast cancer tissues. All experiments used for mouse tissues were repeated more than twice. No blind experiments were performed.
5. Chromatin Immunoprecipitation Analysis (ChIP)
ChIP analysis was performed by the method described previously [Sundaramoorthy S et al., 2013]. Precipitated DNAs were analyzed for PCR amplification using Taq-DNA-polymerase (NanoHelix, Daejon, South Korea) using the primers listed in Table 1.
6. Immunohistochemistry and Survival Analysis
Immunohistochemical reactions were conducted on the 4 μm sections of formalin-fixed, paraffin-embedded tissue blocks of human breast cancers as the described method [Devanand P et al., 2014] using anti-BTG2 and anti-AKT antibodies. Clinical information about patients was collected from the Ajou University Hospital after informed consent, and tumour tissues were classified based on the degree of lymph node invasion. Tumour and the matched normal tissues were obtained according to the regulations of Institutional Review Board at the Ajou University Hospital (AJIRB-GEN-SMP-11-066). For overall survival analysis between BTG2 expression and ER:LN (estrogen receptor:lymph node) status, Kaplan-Meier analysis was performed and log-rank test was applied for the statistical significance (www.kmplot.com) [Gyorffy B et al., 2010] .
- 34 - 7. Immunoprecipitation
To explore protein-protein interaction, cells with BTG2-expressed or the control were sonicated in E1A lysis buffer (250mM NaCl, 50mM HEPES, pH7.5, 0.1% NP-40, 5mM EDTA, and protease/phosphatase inhibitors), and then subjected to immunoprecipitation as described previously [Ryu MS et al., 2004].
8. MTT assay
Proliferations of MCF-7 and MDA-MB-231 cells were analysed by 3-(4,5-dimethylthiazol-2-yl)-2,5-dipheny ltetrazoliumbromide (MTT) assay. Cells infected with Ad-BTG2 or Ad-LacZ were seeded into 96-well plates (quadruplicates) and incubated for 48 h in the fresh media, and then added 20 μl of MTT (5 mg/ml; Sigma, St. Louis, MO, USA) solution at 37°C for 4 h. The supernatants were removed, and 100 μl of dimethylsulfoxide (Sigma, St. Louis, MO, USA) was added to each well. Colour formation was analysed by absorbance at 570 nm.
9. Colony Formation assay
MDA-MB-231 and MCF-7 cells were infected with Ad-BTG2 or Ad-LacZ and incubated until 48 h, and the cells (2000 cells/60mm dish) were incubated for 14 days more. The plates were washes with 1xphosphate-buffered saline (PBS) and then stained with Crystal Violet solution (0.5%) for 30 minutes at room temperature. Finally the plates were washed with 1xPBS until individual colonies were seen clearly.
10. FACS analysis
Cell cycle analysis was performed by flow cytometry (BD FACScan II, BD Biosciences, San Jose, CA) after staining the DNA with propidium iodide (Sigma) according to the manufacturer’s instruction. Complete details of the protocol have been described elsewhere [Sundaramoorthy S et al., 2013].
11. Transfections of siRNA and Plasmid DNAs
siRNAs against BTG2, Rictor, AKT1, AKT2 and PKCα were synthesized (Genotech, Daejeon, South Korea) and transfected into cells by using Lipofectamine 2000 (Invitrogen,
- 35 -
Carlsbad, CA) according to the manufacturer’s instruction. siRNAs and the reagent mixture in opti-MEM medium (GIBCO, Life Technologies, Grand Island, NY) were added to the cells for 5h and then cultivated in the fresh media up to 48h. The siRNA sequences were described in Table 1.
12. Reverse transcriptional PCR and RT–qPCR
Total cellular RNAs were extracted from cells with RNAiso Plus (Takara Inc, Kyoto, Japan), and the RNAs (1 μg) were reverse-transcribed by the PCR kit (Takara Inc. Kyoto, Japan). The primers used are described in Table 1. The transcripts were analysed under optimal PCR conditions to avoid saturation phenomenon. The cDNAs were used for RT-qPCR analysis with the specific primers. 18S and glyceraldehyde 3-phosphate dehydrogenase gene expressions were used as the control. Reaction was carried out with Power SYBR Green PCR Master Mix (Applied Biosystems, Foster City, CA) under the following conditions; initial activation at 95°C for 15 min, followed by 45 cycles of 95°C for 20 s and 60°C for 20 s with the reaction mix.
13. Subcellular fractionation
The protein sequence of NFAT1 was obtained from Pubmed (https://www.ncbi.nlm.nih.gov/pubmed/) and then the sequences were analyzed by Scansite motif software (scansite.mit.edu/).
14. Live cell imaging of GFP-AKT PH localization
MDA-MB-231 cells transduced with either Ad-BTG2 or Ad-LacZ were transfected with GFP-AKT-PH plasmid containing the pleckstrin homology domain of AKT. The cells were incubated for 48 h and the images were taken by live cell imaging. Multiple images spanning the entire cell culture dish were taken and the cells per field were counted. GFP-AKT-PH localization to the membrane was counted and presented as percentage over the total cell numbers.
- 36 -
Datasets were downloaded from NCBI and expression data of each gene from normal and breast cancer patients were extracted. SPSS software was used to analyse Spearmen’s correlation values among the genes.
16. In-vitro Protein Purifications
Induction of GST-fusion protein was carried out in BL21 cells with isopropyl β-D-thiogalactoside (500 μM) at 30°C. The cells were lysed in PBS, pH 7.4 containing 5 mM 2-mercaptoethanol, 1 μg/ml leupeptin, and 0.5% Triton X-100, and then cell debris were removed by centrifugation (12,000 × g, 30 min, 4°C). The supernatants containing the GST-fusion proteins were purified with GSH beads (Amersham Biosciences) according to the manufacturer's instruction, and the recombinant proteins were analysed by SDS-PAGE and Coomassie blue stain. GST-S6K1 construct was transfected into HEK293A cells, and the cells were serum starved for 24h before rapamycin (30nM) treatment for 2h to obtain non-phosphorylated GST-S6K1. The cells lysates were centrifuged at 13,000 rpm for 10 mins to remove cell debris. GSH beads were added to the supernatant to purify the GST-S6K1 protein.
17. Statistical analysis
Normally distributed data was analysed by Student’s t-test for in vitro studies. Pearson’s Chi-Square tests were performed using SPSS software for analysing in vivo immunohistochemical study and followed by relative risk analysis of lymph node invasion based on the level of BTG2 expression. No statistical methods were used to predetermine sample size. Results obtained from the test samples are expressed as mean + SD versus control. P-value < 0.05 was considered as significant. Randomization and blind experiments were performed for immunohistochemistry of breast cancer.
- 37 -
III. RESULTS
A. BTG2 differentially regulates the mTOR interaction with Raptor and Rictor
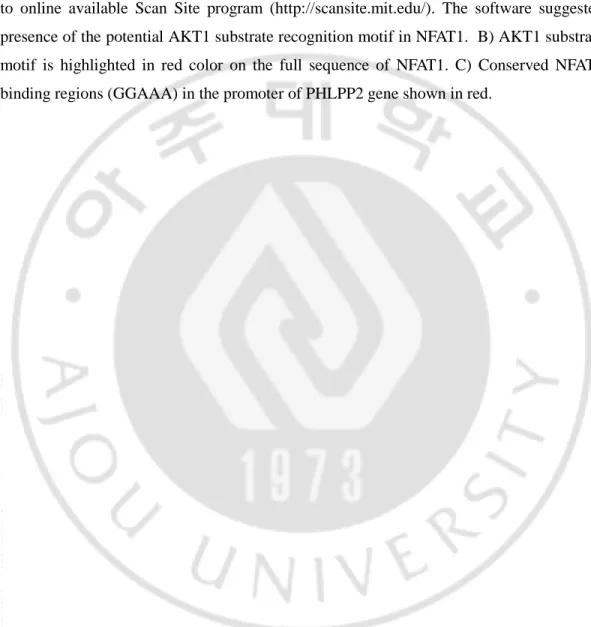
We have previously reported that BTG2 enhances phosphorylation of AKT in normal and cancer cells [Choi JA et al., 2016; Kim BC et al., 2008; Sundaramoorthy S et al., 2013]. To investigate how BTG2 activates AKT in breast cancer cells (Figure 7A, 7B), BTG2 gene transduction was employed in triple negative breast cancer MDA-MB-231 cells, and the effects of the transduced BTG2 on pAKT-S473 were confirmed using short interfering RNAs against BTG2 (Figure 7C). Cell fractionation analyses revealed greater accumulation of pAKT-S473 in the cytoplasm compared to that in the nucleus of BTG2 expressers (Figure 7D). Exogenous BTG2 interacted with endogenous AKT protein (Figure 7E) without regulating the mRNA of AKT isoforms in both invasive and non-invasive breast cancer cells (Figure 7F). Upon further examination of the activation of AKT by analyzing downstream targets, phosphorylation of GSK3β-S9, but not vimentin expression, was observed to be increased in aBTG2-dose-dependent manner (Figure 7G). Although the kinase responsible for phosphorylation of AKT-S473 is context-dependent [Persad S et al., 2001; Feng J et al., 2004; Partovian C et al., 2004], mTORc2 has been reported to be a kinase that is responsible for the complete activation of AKT [Sarbassov DD et al., 2005]. Therefore, the effects of BTG2 expression on the activities of mTORc1 and mTORc2 were evaluated by in vivo immunoprecipitation and immunoblot analyses in highly invasive MDA-MB-231 cells (Figures 1A and 1B) as well as in non-invasive MCF-7 breast cancer cells (Figure 9A). BTG2 reduced Raptor binding to mTOR (Figure 8A left panel), whereas it increased the interaction of Rictor with mTOR (Figure 8B, left panel). Measurement of the level of p-mTOR-S2448 by reciprocal immunoprecipitation with anti-Raptor and anti-Rictor antibodies also revealed inhibition of mTORc1 (Figure 8A right panel), in contrast to mTORc2 activation by BTG2 expression (Figure 8B, right panel). Figure 8C and Figure 9B show that Torin1 and PP242-dual mTOR kinase inhibitors-inhibited BTG2-induced pAKT-S473 in several breast cancer cells, substantiating the increased activity of mTOR kinase by BTG2 in both invasive and non-invasive breast cancer cells. However, rapamycin treatment failed to inhibit BTG2-induced AKT phosphorylation; instead, it enhanced the phosphorylation (Figure 8D), which strongly
- 38 -
suggests that BTG2-induced pAKT-S473 are regulated by activated mTORc2 in cells. Since BTG2 inhibited the mTOR interaction with Raptor, BTG2-regulated phosphorylation of p70S6K-a downstream effector of mTORc1-was examined, and a significant loss of p-p70S6K was observed in BTG2 expressers (Figure 8E). The data were further evaluated in MEF cells, and the results demonstrated that the basal level of p-p70S6K was much higher in BTG2-KO-MEF than that in the wild type. p-p70S6K was completely lost following rapamycin treatment in both cell types (Figure 8F), suggesting that mTORc1 activity was inhibited by BTG2 expression in normal and breast cancer cells. Considering that constitutively active p70S6K inhibits mTORc2 [Treins C et al., 2010; Liu P et al., 2013], our present data propose that BTG2-induced pAKT-S473 might be due to the de-repression of mTORc2 downstream of mTORc1, by inhibition of mTOR binding to Raptor, rather than enhancement of the mTOR-Rictor interaction.