QAR (Quick Access Recorder) 데이터 분석 기반 B777 Hard Landing
Trend Analysis
B777 Hard Landing Trend Analysis based on Quick Access
Recorder (QAR) Data
정 승 섭
김 현 덕
*한국항공대학교 항공운항학과
Chung Seung Sup
Kim Hyeon Deok
*Department of Aeronautical Science & Flight Operations, Korea Aerospace University, Gyeonggi-do, 10540, Korea
[요 약]
2019년 IATA (International Air Transport Assosiation) 보고에 따르면 하드랜딩 사고 1건으로 인해 승객 41명의 사상자가 발생하 였다. 이는 항공기의 불안정한 접근 상태에서 무리하게 착륙을 시도하여 발생한 하드랜딩 사고로 파악되었다. 하드랜딩의 주요 원인 으로 불안정한 접근, 조종사의 플레어(flare) 실수, 잘못된 계획, 갑작스러운 기상 변화 등의 여러 가지 요인들이 있을 수 있다. 본 연구
는 QAR (quick access recorder) 데이터 분석 시스템을 활용한 국내 항공사의 B777 기종에서 발생한 24건의 하드랜딩 이벤트를 항
공기 강하율(descent rate), 비행 강하각 (flight path angle), 활주로 시단 통과 고도 (threshold passing altitude), 초기 플래어 고도 (initial flare altitude) 등의 분석을 통해, 하드랜딩의 원인이 항공기 접지 전 낮은 비행경로 (low vertical path)와 조종사의 적절지 못 한 플래어 시기(late flare)로 식별하였다. 이에 하드랜딩 이벤트 경감 및 항행 안전 증진 방안으로 항공기의 안정된 접근 (stabilized approach) 과 특히 200ft 이하의 고도에서 착륙 시까지 항공기의 낮은 비행경로가 되지않도록, 일정한 강하 각 유지를 위한 조종사 의 모니터링이 중요하다는 시사점을 도출하였다.
[Abstract]
According to the International Air Transport Association (IATA) 2019 Safety Report, one accident involving hard landing has caused 41 deaths. The accident was analyzed to be caused by the pilots’ final judgement of making a forced the landing in unstabilized conditions. The factors leading to hard landings are unstabilized approach, misjudged flare, inappropriate planning, unexpected change in weather etc. This research aimed to look into detail the characteristics of hard landings by utilizing the quick access recorder (QAR) data of 24 recorded hard landing incidents of B777, such as descent rate, flight path angle, threshold passing altitude, initial flare altitude etc. The main causual factors were derived to be low vertical path and late flare. In order to promote proactive an precautionary measures, stabilized approach is emphasized as well as the continuous monitor of flight path angle below 200 ft to maintain proper vertical path.
Key word :
Hard landing, QAR, FOQA (Flight Operation Quality Assurance), Low vertical path, Late flare, Safety report.https://doi.org/10.12673/jant.2021.25.2.169
This is an Open Access article distributed under the terms of the Creative Commons Attribution Non-CommercialLicense(http://creativecommons .org/licenses/by-nc/3.0/) which permits unrestricted non-commercial use, distribution, and reproduction in any medium, provided the original work is properly cited.
Received 30 March 2021; Revised 12 April 2021 Accepted (Publication) 29 April 2021(30 April 2021)
*Corresponding Author; Hyeon Deok Kim
Tel: +82-2-300-0084
I. Introduction
The International Air Transport Association (IATA) has reported in its Safety Report that 4.5 billion passengers were carried in 46.8 million flights in the year 2019. Out of those flights, there were 53 accidents, 9% of which were cargo and 91% passenger, causing a total of 240 fatalities.
The top three categories of accidents by the number of fatalities were loss of control, hard landing, and runway excursion. 4 cases of loss of control has killed 191 persons, 1 case of hard landing have killed 41 persons, and 2 cases of runway excursion has killed 3 persons[1].
The one case of hard landing that caused 41 fatalities was the Aeroflot flight SU1492. According to the Interim Accident Report, the flight departed Sheremetyevo airport, Moscow Russia, on May 18, 2019 18:00 local time. At around 9,000 ft, a flight control system malfunction occurred, and the pilots had to divert back to Sheremetyevo Airport.
The pilots of SU1492 did not perform the required fuel dumping and proceeded the approach overweight to runway 24L. At around 1,600 ft radio altitude, ground proximity warning system (GPWS) alerted “go-around, windshear ahead” however, the pilots ignored the warning and did not go-around. At around 300 ft radio altitude, the aircraft was flying well below the glideslope casing the “glideslope” warning to go off. The pilots once again ignored the warning and continued the approach. The unstable approach was concluded by a forced and bounced landing. The first touchdown recorded 2.55 G exceeding the hard landing limit value of 1.94 G [2]. The aircraft bounced 5-6 ft due to the shock from the touchdown and landed again nose gear-first, recording 5.85 G a value almost double the first touchdown. The aircraft bounced once again, this time higher up to 15~18 ft, and made the final touchdown recording 5.00 G. The main gear was damaged in the process causing the aircraft to collapse onto its body where a fire started, killing 41 passengers and crew [3].
The accident category distribution analyzed by IATA between 2015 and 2019 shows that the excursion of runway or taxiway, is most frequent taking 25% of all accidents. Hard landing accidents come in second place taking 13% of all accidents therefore may be considered one of critical hazards of aviation accidents [1].
그림 1. 항공기 사고 및 발생률(IATA)
Fig. 1. Number of aircraft accidents & rates (IATA).
그림2. 사고 유형별 분포 (IATA, 2015-2019)
Fig. 2. Accident category distribution (IATA, 2015-2019).
In order to identify and eliminate hazards in flight, the International Civil Aviation Organization (ICAO), recommends all commercial air operators with aircraft over 27,000 kg to establish and operate a safety management system (SMS) that records and analyses flight data[4].
This research aims to look into detail the characteristics of hard landings, utilize the quick access recorder(QAR) data of recorded incidents to analyze the occurrence trend, identify and proactively eliminate the causual factors, to derive implication for mitigations measures and safe airline operations.
II. Hard Landing Definition
When an aircraft is landing, it is like when a brick "hits" the airstrip. Actually, there is a clear sense from the strike on the bottom[5]. The G-sensors on board the aircraft detects and calculates the force exerted on the aircraft.
The G-value(G) that defines hard landings is the ratio of vertical force(Fv) to the weight(w).
(1)Newton’s Second Law of Motion states that the net force applied to an object equals the resulting change in its momentum per unit time. In other words, the vertical force needed to land an aircraft equals to the change in momentum(Δp) of the aircraft over a certain period of time(Δt).
Momentum is expressed as a product of mass(m) and velocity(v). Here, the velocity is the vertical component of motion, or the vertical speed.
(3)During touchdown, the vertical speed(vi) is reduced to zero(vf).
The duration of touchdown, as measured by the G-sensors on board, is 0.1 seconds. Hence, the formula becomes:
(4)
The weight is a product of mass and the gravitational acceleration(g). The gravitational acceleration is 9.8m/s2.
(5) Substituting (4) and (5) in (1) :
(6)The mass cancels out hence, the formula becomes a function solely depending on the vertical speed(v).
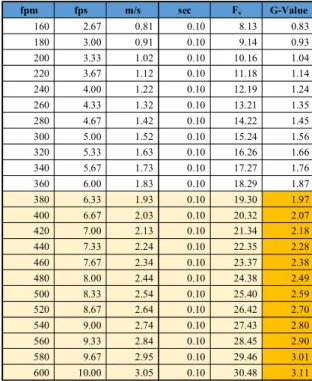
(7)It can be seen by the equation that the G-value becomes a function of the initial vertical speed observed by the QAR. Table 1 shows the relationship between the initial vertical speed and the G-value. The light shaded area is defined as a category of hard landing in terms of vertical speed. The dark shaded area is defined as hard landing in terms of G-value. Refer to 3-3 Hard Landing Event Criteria.
III. QAR Flight Data Analysis Program
3-1 Introduction to QAR
표 1. 강하율과 G값의 계산값
Table 1. G-value in relations to vertical speed.
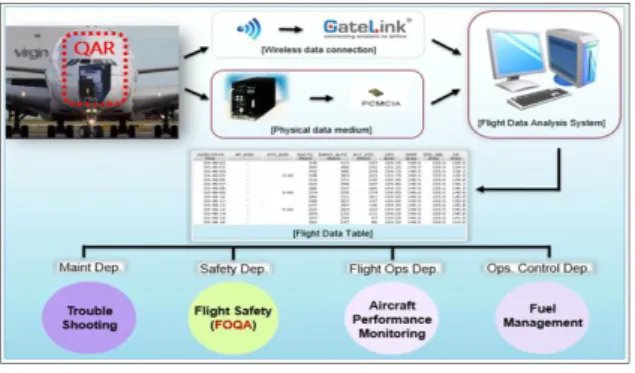
fpm fps m/s sec Fv G-Value 160 2.67 0.81 0.10 8.13 0.83 180 3.00 0.91 0.10 9.14 0.93 200 3.33 1.02 0.10 10.16 1.04 220 3.67 1.12 0.10 11.18 1.14 240 4.00 1.22 0.10 12.19 1.24 260 4.33 1.32 0.10 13.21 1.35 280 4.67 1.42 0.10 14.22 1.45 300 5.00 1.52 0.10 15.24 1.56 320 5.33 1.63 0.10 16.26 1.66 340 5.67 1.73 0.10 17.27 1.76 360 6.00 1.83 0.10 18.29 1.87 380 6.33 1.93 0.10 19.30 1.97 400 6.67 2.03 0.10 20.32 2.07 420 7.00 2.13 0.10 21.34 2.18 440 7.33 2.24 0.10 22.35 2.28 460 7.67 2.34 0.10 23.37 2.38 480 8.00 2.44 0.10 24.38 2.49 500 8.33 2.54 0.10 25.40 2.59 520 8.67 2.64 0.10 26.42 2.70 540 9.00 2.74 0.10 27.43 2.80 560 9.33 2.84 0.10 28.45 2.90 580 9.67 2.95 0.10 29.46 3.01 600 10.00 3.05 0.10 30.48 3.11 The QAR is a flight data recording device installed onboard the aircraft. The access to the system is designed to be quick and easy, and saved flight data can be downloaded from the aircraft[6]. When a flight reaches the home base of either Gimpo international airport (RKSS/GMP) or Incheon international airport (RKSI/ICN), the QAR flight data can be downloaded via wireless communication or a storage medium. The collected data is sent in electronic file format to the analysis system of flight operation quality assurance (FOQA)1). All events occurred during the flight is analyzed using the data, and not limited to the pilots’ input, other factors such as the instrument procedures, landscape, weather, etc. are considered. The analyses are used to find trends in events and identify the causes for deviating from the standard operating procedures (SOP). By eliminating these causes the system is used to promote proactive identification of hazards and improve safety of flight[7].
The result of QAR is used not only in the FOQA, but also the maintenance, flight technical team, and flight management team. The maintenance team uses the records to solve technical issues of the aircraft. Such activities decrease the unscheduled maintenance, hereby increasing the aircraft availability. The QAR data is also used in other purposes such as the monitoring of
1) FOQA (Flight Operation Quality Assurance) : Proactive safety program operated by the operator to monitor the QAR data insuring safety in flight.
aircraft performance and management of fuel efficiency.
3-2 Legal Basis of Utilizing the QAR Data
In accordance with ICAO Document Annex 6, the operators of commercial transport aircraft exceeding 27,000 kg are required to have installed on board the aircraft flight data recorder (FDR) or digital flight data recorder (DFDR), cockpit voice recorder(CVR), and to operate a flight data analysis program(FDAP). The Federal Aviation Administration (FAA), United States, through its research, also concluded that the wide implementation of FOQA program could significantly increase the safety of flight and promotes voluntary participation of FOQA program to the air operators[6].
The use of flight data must comply with the de-identification & non-punishment rules. The data needs to be independent from the operator and pilot(s) unless it is required that the specific operator and/or pilot(s) need to be reached for the safety measures or mitigation. Unless the operator and/or pilot(s) deliberately violated the SOP and/or committed criminal actions, the flight data must not be used for disadvantage or punishment[8].
그림3. QAR Data 분석 프로그램 Fig. 3. QAR Data Analysis Program.
그림 4. Hard landing 정의 기준 Fig. 4. Hard landing reference.
In the Korean aviation safety law, enforcement no.130-2, the operator of aircraft exceeding 20,000 kg must have in operation a FDAP. The aviation safety law no.58-4 states that when the operator is creating a FDAP, it must have regulations on the use and non-disclosure of flight data analysis results[9]. Based on these regulations, all Korean air operators with aircraft over 20,000kg must have a FDAP.
3-3 Hard Landing Event Criteria
In the QAR data analysis, an “event” is when a flight breaches the safety margins set on top of that defined in the SOP. These event data are used to identify the trend in flight safety, and as data by the SMS.
An “exceedance” is when the breach significantly exceeds the SOP limits enough to danger the safety of flight[10], and requires immediate mitigation measures such as pilot training or revision of SOP.
Hard landings generate high load on the aircraft gear, wings, and fuselage. This may cause damage and/or deformation of major components potentially jeopardizing the aircraft performance. In order to identify these risk factors QAR data analysis is done. The data used to identify hard landings are the vertical acceleration factor(G-value), the descent rate(fpm), the flight path angle (FPA) data from the moment of touchdown.
Events are when the vertical deceleration(G-value) exceeds 1.9 G in the QAR and either the FPA or the fpm breaches its limits. Exceedances are Events which the aircraft exceeds 360 fpm and has FPA greater than 1.8 degrees, from 0.5 seconds to the aircraft touchdown. According to Boeing’s maintenance records of hard landings, the pilots’ typically report hard landing at around 240 fpm landing[11].
IV. Boeing 777 Hard Landing QAR Data
Analysis
This research is based on 24 hard landing events recorded in an airline in Korea between 2017 and 2019. In order to narrow down the scope of research, only the events of Boeing 777-200ER and Boeing 777-300ER were taken into account.
The relations between the vertical G and descent rate, FPA and glideslope deviation, the change in wind vector during flare, threshold passing height, moment of flare, aircraft speeds, hard landing report etc. were analyzed to find causual factors contributing to hard landings, and finally to suggest proactive and precautionary measures to mitigate hard landings.
그림5. B777 분기별 Hard landing 발생 건수 및 경향성 Fig. 5. B777 Hard landing quarterly occurrence & trend .
4-1 Boeing 777 Hard Landing Trend
Figure 5 shows the trend of hard landing events from 2nd
quarter of 2017 to 1stquarter of 2019. In the 3rdand 4thquarter of
2017, the trend showed an increase where 17 hard landing events were recorded in total.2)The company sent notices to all pilots of the hard landing trend information as a preventative measure and was able to steadily decrease the event occurrence in the coming 4 consecutive quarters. The number went down to 2 in the 3rd
quarter of 2018 where it increased again in the following quarter. The 2 years trend also shows the events tend to increase approaching the Winter season due to the unstable atmosphere. By informing the pilots of seasonal trend, the pilots could take more caution in the Winter season.
4-2 Descent Rate & Vertical G
The flare moment recommended by Boeing for the B777 series is at 30 ft radio altitude. Proper flare will decrease the rate of descent to around 100 fpm by touchdown[12].
Figure 6 shows the relationship between the peak descent rate 0.5 seconds before touchdown and the G-value of hard landing events. It can be observed that in most of the cases high rate of descent was maintained until the moment of touchdown.
4-3 Flight Path Angle & Vertical G
Per given ground speed, the G-value increases when the FPA increases. The increase in FPA leads to the increase in fpm. In the ideal case where the FPA and groundspeed remain constant the vertical speed can be calculated using the below equation.
2) “B777 FOQA Trend Analysis”, Airline SMS Conference Presentation (2019)
그림6. Hard landing시 강하율과 G값의 관계 Fig. 6. Descent rate & vertical G at hard landing.
표2. FPA와 GS에 따른 강하율 계산값 Table 2. Vertical speed per FPA and GS.
0.6 0.8 1 1.2 1.4 1.6 1.8 2 2.2 2.4 2.6 2.8 3 130 138 184 230 276 322 368 414 460 506 552 598 644 690 131 139 185 232 278 324 371 417 463 510 556 602 649 695 132 140 187 233 280 327 373 420 467 514 560 607 654 701 133 141 188 235 282 329 376 423 470 517 565 612 659 706 134 142 189 237 284 332 379 426 474 521 569 616 664 711 135 143 191 239 286 334 382 430 477 525 573 621 669 716 136 144 192 240 288 337 385 433 481 529 577 625 674 722 137 145 194 242 291 339 388 436 484 533 581 630 679 727 138 146 195 244 293 342 390 439 488 537 586 635 683 732 139 147 197 246 295 344 393 442 492 541 590 639 688 738 140 148 198 247 297 346 396 446 495 545 594 644 693 743 141 150 199 249 299 349 399 449 499 549 598 648 698 748 142 151 201 251 301 351 402 452 502 552 603 653 703 754 143 152 202 253 303 354 405 455 506 556 607 658 708 759 144 153 204 255 305 356 407 458 509 560 611 662 713 764 145 154 205 256 308 359 410 461 513 564 615 667 718 770 146 155 206 258 310 361 413 465 516 568 620 671 723 775 147 156 208 260 312 364 416 468 520 572 624 676 728 780 148 157 209 262 314 366 419 471 523 576 628 681 733 785 149 158 211 263 316 369 421 474 527 580 632 685 738 791 150 159 212 265 318 371 424 477 530 584 637 690 743 796
Flight Path Angle (degrees) GS (kt)
Table 2 shows the calculated values per typical B777 ground speed on touchdown. The vertical speed(vv) can be calculated
according to the ground speed(vgs) and flight path angle (θ) :
tan
(8)Table 2 shows the calculated vertical speeds per FPA and ground speed. The light shaded area is defined as a category of hard landing in terms of vertical speed. The dark shaded area is defined as hard landing in terms of FPA. Refer to 3-3 hard landing event criteria.
The actual ground speed and FPA constantly change as the pilots make inputs for the flare[13] therefore, are different from the ideal calculated values. The actual cases are shown in Figure 7. One case in 2019 is a typical example how reality differs from the calculations. The flight had a 2.37° FPA until the pilot yanked the yoke making an abrupt pitch change in the last moment. The aircraft pitch went up to 5.6° and the recorded peak FPA 0.5 seconds before touchdown was only 1.32° however, the flight still recorded a hard landing at 2.4 G
그림7. FPA와 G값 관계 Fig. 7. FPA & vertical G.
그림8. Threshold 통과와 flare 고도 관계 Fig. 8. Threshold passing & flare altitude.
4-4 Threshold Passing & Flare Altitude
The threshold passing height and flare altitude analysis showed that most of the hard landing events had a late flare. While 30 ft is the typical flare altitude, all but two had flare above 30 ft. Most of the flights showed that the threshold passing altitude was below the normal 50 ft. Figure 8 suggests that low threshold passing height is one of causual factors to late flare.
4-5 Low Vertical Path
The vertical deviation had an increasing trend below 200ft in the hard landing events. Figure 9 shows the vertical deviation from the glide path below 200 ft. The vertical axis is in unit of “dot” deviation. The data was recorded every 50 feet of descent where it shows that most flights had an increase trend in the vertical deviation below 200 ft. Although it is difficult for the pilot to monitor the glideslope deviation below minimums, the fact that 77% of the hard landing events had low approach between 100~200 ft should be noted.
4-6 Hard Landings with Wind Variation
A total of 7 events had a headwind component change over 10 kts. Figure 10 shows the pitch change per wind change during flare.
그림9. 200 ft부터 RWY threshold까지의 G/S deviation Fig. 9. G/S deviation from 200 ft to RWY threshold.
그림10. Pitch와 정풍 성분 변화 (50 ft 미만)
Fig. 10. Pitch trend and headwind component variation
(below 50 ft).
그림11. 50 ft에서 접지까지 N1 추진력 트렌드 Fig. 11. N1 Thrust trend from 50 ft to T/D.
그림12. Hard landing 과 ground speed 관계 Fig. 12. Hard landing ground speed trend.
In order to compensate the decrease in headwind component, abrupt pitch up controls were made. In three cases, the pitch control was insufficient, and the aircraft eventually had a decrease in pitch. In one of the cases, due to an abrupt change in wind, the pilot made and excessive pitch down control after 4.3 degrees of maximum pitch, and the aircraft recorded a 1.98 G when the nose gear touched down.
Figure 11 is the N1 control input in flares with over 10 kts headwind component decrease. In order to compensate to the decrease in headwind component, the thrust was maintained at 40% at 10 ft in all of the cases however, 4 cases made a power on landing on touchdown.
Changes in the headwind component requires more attention in pilot-controlled flare. Figure 12 shows the Groundspeed, VREF and selected speed for each case (horizontal axis). In hard landings from 2019, the groundspeed and VREF showed significant difference. Case 4 recorded 2.44 G making the oxygen masks to drop. The groundspeed was recorded at 31 kts above VREF. Many flights showed that groundspeed and the Indicated airspeed can differ significantly below 200ft. This affects the 3° glide path and finally the touchdown FPA, requiring more attention from the pilots.
4-7 B-777 Hard Landing Pilot Report
The primary source for a suspected hard landing is the flight crew. Most pilots report a hard landing when the sink rate exceeds approximately 240 fpm. On-board accelerometers are notoriously unreliable indicators of heavy landings because of their low sampling rates (8 or 16 samples/sec) and because they are located near the CG and may not represent the peak loads in other parts of the aircraft[10].
A total of 36 flights(including cases insufficient for events and exceedances) have recorded over 1.9 G in the two years scope(Figure 13). 16 cases(44%) have been logged in the maintenance logbook as suspected hard landing. Only 5 cases(14%) were written in the air safety report (ASR).
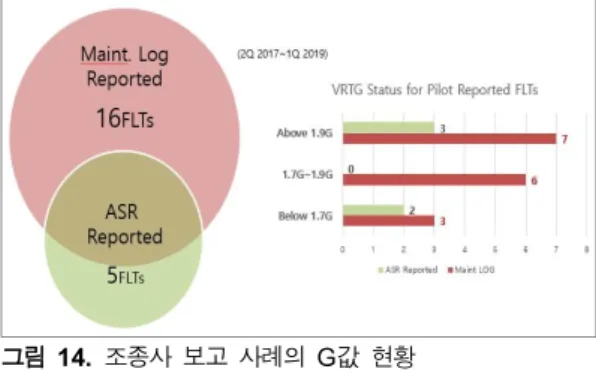
Out of the pilot reported cases (suspected hard landing and ASR cases) the QAR data shows 10 cases with over 1.9 G, 6 cases between 1.7 G and 1.9 G, and 5 cases below 1.7 G(Figure 14). This suggests that the G-values of less than 1.7 G are still enough to be recognized in the cockpit as hard landings.
The accumulated stress in the structure of the aircraft due to hard landings is a potential hazard in the health of the aircraft. This could be mitigated by the pilot’s appropriate loggings and subsequent maintenance activities.
그림13. 조종사 보고 Hard landing 사례 현황 Fig. 13. Hard landing pilot report status.
그림14. 조종사 보고 사례의 G값 현황
Fig. 14. Pilot reported flight’s vertical G status.
The lack of reporting by the pilots suggest that the pilots were reluctant to report the event. This is because the experience showed that the reports were not de-identified, and punishments or disadvantages were given to the pilots.
V. Conclusion
This research aimed to look into detail the characteristics of hard landings, utilize the QAR data of recorded incidents to analyze the occurrence trend, identify the causual factors, and finally promote proactive and precautionary measures. 24 hard landing events recorded by the QAR were analyzed. By investigating the relations between the vertical G and descent rate, FPA and glideslope deviation, the change in wind vector during flare, threshold passing height, moment of flare, aircraft speeds, hard landing report etc. the characteristics of hard landings were analyzed.
77% of the events were found to have had low and unstable vertical path between 200 ft and touchdown. In the analysis between the threshold passing height and the moment of flare, 22 events were recorded to have started the flare below 30 ft; late flare. The research provided that the low vertical path and late
flare are two of the main contributing factors in hard landings. The mitigations are suggested as follows:
First, the pilot flying (PF) must maintain stabilized approach in order to avoid low vertical path and late flare. The constant vertical path monitoring below 200 ft is highly recommended.
Second, the pilot monitoring (PM) must actively call out any deviation from the SOP in the flight path, speed, sink rate etc. for the PF to take immediate and appropriate countermeasures, or go-around. The option of going around is available until the thrust reversers or ground spoilers are deployed.
Lastly, unless the pilots have intentionally violated the SOP, or committed criminal acts, the QAR data should not be used in any way or format for disadvantage or punishment to the pilots or the companies. The de-identification and non-punishment characters are the life of the voluntary reporting system. Active hard landing reports by the pilots allow timely inspection and maintenance on the potential structural damages or stress applied on the aircraft, thereby decreasing the chance of aircraft failure.
The limitation faced in the research was the lack of data. The data sample was from a single airline over the period of two years. The data was incomplete in terms of details limiting further breakdown of each event. The research in insufficient to represent the overall trend and analysis of hard landings in Korea. For future research, QAR data from all the airlines in Korea will need to be provided through the national level of aviation safety management program.
References
[1] International Air Transport Association, Safety Report 2019, pp. 47-73, 2020.
[2] Sukhoi Civil Aircraft Company, RRJ-95B Aircraft
Maintenance Manual, Section 17-51-00, Task 200-801, pp. 606, 2017.
[3] Interstate Aviation Committee, RRJ-95B RA-89098 Interim Report, Air Accident Invesigation Commision, pp. 23-27, 2020.
[4] ICAO, Safety Management, Annex 6, Part 1, 10th Edition, pp 3.2- 6.5, 2016.
[5] C. Wang, L. Miao, and H. Sun, “An analysis based on a special hard landing incident,” in 3rd International Conference on Materials Engineering, Manufacturing Technology and Control, Taiyuan: China, pp.1-8, 2016. [6] Federal Aviation Administration, Advisory Circular 120-82,
Flight Operational Quality Assurance, pp. 1-25, 2004. [7] ICAO, Doc 10000, Manual on Flight Data Analysis
Programmes (FDAP), pp. 1.3-1.4, 1st ed. 2014.
[8] Advisory Circular, Flight Operational Quality Assurance, Federal Aviation Administration, U.S. Department of Transportation, AC No:120-82, Appendix A FOQA Enforcement policy, pp. 24, Dec. 2004.
[9] Article 58 of the Korea Aviation Safety Act (National Aviation Safety Program, etc.), revision 2019.8.28.
[10] L.Wanga, Y. Rena, C. Wub, “Effects of flare operation on landing safety: A study based on ANOVA of real flight data” The Safety Science, Vol. 102, pp.15, Feb. 2018. [11] Aero Magazine, Condition Inspection, [Internet]Available :
//www.boeing.com/comercial/aeromagazine/aero-14/non normal landing.html
[12] Boeing, Flight Crew Reference Manual, Boeing Company pp. 3.1.8-3.1.10, 2008
[13] L Wang, C. Wu, R.Sun, Z. Cui, “An Analysis of Hard Landing Incidents Based on Flight QAR Data” International Conference on Engineering Psychology and Cognitive Ergonomics, Crete: Greece, pp 398-406, 2014.
정 승 섭 (Chung Seung Sup)
2012년 2월 : 연세대학교 기계공학과 (공학사) 2018년 1월 - 2020년 10월 : 이스타항공(주) 운항승무원 2020년 3월 – 현재 : 한국항공대학교 항공운항학과 석사과정
※관심분야 : Flight data analysis, Accident Investigation, Safety Management System, B737
김 현 덕 (Kim Hyeon Deok)
1997년 3월 - 2020년 2월 : 대한항공 운항승무원 2015년 2월 –한국항공대학교 운항관리학과 박사수료
2017년 5월 - 2020년 2월 :대한항공 B777 기장, 안전보안실 사고조사관 2020년 3월 – 현재 :한국항공대학교 항공운항학과 부교수