1. INTRODUCTION
Recently, face recognition has become the important research area for natural human-computer interaction. The process of face recognition is generally composed of facial region extraction, feature extraction from acquired facial images, and recognition from extracted features. Facial region extraction is the technique which automatically extracts the position of a face from an image. In early days, facial region extraction was the stage of preprocessing for face recognition. But it has become the independent research area due to its importance. There are various techniques of facial region extraction: skin color based method using color information[1], motion information method, template matching, neural networks method[13], and snake method. The recognition methods of extracted facial images are largely classified into geometrical feature matching, statistical method[16], PCA(Principle Component Analysis) method[12], LFA(Local Feature Analysis) method, LDA(Linear Discriminant Analysis) method[3], neural networks method[11,14,15] and SVM(Support Vector Machine) method[1,9].
This paper presents an effective pattern classification model by designing an artificial neural network based pattern classifiers for face recognition. First, a RGB image inputted from a frame grabber is converted into a HSV image. Then, the coarse facial region is extracted using the hue(H) and saturation(S) components except intensity(V) component. Next, the fine facial region extraction process is performed by matching with the edge and gray based templates. To make a light-invariant and qualified facial image, histogram equalization and intensity compensation processing are performed. The finally extracted and enhanced facial images are used for training the pattern classification models. We propose a hybrid neural classifier which is combined with H-ART2(Hierarchical ART2) which has the hierarchical ART2 layer and F-LVQ(Fuzzy LVQ) which is optimized by fuzzy membership.
2. FACIAL REGION EXTRACTION
2.1 Coarse Facial Region Extraction
The RGB image inputted from a frame grabber is converted into a HSV image which is similar to the human beings' vision system. Then, the region of which color is similar to facial color is extracted using the hue and saturation components except intensity component which is sensitive to the environmental illumination. Namely, the distribution of hue and saturation components corresponding to color of human facial skin by experiential value is obtained. And then, hue and saturation mask is made from the corresponding region of the image with a certain threshold. After the common region is extracted from two masks, the final facial skin mask is generated by interpolation to obtain the complete facial skin mask. The coarse facial region including a face is extracted as the circumscribed region of that facial skin region mask.
2.2 Fine Facial Region Extraction
2.2.1 Creating Dual Template
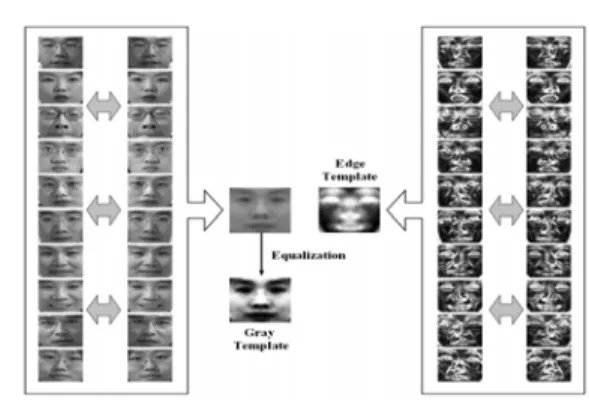
Fig. 1. Creation of dual templates
50 x 50 gray-based and edge-based template are used to minimize the interference of illumination. After facial regions
Hybrid Neural Classifier Combined with H-ART2 and F-LVQ for Face Recognition
Do-Hyeon Kim*, Eui-Young Cha*, and Kwang-Baek Kim
*** Department of Computer Engineering, Pusan University, Busan, Korea
(Tel : +82-19-506-8781; E-mail: [email protected]) **Department of Computer Engineering, Silla University, Busan, Korea
(Tel : +81-16-559-5053; E-mail: [email protected])
Abstract: This paper presents an effective pattern classification model by designing an artificial neural network based pattern
classifiers for face recognition. First, a RGB image inputted from a frame grabber is converted into a HSV image which is similar to the human beings' vision system. Then, the coarse facial region is extracted using the hue(H) and saturation(S) components except intensity(V) component which is sensitive to the environmental illumination. Next, the fine facial region extraction process is performed by matching with the edge and gray based templates. To make a light-invariant and qualified facial image, histogram equalization and intensity compensation processing using illumination plane are performed. The finally extracted and enhanced facial images are used for training the pattern classification models. The proposed H-ART2 model which has the hierarchical ART2 layers and F-LVQ model which is optimized by fuzzy membership make it possible to classify facial patterns by optimizing relations of clusters and searching clustered reference patterns effectively. Experimental results show that the proposed face recognition system is as good as the SVM model which is famous for face recognition field in recognition rate and even better in classification speed. Moreover high recognition rate could be acquired by combining the proposed neural classification models.
are manually extracted from various human face images, both templates are created from the average image of these facial regions. To minimize the interference of illumination and to get balanced templates, right-left mirror images are added. And the gray template is finally equalized.
2.2.2 Template Matching by Correlation
To improve the matching speed, we execute the matching with only facial region filtered by color information.
To eliminate the effect of template size, we use variously scaled versions of original image. Matching original image with template is performed by correlation. Given template T and image window R in original, correlation coefficient γ(T,R) is computed by Eq. (1). R T M i N j R T
N
M
j
i
R
j
i
T
R
T
σ
σ
µ
µ
γ
⋅
⋅
⋅
−
−
=
∑∑
− = − = 1 0 1 0)
]
][
[
)(
]
][
[
(
)
,
(
(1)
where, M, N are the size of image window, µT, µR are
average intensity of T,R, and σT, σR are the standard deviation
of T,R.
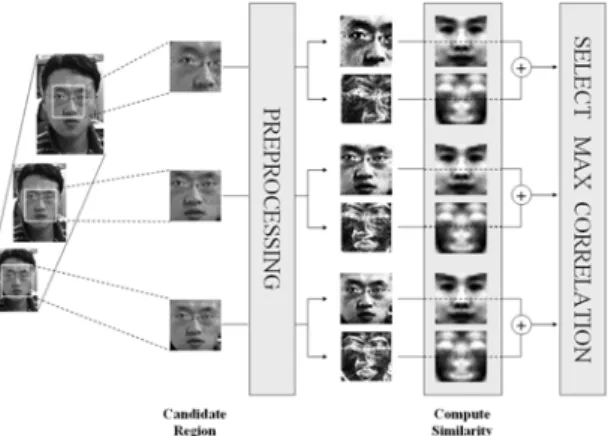
Fig. 2. Computation of similarity by correlation
After matching gray template and edge template with image window region in original image are executed, the average of both correlation coefficients is acquired. The region with the largest average correlation coefficient is set up as the optimal facial region in the current scale. This process is repeated at various scales 0.6 ~ 1.5. Then, the region with the highest correlation coefficient is determined as the final facial region.
Fig. 3. Illumination enhancement
2.3 Image Enhancement by Illumination Plane and Equalization
Generally histogram equalization is used to improve an unequal intensity distribution. However, equalization makes a dark or bright image to have equal intensity distribution in the whole. When the effect of intensity is added to image, it may result in a maximizing illumination effect and have a bad influence on recognition performance. We have designed illumination plane to compensate the effect of illumination. In other words, after the extracted facial region is divided into blocks, representative intensity values of blocks are calculated. Then illumination plane image can be generated by interpolating to the size of original image and adjust compensative amount of illumination according to the size of blocks.
3. PATTERN CLASSIFICATION MODELS
For the effective learning and classification of facial patterns, this paper proposes a H-ART2 model which is hierarchically composed of ART2 layers and an enhanced F-LVQ model which is optimized by fuzzy membership function.3.1 H-ART2
3.1.1 Hierarchical structure of H-ART2
The structure of ART2(Adaptive Resonance Theory) is determined by vigilance parameter ρ. It defines the similarity of the stored cluster patterns and a certain input pattern. Or, As
ρ is large, the diameter of a cluster is large and the cluster can
accept many input patterns. As ρ is small, the diameter of a cluster is small, many clusters can be generated, and various patterns can be stored. But, Too many clusters may result in lower recognition speed. In this paper, considering such a vigilance parameter, we proposed the Hierarchical ART2 which is consists of two layers.
H-ART2 is consist of input layer of input patterns, the clusters of the first layer connected to the input layer and the clusters of the second layer connected to the clusters of the first layer. Each cluster of the first layer as a centroid reference vector patterns is the representative pattern for representing some input patterns. In this paper, the input patterns classified into the cluster of the first layer is more specifically re-classified into the cluster of the second layer.
Fig. 4. Hierarchical structure of H-ART2
3.1.2. Learning Algorithm of H-ART2
The clusters of the first layer of H-ART2 are generated by unsupervised learning of the conventional ART2 method. The input patterns classified into the cluster of the first clusters are more specifically re-classified into the clusters of the second layer by the supervised learning algorithm which is a modified ART2 learning algorithm.
The supervised learning algorithm of ART2 is similar to unsupervised learning algorithm. But, although an input pattern may pass the vigilance test, a new cluster can be generated in the case that the class of the input pattern is different from the class of winner cluster. The supervised ART2 learning algorithm is as follows.
Step 1. Let us define that the input pattern set X={ x1 , x2 , …,
xN } , Cluster set C={ w1 , w2 , …, wc } , where, xk is k-th
input pattern, wi is the center value of i-th cluster in neural
network, N is number of input patterns, c is number of clusters, and LXk, LCi is the class label which is
representing the respective class of input pattern xk and the
center value of cluster wi respectively.
Step 2. First, Initial cluster is set as the first input pattern. Step 3. Select the cluster j* which has the minimum distance
to a new input pattern xk as the winner cluster.
)
1
(
,
min
*x
w
i
c
w
x
k−
j=
k−
i≤
≤
(2)Step 4. Perform the vigilance test of an input pattern. If input
pattern exists in the diameter of winner cluster (vigilance parameter), and both input pattern and winner cluster are same class, the input pattern is included into the winner cluster and the center value of the winner cluster wj* is updated.
1
)
(
)
(
)
(
)
1
(
* * * *+
⋅
+
=
+
t
n
t
n
t
w
x
t
w
j j j k j (3)where, nj is the number of members of j-th cluster.
Otherwise, the current input pattern is assigned to a new cluster.
Step 5. Repeat from Step 3 to Step 4 until every input pattern
is exhausted.
Step 6. Terminate learning if a designated numbers of learning
cycles is repeated or there is no change in the center values of clusters.
Pseudo code of the supervised learning algorithm is as follows.
T: number of total cycles for t = 1, 2, 3, … , T { for k = 1, 2, 3, … , N { if c==0 wc= xk , LCc=LXk , c = c+1 else
a. Find winner cluster as Eq.(2) b. Perform vigilance test
if || xk - wj* || < ρ && LCj*==LXk update current cluster as Eq.(3) else
add new cluster as current input pattern. wc= xk , LCc=LXk , c = c+1 } if Ct==Ct-1 then stop } 3.1.3 Searching Strategy
The number of clusters in ART2 is determined by vigilance parameter ρ. If the number of clusters is too large, the speed of learning and recognition becomes slow because there are too many clusters to be compared. On the contrary, if too small, the recognition rate becomes low because there is not enough space to represent various types of input patterns. Considering this trade-off, we have designed a hierarchical neural network structure for recognition performance and have introduced an appropriate method for selecting reference cluster.
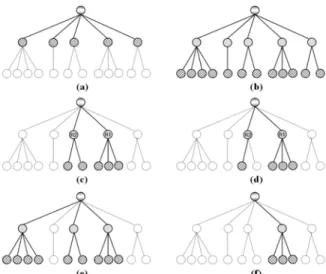
Fig. 5. Searching strategies for candidate clusters Fig. 5 (a) shows the method of selecting all clusters of the only first layer and Fig. 5 (b) shows the method of selecting all clusters of the second layer as candidate clusters. Both methods, without searching strategy, select the generated clusters as candidate clusters, and then search for the reference cluster pattern which is most similar to the input pattern, out of them. In the way of Fig. 5 (c), you obtain the distances between the input pattern and each cluster of the first layer, sort these distances and choose the size s of most similar clusters of the first layer. Finally each cluster of the second layer which is connected to the previous clusters is selected as candidate clusters.
In the manner of Fig. 5 (d), you obtain the distances between the input pattern and each cluster of the first layer, sort these distances, and choose the most similar two clusters of the first layer. For the most similar cluster of the first layer, select all clusters of the second layer which are connected to it as candidate clusters. For the next similar one cluster of the first layer, most similar one cluster of the second layer is selected as candidate cluster. Be contrary to the selection by raking strategy as Fig. 5. (c), an input pattern is classified into the class of candidate cluster which has the most frequent class out of the selected candidate clusters.
In this paper, we select the candidate clusters by relative distance ratio as Fig. 5 (e), (f). By this strategy, you obtain the distances between the input pattern and all clusters of the first layer, calculate the maximum and minimum distances and choose the corresponding clusters of the first layer whose distance are smaller than the adaptively calculated threshold, distance ratio. Finally, every cluster of the second layer which is connected to the previously chosen clusters of the first layer is selected as candidate cluster. For instance, if the cluster selection ratio is p, the minimum distance is dmin and the
which have the distance below dthreshold, are chosen as Eqs. (4) ~ (5). threshold k i
x
d
w
−≤
(4)p
d
d
d
d
threshold=
min+
(
max−
min)
×
(5)Fig. 5 (e) shows that three reference clusters of the first layer are chosen as similar clusters to the input pattern. Fig. 5 (f) shows that only one reference cluster is similar to the input pattern. This is the strong points of adaptively selecting strategy according to the similarity to the input pattern, not the fixed size of reference clusters.
H-ART2 neural network can improve recognition speed without lowering recognition rate because it choose some clusters of the first layer which are similar to the input pattern according to relative distance measure and it can compare the input pattern with only the clusters of second layer which are connected to the previously chosen clusters of the first layer.
Clusters of the first layer chosen by searching strategy are similar to the input pattern and, in the same manner, the clusters of the second layer connected to the previously chosen clusters of the first layer have similar pattern with the input pattern. On the contrary, the unselected clusters of the first and the second layer don’t have similar pattern with input pattern. Therefore fast recognition can be executed because a plenty of clusters which have no possibility are pruned. Selecting candidate clusters by adaptive distance measure, not simple similarity with input pattern, can also decrease the risk of misclassification.
3.2 F-LVQ
LVQ is closely related to VQ(Vector Quantization) and SOM(Self Organizing Map). While VQ and SOM are unsupervised clustering method, LVQ is a supervised pattern classifier and it has a fast learning scheme than the widely used BP. The aim of LVQ is to define optimal clusters in the input space. But, Drawbacks in question about the setting the initial clusters, update of reference clusters, selection of the clusters to be updated are open to further discussion. For this reasons, F-LVQ which uses the membership function of Bezdek[17] for the robust classification of variation of input patterns is designed in this paper.
3.2.1 Fuzzy membership function
The motivation behind the new F-LVQ is to estimate learning rate from the relative similarity of input x, with respect to the reference clusters.
Fuzzy membership function by Bezdek is defined as Eq.(6).
(
)
1 1 0 2/
− − =⎟⎟
⎠
⎞
⎜⎜
⎝
⎛
=
∑
c j jk ik ikd
d
U
(6)where, c is the number of reference clusters, Uik is the fuzzy degree of input vector xk with respect to reference cluster mi and it means a relative similarity under the consideration of all other clusters mj (j≠i).
3.2.2 Fuzzy LVQ
The k-NN algorithms has for its decision surface the midplane of the cluster centers of neighboring class, irrespective of the possible different probability density functions of different classes. One of the important objectives of the LVQ algorithm is to overcome this deficiency and
account for the different probability density function of different classes. This is achieved by moving the midplane of the cluster centers by small values such that they coincide with the optimal Bayesian decision boundaries. Let mi and mj are the nearest neighbors to x. mi belongs to the correct class and mj belongs to a wrong class. Moreover x must fall into a zone of values called window, which is define around the midplane of mi and mj .
Assume that dik and djk are the Euclidean distance of xk from mi and mj, respectively, then xk is defined to fall in a window of relative width w if
w
w
d
d
d
d
ik jk jk ik+
−
>
⎟
⎟
⎠
⎞
⎜
⎜
⎝
⎛
1
1
,
min
(8)Input vector x which fall into the window means a pattern likely to be misclassified. So, defining such a window is very important task. Above Eq. (8), only take the distance x between mi and mj into consideration without respect to other reference vectors. In other words, such a similarity measure has no influence about the other loser reference vectors even if these reference vectors are very close to the input vector since the winner-takes-all method ignores all loser reference vectors. In this situation, fuzzy membership degree is a suitable distance measure which represents the relative distance between input x and reference vectors. Therefore we modified windowing test as following Eq. (9).
w
w
U
U
U
U
ik jk jk ik+
−
>
⎟
⎟
⎠
⎞
⎜
⎜
⎝
⎛
1
1
,
min
(9)If the input vector falls within this window, then mi is moved farther away from the input, while mj is moved closer.
))
(
)
(
)(
(
)
(
)
1
(
t
m
t
t
x
t
m
t
m
i+
=
i+
α
k−
i (9)))
(
)
(
)(
(
)
(
)
1
(
t
m
t
t
x
t
m
t
m
j+
=
j−
α
k−
j(10)
where, 0<α<1, and α(t) may be constant or decrease monotonically with iteration.
This algorithm was based on the idea of differently shifting the decision border towards Bayes limits, while no attention was paid to what might happen to the location of mz (z≠i,j) kin the long run if the process was continued. Therefore it seems necessary to include corrections that ensure that the mz continues approximating the class distributions as Eqs. (11),(12).
))
(
)
(
)(
(
)
(
)
(
)
1
(
t
m
t
t
t
x
t
m
t
m
z+
=
z+
ε
α
k−
z(11)
if x and mz belongs to the same class.
))
(
)
(
)(
(
)
(
)
(
)
1
(
t
m
t
t
t
x
t
m
t
m
z+
=
z−
ε
α
k−
z(12)
if x and mz belongs to the different classes.
where, 0<ε(t)<1, and ε(t) also may be constant or decrease monotonically with time. In this paper, we adaptively define ε(t) as εzk(t) to reflect the membership degree of input vector on the training process as Eq. (13).
⎟
⎠
⎞
⎜
⎝
⎛ −
=
T
t
U
t
zk zk(
)
1
ε
(13)4. EXPERIMENTAL RESULTS
In this paper, facial data is acquired from the 320 x 240 x 24 (bit color) motion data of CCD camera. The number of people is 10, sex ratio is 6:4, and the ratio of people wearing glasses is 7:3. 1479 facial images of total 2215 are used to the training and the rest 736 is put to the test.Facial data are normalized with 25 x 25 and are enhanced with illumination plane and equalization. For feature extraction, both original gray images and edge images for emphasizing the outline of face are used.
4.1 Performance Evaluation of the Proposed Pattern Classification Models
4.1.1. Performance of H-ART2 model
We create the reference clusters of H-ART2 variously by changing the vigilance parameter to compare the performance according to the change of the number of clusters of the first layer and the second layer.
Three kinds of searching strategies, the strategy of searching every candidate cluster of the second layer(All), the strategy of searching only clusters of the second layer which have high similarity ranking with input pattern (Rank), and the strategy of searching only clusters of the second layer which have similarity ranking with input pattern by relative distance ratio between clusters (MinMax) are experimented. The cluster selection ratio is set up to 0.3. That is, in the strategy of searching by Rank, clusters of the first layer within 30% ranks are chosen. For example, if there is 10 clusters in the second layer, most similar 3 clusters are selected as candidate clusters. But in the strategy of searching by proposed MinMax, clusters of the first layer within 30% of max-min distance range are chosen. For example, if the minimum distance between an input vector and clusters is 10 and the maximum distance is 40 then clusters within 19 (10+(40-10)*0.3) are selected.
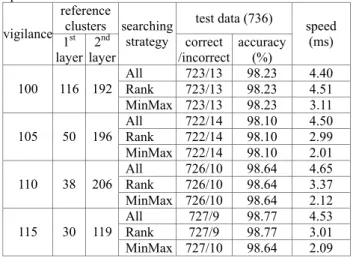
Table 1. shows the performance of the proposed H-ART2 model under various conditions. As the strategy of searching by relative distance ratio reduces the search space, it raises recognition speed as double without lowering the accuracy. 4.1.2 Performance of F-LVQ model
We create 100~150 reference clusters for easy comparison with the H-ART2 model. For comparison, LVQ1, LVQ2, LVQ3, F-LVQ model are experimented as shown in Table 2.
Table 1. Comparison of H-ART2 pattern classification model performance
reference
clusters test data (736) vigilance 1st layer 2 nd layer searching strategy correct /incorrect accuracy (%) speed (ms) All 723/13 98.23 4.40 Rank 723/13 98.23 4.51 100 116 192 MinMax 723/13 98.23 3.11 All 722/14 98.10 4.50 Rank 722/14 98.10 2.99 105 50 196 MinMax 722/14 98.10 2.01 All 726/10 98.64 4.65 Rank 726/10 98.64 3.37 110 38 206 MinMax 726/10 98.64 2.12 All 727/9 98.77 4.53 Rank 727/9 98.77 3.01 115 30 119 MinMax 727/10 98.64 2.09
Table 2. Comparison of F-LVQ pattern classification model performance
test data (736) learning
method
reference
clusters /incorrect correct accuracy(%)
speed (ms) 100 706/30 95.92 2.36 150 712/24 96.74 3.15 200 712/24 96.74 4.28 LVQ1 250 722/14 98.10 5.22 100 717/19 97.42 2.13 150 726/10 98.64 3.41 200 723/13 98.23 4.17 LVQ2 250 725/11 98.51 5.17 100 717/19 97.42 2.22 150 725/11 98.51 3.39 200 725/11 98.51 4.23 LVQ3 250 725/11 98.51 5.31 100 709/27 96.33 2.27 150 728/8 98.91 3.38 200 728/8 98.91 4.45 F-LVQ 250 725/11 98.51 5.44 F-LVQ optimized by fuzzy membership function achieves near 99% of accuracy and stable performance. But we can see that the additional time is required for the calculation of fuzzy membership degree.
4.2. Performance Comparison with other pattern Classification Models
Table 3 shows the pattern classification performance comparison of the proposed method with K-means clustering, Hierarchical clustering, and SVM with various conditions.
Table 3. Comparison of pattern classification performance with others
method conditions accuracy(%) speed(ms)
Kmeans-1 #C=100 95.92 2.37 Kmeans-2 #C=150 97.15 3.52 Kmeans-3 #C=200 97.28 4.44 Kmeans-4 #C=250 97.83 5.51 #C=100 92.39 2.30 #C=150 94.57 3.39 #C=200 95.52 4.45 Hierarchical Clustering #C=250 97.15 5.48 SVM-r1 RBF, C=300 → SV=655 98.78 28.07 SVM-r2 RBF, C=500 → SV=655 98.78 28.25 SVM-r3 RBF, C=700 → SV=655 98.78 28.17 SVM-s1 Sigmoid, C=300 → SV=624 98.64 19.67 SVM-s2 Sigmoid, C=500 → SV=624 98.64 18.95 SVM-s3 Sigmoid, C=700 → SV=624 98.64 18.94 SVM-p1 Polynomial, C=300 → SV=772 98.91 22.36 SVM-p2 Polynomial, C=500 → SV=745 98.91 21.70 SVM-p3 Polynomial, C=700→ SV=733 98.91 21.62 HART-1 ρ=100 → #C1=116, #C2=192 98.23 3.11 HART-2 ρ=105 → #C1=50, #C2=196 98.10 2.01 HART-3 ρ=110 → #C1=38, #C2=206 98.64 2.12 HART-4 ρ=115 → #C1=30, #C2=199 98.64 2.09 FLVQ-1 #C=100 96.33 2.27 FLVQ-2 #C=150 98.91 3.38 FLVQ-3 #C=200 98.91 4.45 FLVQ-4 #C=250 98.51 5.44
For the fairness of comparison, we make the number of reference clusters of K-means clustering to be equal to that of Hierarchical clustering. Three kinds of kernel functions, RBF, sigmoid, and polynomial, are applied to SVM. As the value of variable C of SVM is from 300 to 700, 600 – 700 SVs(Support Vector) are generated. It shows variable C has little effect on SV.
The proposed H-ART2 and F-LVQ model show better recognition rate and speed than K-means and Hierarchical clustering algorithm. Although SVM model is very stable without the influence of parameter and shows a good recognition rate, it is difficult to control the number of SV. Therefore recognition speed becomes slow because a lot of SV are generated.
4.3. Hybrid Classifier
Each classification model creates its own hyperplane according to its characteristics. These classification abilities can be combined for better performance.
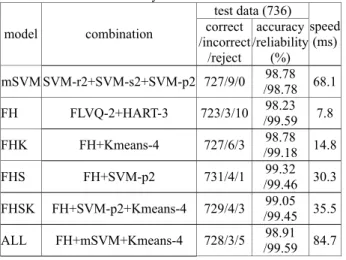
We composed several multiple classifier presented in this paper as Table 4. We simply used the majority voting scheme to combine the results from each classifier. If the same number of majority exists, we reject the decision for better reliability. As shown in Table 4, the hybrid classifiers which are combined by the proposed models show the considerable performance improvement in accuracy, reliability and speed.
Table 4. Performance of Hybrid Classifiers
test data (736) model combination correct /incorrect
/reject accuracy /reliability (%) speed (ms) mSVM SVM-r2+SVM-s2+SVM-p2 727/9/0 /98.7898.78 68.1 FH FLVQ-2+HART-3 723/3/10 /99.5998.23 7.8 FHK FH+Kmeans-4 727/6/3 /99.1898.78 14.8 FHS FH+SVM-p2 731/4/1 /99.4699.32 30.3 FHSK FH+SVM-p2+Kmeans-4 729/4/3 /99.4599.05 35.5 ALL FH+mSVM+Kmeans-4 728/3/5 /99.5998.91 84.7
5. CONCLUSION
In this paper, we have designed the efficient classification model for face recognition which is one of the biometric techniques. First, a RGB image inputted from a frame grabber is converted into a HSV image which is similar to the human beings' vision system. Then, the coarse facial region is extracted using the hue(H) and saturation(S) components except intensity(V) component which is sensitive to the environmental illumination. Next, the fine facial region extraction process is performed by matching with the edge and gray based templates. To make a light-invariant and qualified facial image, histogram equalization and intensity compensation processing using illumination plane are performed. The finally extracted and enhanced facial images are used for training the pattern classification models.
The proposed H-ART2 pattern classification model which has the hierarchical ART2 layers makes it possible to search
clustered reference patterns effectively and F-LVQ model which optimizes relations of clusters by fuzzy membership function shows a stable classification performance.
Facial data are acquired from 10 male and female peoples at various distances and angles. Experimental results show that the proposed face recognition system is as good as the SVM model which is famous for face recognition field in recognition rate and even better in classification speed. Moreover, hybrid neural classifiers combined with the proposed classification models present satisfactory results.
REFERENCES
[1] Haizhou Ai, Luhong Liang, Guangyou Xu, “Face detection based on template matching and support vector machines”, Proceedings of Image Processing,
Vol.1, pp.1006-1009, 2001
[2] R. Baldock and J. Graham, Image Processing And
Analysis, Oxford University Press, 2000.
[3] P. N. Belhumeur, J. P. Hespanha, D. J. Kriegman, “Eigenfaces vs. Fisherfaces: recognition using class specific linear projection”, IEEE Transactions on Pattern Analysis and Machine Intelligence, Vol.19, No.7,
pp.711-720, 1997
[4] G. A. Carpenter, S. Grossberg, “ART2: Self-Organization of Stable Category Recognition Codes for Analog Input patterns”, Applied Optics, Vol. 26, No. 23, pp.4919-4930, 1987
[5] G. A. Carpenter and S. Grossberg, “The ART of Adaptive Pattern Recognition by a Self-Organizing Neural Network”, IEEE Computer, Vol. 21, No.3, pp.77-88, 1988
[6] L. Fausett, Fundamentals of Neural Networks, Prentice
Hall, 1994.
[7] W. Gonzalez, Digital Image Processing, Addison Wesley, 1992.
[8] S. Haykin, Neural Networks - A Comprehensive
Foundation, Prentice Hall, 1999.
[9] B. Heisele, P. Ho, T. Poggio, “Face recognition with support vector machines: global versus component-based approach”, 8th IEEE International
Conference on Computer Vision, Vol.2, pp.688-694,
2001
[10] R. Jain, R. Kasturi, and B. G. Schunck, Machine Vision, McGraw-Hill, 1995
[11] T. Kohonen, “The Self-Organizing Map”, Proceeding of
the IEEE, Vol.78, No.9, pp.1464-1480, 1990
[12] S. Romdhani, “Face Recognition using Principal Component Analysis”, The MS Thesis, University of Glasgow(UK), 1-56, April, 1997.
[13] H. A. Rowley, S. Baluja, and T. Kanade, “Rotation Invariant Neural Network-Based Face Detection”,
Proceedings of Computer Vision and Pattern Recognition, pp.38-44, 1993
[14] A. Sanker and R. J. Mammone, “Neural Tree Networks”, in Neural Networks: Theory and Applications, Academic Press, 1991.
[15] A. Sanker and R. J. Mammone, “Growing and pruning neural tree networks”, IEEE transaction Computers, Vol. 42, pp.291-299, 1993
[16] Sergios Theodoridis, Konstantinos Koutroumbas,
Pattern Recognition, Academic Press, 1999.
[17] Nikhil R. Pal, James C. Bezdek, “Generalized Clustering Networks and Kohonen's Self-Organizing Scheme”, IEEE Transaction on Neural Networks, Vol.4, No.4, pp.549-557, July 1993
[18] J. W. Kim, “The Robot Arm Control by EMG Pattern Recognition”, Proceedings of The ICASE Conference, pp.81, 2002