ABSTR A C T
Original Research
Received October 3, 2020 Revision November 23, 2020 Accepted December 22, 2020Corresponding author: Reo Etani Laboratory of Environmental Health Science, Oita University of Nursing and Health Sciences, 2944-9 Megusuno, Oita City, Oita 870-1201, Japan
E-mail: [email protected]
https://orcid.org/0000-0001-8025-7161
This is an open-access article distributed under the terms of the Creative Commons Attribution License (http://creativecommons.org/licenses/by-nc/4.0), which permits unrestricted use, distribution, and reproduction in any medium, provided the original work is properly cited.
Copyright © 2021 The Korean Association for Radiation Protection
Estimating Organ Doses from Pediatric Cerebral
Computed Tomography Using the WAZA-ARI
Web-Based Calculator
Reo Etani1, Takayasu Yoshitake2, Michiaki Kai1
1Laboratory of Environmental Health Science, Oita University of Nursing and Health Sciences, Oita, Japan; 2Doctoral Course of Health Science, Graduate School of Nursing, Oita University of Nursing and Health Sciences, Oita, Japan
Background: The use of computed tomography (CT) device has increased in the past few de-cades in Japan. Dose optimization is strongly required in pediatric CT examinations, since there is concern that an unreasonably excessive medical radiation exposure might increase the risk of brain cancer and leukemia. To accelerate the process of dose optimization, continual as-sessment of the dose levels in actual hospitals and medical facilities is necessary. This study pres-ents organ dose estimation using pediatric cerebral CT scans in the Kyushu region, Japan in 2012 and the web-based calculator, WAZA-ARI (https://waza-ari.nirs.qst.go.jp).
Materials and Methods: We collected actual patient information and CT scan parameters from hospitals and medical facilities with more than 200 beds that perform pediatric CT in the Kyushu region, Japan through a questionnaire survey. To estimate the actual organ dose (brain dose, bone marrow dose, thyroid dose, lens dose), we divided the pediatric population into five age groups (0, 1, 5, 10, 15) based on body size, and inputted CT scan parameters into WA-ZA-ARI.
Results and Discussion: Organ doses for each age group were obtained using WAZA-ARI. The brain dose, thyroid dose, and lens dose were the highest in the Age 0 group among the age groups, and the bone marrow and thyroid doses tended to decrease with increasing age groups. All organ doses showed differences among facilities, and this tendency was remarkable in the young group, especially in the Age 0 group. This study confirmed a difference of more than 10-fold in organ doses depending on the facility and CT scan parameters, even when the same CT device was used in the same age group.
Conclusion: This study indicated that organ doses varied widely by age group, and also sug-gested that CT scan parameters are not optimized for children in some hospitals and medical fa-cilities.
Keywords: CT Examinations, Radiation Exposure, Pediatric Cerebral CT, WAZA-ARI
Introduction
The radiation doses of patients undergoing computed tomography (CT) examina-tions are significantly higher than those of patients undergoing conventional radiodi-agnosis [1]. In general, children have a higher risk of radiation-induced cancer than adults [1]. Repeated CT scans increase the risk of childhood leukemia or brain tumors [2–6]. Therefore, discussion on dose optimization in pediatric CT examinations has
curred to minimize the radiation dose of children undergo-ing CT examinations [7–9]. In pediatric CT examinations, however, proper selection of a size- or age-appropriate scan protocol for children of various body sizes is difficult, and ex-cessive doses to children may result, even if using the same device [10, 11]. To accelerate the process of dose optimiza-tion, continual assessment of the dose levels in actual hospi-tals and medical facilities is necessary. Therefore, the present study estimated the pediatric doses to several major organs (brain dose, bone marrow dose, thyroid dose and lens dose) from pediatric cerebral CT using a free web-based CT dose calculator, WAZA-ARI (https://waza-ari.nirs.qst.go.jp/). CT scan parameters were acquired from hospitals and medical facilities in the Kyushu region, Japan in 2012. Finally, size-specific dose variance was analyzed among age groups.
Materials and Methods
1. Survey Method
A questionnaire survey was conducted during 2 weeks in 2012. The sample was drawn from hospitals and medical fa-cilities with more 200 beds that perform pediatric CT in the Kyushu region, Japan.
We requested the following information with several ques-tions. The patient information and the clinical settings of the CT scan for individual patients were acquired for each CT procedure at each facility. Acquisition and analysis of data were treated in an anonymous way following ethical proce-dures.
(1) Patient information: patient age, sex, height, weight, and body mass index;
(2) CT information: CT scanner manufacturer and CT scanner model;
(3) CT scanning parameters: scan type, mean CT dose in-dex (CTDIvol), dose length product (DLP), and scan
length.
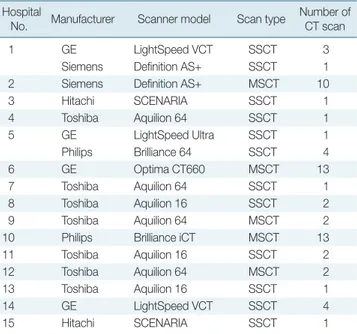
In this study, 27 of 55 facilities that we contacted respond-ed and completrespond-ed the questionnaire. Furthermore, data from 15 of 27 facilities that performed a total of 62 cerebral CT procedures for pediatric patients under 15 years old were available for dose estimation. The CT scanners and number of CT scans performed at each facility involved in the survey are presented in Table 1. Table 2 shows the comparison of average body sizes for each age group between acquired data and the phantoms of WAZA-ARI.
2. Dose Estimates
WAZA-ARI provides web-based calculation of CTDIvol,
DLP, tissue doses, and effective doses by specifying the CT scanner manufacturer, CT scanner model, phantom size,
Table 1. Characteristics of the CT Used in Various Hospitals and
Medical Facilities Hospital
No. Manufacturer Scanner model Scan type
Number of CT scan
1 GE LightSpeed VCT SSCT 3
Siemens Definition AS+ SSCT 1
2 Siemens Definition AS+ MSCT 10
3 Hitachi SCENARIA SSCT 1 4 Toshiba Aquilion 64 SSCT 1 5 GE LightSpeed Ultra SSCT 1 Philips Brilliance 64 SSCT 4 6 GE Optima CT660 MSCT 13 7 Toshiba Aquilion 64 SSCT 1 8 Toshiba Aquilion 16 SSCT 2 9 Toshiba Aquilion 64 MSCT 2
10 Philips Brilliance iCT MSCT 13
11 Toshiba Aquilion 16 SSCT 2
12 Toshiba Aquilion 64 MSCT 2
13 Toshiba Aquilion 16 SSCT 1
14 GE LightSpeed VCT SSCT 4
15 Hitachi SCENARIA SSCT 1
CT, computed tomography; SSCT single-slice CT; MSCT, multi-slice CT.
Table 2. Pediatric Body Size in Each Age Group
Age group WAZA-ARI
a) Acquired data
Height (cm) Body weight (kg) BMI (kg/m2) Height (cm) Body weight (kg) BMI (kg/m2)
0 (n= 12) 47.5 3.5 15.5 48.3 3.82 17.2
1 (n= 11) 76.4 10.2 17.2 77.7 8.65 14.4
5 (n= 16) 110.2 19.7 16.2 100.3 14.9 14.7
10 (n= 16) 139.8 34.3 17.6 133 33.3 18.5
15 (n= 7) 165.7/161.1b) 59.9/56.6b) 21.8/21.8b) 161.8 51.7 19.7
BMI, body mass index.
a)Pediatric body size assumed by each phantom registered in WAZA-ARI (https://waza-ari.nirs.qst.go.jp). b)Data separately for male/female.
and scanning techniques (filter, tube potential, rotation time, pitch factor, beam width, scan type, scan range, tube current, etc.) as input [12–15]. Based on the acquired child's body size, the pediatric population was separated into five age groups (Age 0, Age 1, Age 5, Age 10, and Age 15) to select the voxel phantom sizes for calculating the pediatric doses using WAZA-ARI. Then, the organ (brain, bone marrow, thyroid, and lens) doses around the head was estimated for each age group by inputting CT scan parameters obtained from the questionnaire survey into WAZA-ARI. The questionnaire survey did not provide input scanning parameters for more detailed calculations such as tube voltage, tube current, and scan range (i.e., slice width, scan start position, scan end po-sition, and field of view). Therefore, in this study, the tube voltage was unified to 120 kV, which is commonly used in pediatric cerebral CT scan [16], and the tube current was ad-justed and inputted to match the acquired CTDIvol from the
questionnaire survey. In addition, the scan width conformed to the standard scan range, from the top of the head to the lower edge of the orbit, as registered in each age phantom size in WAZA-ARI. The actual scan range may be wider than standard scan range, but it is unlikely to be narrower. There-fore, the fact that the actual scan range was unknown had a very small effect on the organ dose estimation within the scan range to brain, bone marrow, and lens. Moreover, it was also unlikely that the thyroid dose was overestimated for the thyroid glands that are outside the scan range. In this way, the estimation is based on the general conditions of pediatric cerebral CT scan. Finally, male and female children were
combined in the analysis, because we found no significant difference by sex when estimating organ doses around the head.
3. Statistical Analyses
We examined significant differences with the Student t-test for two specific groups, and the relationship among CTDIvol,
DLP value, and organ doses and age in each age group with linear regression analysis. All statistical analyses were con-ducted using the statistical language R (http://www.r-proj-ect.org).
Results and Discussion
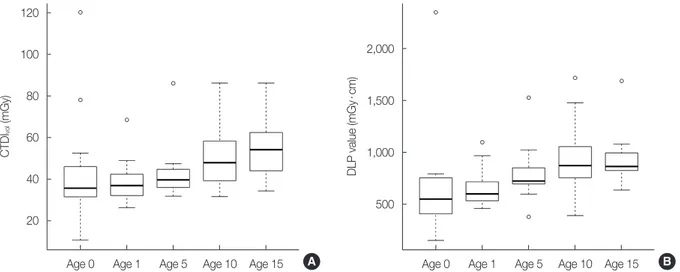
The CTDIvol and DLP values for each age group from the
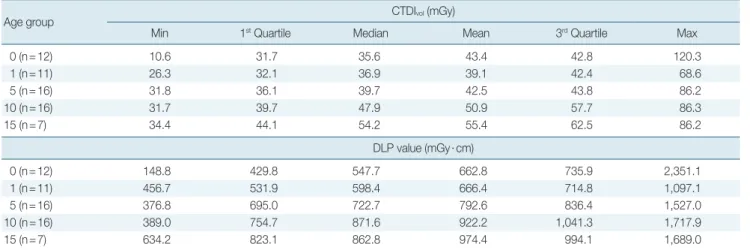
acquired data are shown in Fig. 1 and Table 3. Table 4 and Fig. 2 show the estimated organ doses for each age group.
From the acquired data, the CTDIvol and DLP values for
each age group increased with increasing age groups. We identified a weakly positive correlation between the CTDIvol
and age (r=0.30, p<0.05), and between the DLP value and age (r=0.33, p<0.01). This reflects changes in irradiation pa-rameters with increasing pediatric body size.
Regarding the estimated dose to organs, the brain dose, thyroid dose, and lens dose were highest in Age 0 among the age groups, but this was not significantly different compared to other age groups. The brain doses and lens doses showed no significant difference among age groups, but seemed to vary among facilities in Age 0. In contrast, the bone marrow
Fig. 1. Box plots showing (A) computed tomography dose index (CTDIvol) and (B) dose length product (DLP) value for each age group from
the acquired data. Box plot midlines indicate medians, outer lines indicate 25th and 75th percentiles respectively, and whiskers indicate the
range of data points excluding outliers represented by blank circle.
CTDI vol (mGy) 120 100 80 60 40 20
Age 0 Age 1 Age 5 Age 10 Age 15 A
DLP value (mGy ∙cm) 2,000 1,500 1,000 500
doses and thyroid doses tended to decrease with increasing age group. The bone marrow doses and thyroid doses was were strongly related to age (bone marrow: r=−0.51, p<0.01; thyroid: r=−0.51, p<0.01). The organ doses of the brain and lens that exist within the CT scan range were well correlated with CTDIvol. These results indicated that the growth of
chil-dren led to a shielding effect on the doses to the brain and lens due to an increase in the skull thickness. The bone mar-row doses were much lower in both Age 10 and Age 15 than in other age groups. Because bone marrow is abundant in
the pediatric skull, we consider that the effect was larger in the younger age groups who had a higher proportion of bone marrow in the CT scan range. The thyroid dose was highest in Age 0, and the dose markedly decreased over Age 1. The dose to the thyroid gland, which is an organ outside the CT scan range, decreased because the physical distance from the edge of the scan range to the thyroid increased with the increasing age group. The effects of increasing CTDIvol with
age were relatively low and canceled out. The thyroid doses vs. distance from the edge of the scan range for each
phan-Table 3. CTDIvol and DLP Value for Each Age Group
Age group CTDIvol (mGy)
Min 1st Quartile Median Mean 3rd Quartile Max
0 (n= 12) 10.6 31.7 35.6 43.4 42.8 120.3 1 (n= 11) 26.3 32.1 36.9 39.1 42.4 68.6 5 (n= 16) 31.8 36.1 39.7 42.5 43.8 86.2 10 (n= 16) 31.7 39.7 47.9 50.9 57.7 86.3 15 (n= 7) 34.4 44.1 54.2 55.4 62.5 86.2 DLP value (mGy∙ cm) 0 (n= 12) 148.8 429.8 547.7 662.8 735.9 2,351.1 1 (n= 11) 456.7 531.9 598.4 666.4 714.8 1,097.1 5 (n= 16) 376.8 695.0 722.7 792.6 836.4 1,527.0 10 (n= 16) 389.0 754.7 871.6 922.2 1,041.3 1,717.9 15 (n= 7) 634.2 823.1 862.8 974.4 994.1 1,689.0
CTDIvol, computed tomography dose index; DLP, dose length product.
Table 4. Estimated Organ Doses for Each Age Group
Organ Age group Organ dose (mGy)
Min 1st Quartile Median Mean 3rd Quartile Max
Brain 0 (n= 12) 11.4 40.3 44.9 54.9 51.4 159.8 1 (n= 11) 26.5 33.4 36.6 43.4 42.8 97.1 5 (n= 16) 25.4 32.2 35.4 37.1 37.2 75.3 10 (n= 16) 26.6 34.2 40.5 42.9 48.5 72.5 15 (n= 7) 22.1 35.5 40.3 43.1 51.1 66.2 Bone marrow 0 (n= 12) 2.9 10.3 11.4 14.0 13.1 40.6 1 (n= 11) 8.8 10.7 11.8 13.7 13.9 28.1 5 (n= 16) 7.5 9.3 10.3 10.9 11.0 22.0 10 (n= 16) 4.1 5.4 6.4 6.7 7.6 11.3 15 (n= 7) 2.3 3.4 4.2 4.2 4.9 6.8 Thyroid 0 (n= 12) 0.8 3.1 3.5 4.2 4.0 11.8 1 (n= 11) 1.2 1.4 1.6 1.7 1.9 2.9 5 (n= 16) 0.8 1.0 1.1 1.1 1.2 2.4 10 (n= 16) 0.6 0.8 1.0 1.0 1.2 1.7 15 (n= 7) 0.2 0.4 0.4 0.4 0.5 0.6 Lens 0 (n= 12) 10.9 37.9 42.4 52.0 48.6 152.0 1 (n= 11) 26.6 31.8 34.9 42.6 42.3 102.0 5 (n= 16) 27.1 36.7 42.2 45.0 50.9 73.9 10 (n= 16) 28.3 41.2 49.3 51.6 61.7 77.7 15 (n= 7) 28.1 33.7 37.8 39.3 39.1 77.6
tom size are shown in Table 5. The imaging conditions were constant with a CTDIvol of 45 mGy. The effects of increasing
CTDIvol with age were so relatively low that they canceled
out. The distance from the lower end of the scan range to the thyroid was calculated by taking the difference between the lower end of the scanning range under the head scan
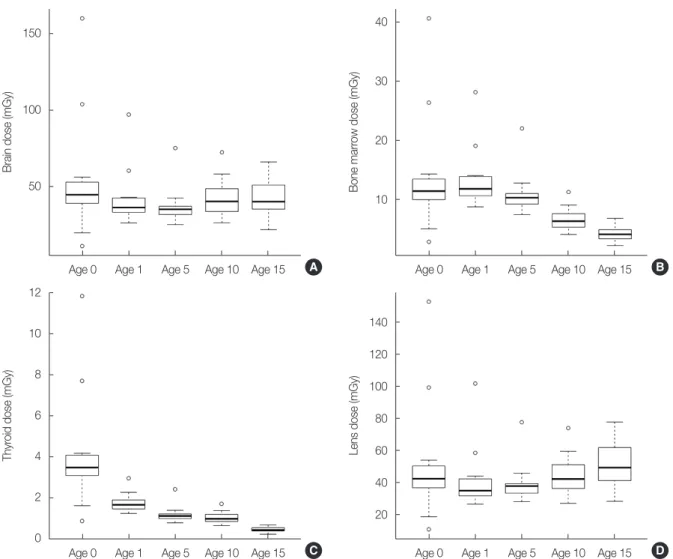
condi-Fig. 2. Box plots showing (A) brain dose, (B) bone marrow dose, (C) thyroid dose, and (D) lens dose for each age group estimated with
WA-ZA-ARI (https://waza-ari.nirs.qst.go.jp). Box plot midlines indicate medians, outer lines indicate 25th and 75th percentiles respectively, and
whiskers indicate the range of data points excluding outliers represented by blank circle.
Brain dose (mGy)
150
100
50
Age 0 Age 1 Age 5 Age 10 Age 15 A
Thyr
oid dose (mGy)
12 10 8 6 4 2 0
Age 0 Age 1 Age 5 Age 10 Age 15 C
Lens dose (mGy)
140 120 100 80 60 40 20
Age 0 Age 1 Age 5 Age 10 Age 15 D
Bone marr ow dose (mGy) 40 30 20 10
Age 0 Age 1 Age 5 Age 10 Age 15 B
tion and the upper end of the scan range under the chest scan condition. The upper end of the scan range of the chest condition and that of the thyroid fit closely. Moreover, varia-tions in the organ doses were observed within the same age group. This tendency was greatest in Age 0 in particular, probably because an adult scan protocol was applied to some children without automatic selection of scan parame-ters for pediatric patients.
The thyroid is a highly radiosensitive organ in childhood exposure, and pediatric head and neck CT scans may in-crease the dose of thyroid. Previous study also suggested the use of appropriate scanning ranges and parameters is direct-ly linked to reducing unnecessary thyroid dose [17]. We con-firmed that organ doses were more than 10 times different depending on the facility, even when the same CT device was used in the same age group. This suggests that the scan
Table 5. Sample Estimation of the Thyroid Dose Depending on the
Selected Phantom Size Age group CTDIvol
(mGy) Thyroid dose (mGy) Distance from scan range edge to thyroid (mm)
0 (n= 12) 45.0 3.56 20
1 (n= 11) 45.0 1.56 50
5 (n= 16) 45.0 0.94 65
10 (n= 16) 45.0 0.71 90
15 (n= 7) 45.0 0.24 110
parameters may not be properly selected depending on the pediatric patient’s body size. However, whether these varia-tions reflected the actual purpose of the CT examination or the patient’s clinical indication remains unclear. Moreover, we note that our dose estimation has a several limitations. The organ dose results still contain uncertainties due to a se-lection of parameter. When performing dose estimation with WAZA-ARI, we selected the phantom based on the body size to be a better match, but we did not use a definite index such as head size or actual scan range, because collecting this in-formation from our questionnaire survey was difficult. De-pending on some assumptions required for calculation, the results actually include overvalued equipment and under-valued data. Therefore, estimation of organ doses was differ-ent depending on which phantom was applied, a younger (smaller) phantom or an older (bigger) one. Even if the same CTDIvol is assumed in the same conditions, phantom
selec-tion overestimated or underestimated the brain dose and lens dose by approximately 20%. In contrast, a larger error of 40% at most was present between Age 5 and Age 10 in bone marrow, and 60% at most for the thyroid dose. Typically, or-gan doses, especially the brain, lens, and thyroid gland may provide overestimation when a younger phantom is selected. The accuracy will depend on how much the selected phan-tom looks like the anaphan-tomy of the actual patient. In terms of radiological protection at low doses, it would be better to se-lect a phantom that overestimates the dose. Nevertheless, if more accurate organ dose to a patient is required in case higher doses happen, it is appropriate to use a linear inter-polation based on the estimation results using couple of phantoms [18]. It will be worthy to note the latest pediatric reference computational phantoms developed [19]. The ICRP Publication 143 defines as series of 10 computational phantoms representing reference male and female at birth (newborn), 1 year, 5 years, 10 years, and 15 years of age.
The Japan Network for Research and Information on Med-ical Exposures (J-RIME), which is an association involved in medical exposure and radiological protection, published its first diagnostic reference levels in 2015 (DRLs 2015) and have recently updated the DRLs (DRLs 2020) based on the latest domestic fact-finding results [20]. According to DRLs 2020, the CTDIvol for pediatric cerebral CT is 30 mGy for patients
under 1 year old, 40 mGy for those between 1 and 5 years old, 55 mGy for those between 5 and 10 years old, and 60 mGy for patients between 10 and 15 years old. Following the publication of DRLs 2015, Japanese hospitals and medical
facilities are now reviewing CT scan parameters to optimize radiation protection. In a survey conducted for members of the Japanese Society of Radiological Technology in 2017, 2 years after the release of DRLs 2015, more than 60% of the respondents answered that they had already considered or plan to consider the optimization of pediatric CT scan pa-rameters in their medical facility [21]. This may be regarded as a result of DRLs 2015 release. Therefore, we believe that some of the excess doses revealed in this study have been re-viewed. Investigating the impact of the publication of DRLs with a longitudinal study is necessary [22].
Conclusion
In this study, we estimated the organ doses in children who underwent cerebral CT at the hospitals and medical fa-cilities in Kyushu region, Japan in 2012. The brain dose, thy-roid dose, and lens dose were the highest in Age 0 among the age groups. This study showed that organ doses varied widely by age group, and also suggested that CT scan parameters were not optimized for children by hospitals and medical fa-cilities.
Conflict of Interest
No potential conflict of interest relevant to this article was reported.
Author Contribution
Data curation: Etani R, Yoshitake T. Formal analysis: Etani R, Yoshitake T, Kai M. Methodology: Yoshitake T. Writing - original draft: Etani R. Writing - review & editing: Yoshitake T, Kai M. Investigation: Yoshitake T.
References
1. Brenner DJ, Hall EJ. Computed tomography: an increasing source of radiation exposure. N Engl J Med. 2007;357:2277–2284. 2. Pearce MS, Salotti JA, Little MP, McHugh K, Lee C, Kim KP, et al.
Radiation exposure from CT scans in childhood and subsequent risk of leukaemia and brain tumours: a retrospective cohort study. Lancet. 2012;380:499–505.
3. Nikkila A, Raitanen J, Lohi O, Auvinen A. Radiation exposure from computerized tomography and risk of childhood leukemia: Finn-ish register-based case-control study of childhood leukemia (FRECCLE). Haematologica. 2018;103:1873–1880.
4. Nikkila A, Raitanen J, Lohi O, Auvinen A. Radiation exposure from computerized tomography and risk of childhood leukemia: Finnish register-based case-control study of childhood leukemia (FRECCLE). Haematologica. 2020;105:849–850.
5. Meulepas JM, Ronckers CM, Smets AM, Nievelstein RA, Grad-owska P, Lee C, et al. Radiation exposure from pediatric CT scans and subsequent cancer risk in the Netherlands. J Natl Cancer Inst. 2019;111:256–263.
6. Huang R, Liu X, He L, Zhou PK. Radiation exposure associated with computed tomography in childhood and the subsequent risk of cancer: a meta-analysis of cohort studies. Dose Response. 2020;18:1559325820923828.
7. Lee C, Pearce MS, Salotti JA, Harbron RW, Little MP, McHugh K, et al. Reduction in radiation doses from paediatric CT scans in Great Britain. Br J Radiol. 2016;89:20150305.
8. Pace E, Borg M. Optimisation of a paediatric CT brain protocol: a figure-of-merit approach. Radiat Prot Dosimetry. 2018;182: 394–404.
9. Strauss KJ, Somasundaram E, Sengupta D, Marin JR, Brady SL. Radiation dose for pediatric CT: comparison of pediatric versus adult imaging facilities. Radiology. 2019;291:158–167.
10. Smith-Bindman R, Wang Y, Chu P, Chung R, Einstein AJ, Bal-combe J, et al. International variation in radiation dose for com-puted tomography examinations: prospective cohort study. BMJ. 2019;364:k4931.
11. Muhogora WE, Ahmed NA, Alsuwaidi JS, Beganovic A, Ciraj-Bjelac O, Gershan V, et al. Paediatric CT examinations in 19 de-veloping countries: frequency and radiation dose. Radiat Prot Dosimetry. 2010;140:49–58.
12. Takahashi F, Sato K, Endo A, Ono K, Yoshitake T, Hasegawa T, et al. WAZA-ARI: computational dosimetry system for X-ray CT examinations. I: Radiation transport calculation for organ and tissue doses evaluation using JM phantom. Radiat Prot Dosime-try. 2011;146:241–243.
13. Ban N, Takahashi F, Ono K, Hasegawa T, Yoshitake T, Katsunuma Y, et al. WAZA-ARI: computational dosimetry system for X-ray
CT examinations. II: Development of web-based system. Radiat Prot Dosimetry. 2011;146:244–247.
14. Ban N, Takahashi F, Sato K, Endo A, Ono K, Hasegawa T, et al. Development of a web-based CT dose calculator: WAZA-ARI. Radiat Prot Dosimetry. 2011;147:333–337.
15. Koba Y. Summary of the dose assessment tool for diagnostic X-ray CT, WAZA-ARIv2. Hoshasen Seibutsu Kenkyu. 2016;51:141– 154.
16. The Radiation Imaging Section of the Japanese Society of Radio-logical Technology. Standardization in X-Ray CT imaging: GA-LACTIC. 2nd ed. Tokyo, Japan: Ohmsha; 2019.
17. Mazonakis M, Tzedakis A, Damilakis J, Gourtsoyiannis N. Thy-roid dose from common head and neck CT examinations in children: is there an excess risk for thyroid cancer induction? Eur Radiol. 2007;17:1352–1357.
18. Kamei O, Ojima M, Yoshitake T, Ono K, Nishijima K, Kai M. Cal-culating patient-specific organ doses from adult body CT scans by Monte Carlo analysis using male-individual voxel phantoms. Health Phys. 2015;108:44–52.
19. Bolch WE, Eckerman K, Endo A, Hunt JG, Jokisch DW, Kim CH, et al. ICRP Publication 143: Paediatric reference computational phantoms. Ann ICRP. 2020;49:5–297.
20. Japan Network for Research and Information on Medical Expo-sures. National diagnostic reference levels in Japan [Internet]. Kyoto, Japan: Japanese Society of Radiological Technology; 2020 [cited 2021 Feb 1]. Available from: http://www.radher.jp/J-RIME/ report/DRL2020_Engver.pdf.
21. Matsubara K, Matsunaga Y, Yanagawa N, Muramatsu Y, Ida Y, Suzuki S, et al. [Survey of recognition, utilization, and evaluation for diagnostic reference levels in the field of X-ray computed to-mography]. Nihon Hoshasen Gijutsu Gakkai Zasshi. 2018;74: 700–707.
22. Ideguchi R, Yoshida K, Ohtsuru A, Takamura N, Tsuchida T, Kimura H, et al. The present state of radiation exposure from pediatric CT examinations in Japan-what do we have to do? J Radiat Res. 2018;59(suppl_2):ii130–ii136.