Proteomic Analysis of Protein Phosphorylations in Heat Shock
Response and Thermotolerance*
Received for publication, January 30, 2002 Published, JBC Papers in Press, March 8, 2002, DOI 10.1074/jbc.M201007200
Hee-Jung Kim‡, Eun Joo Song‡, and Kong-Joo Lee§
From the Center for Cell Signaling Research, Division of Molecular Life Sciences and College of Pharmacy, Ewha Womans University, Seoul 120-750, Korea
Heat shock (HS) induces a wide variety of biological processes, including inhibition of protein synthesis, ele-vated expression of heat shock proteins, induction of thermotolerance, and apoptotic cell death in a dose-de-pendent manner. We compared phosphorylated proteins in heat-shocked and thermotolerant cells using proteome analysis. After HS treatment of control RIF-1 and their thermotolerant derivatives, TR-RIF-1 cells, cellular pro-teins were separated by two-dimensional gel electro-phoresis and the phosphorylated proteins were detected with the anti-phosphotyrosine antibodies. We found that 93 proteins showed significant changes in phosphoryla-tion between control and thermotolerant cells as a func-tion of recovery time after HS; we identified 81 of these proteins with peptide mass fingerprinting using MALDI-TOF MS after in-gel trypsin digestion. These phosphoryl-ated proteins exhibit various cellular functions, including chaperones, ion channels, signaling molecules, in tran-scription and translation processes, in amino acid biosyn-thesis, oxidoreduction, energy metabolism, and cell motil-ity or structure, suggesting that HS turns on the various signaling pathways by activating protein-tyrosine ki-nases (PTKs). Of these, 20 proteins were previously iden-tified phosphorylated proteins and 64 were newly identi-fied. These proteins can be grouped into three families: 1) proteins highly phosphorylated in TR-RIF-1 cells at basal level and phosphorylated more significantly by HS in RIF-1 than TR-RIF-1; 2) proteins highly phosphorylated in control RIF-1 cells at basal level and phosphorylated more easily by HS in TR-RIF-1 than in RIF-1 cells; and 3) proteins with a similar basal phosphorylation level in both RIF-1 and TR-RIF-1 cells and responding to HS sim-ilarly in both cells. Most of the phosphorylated proteins are presumably involved in HS signaling in different ways, with the first and second families of proteins influ-encing thermotolerance. The possible tyrosine phospho-rylation sites, the possible PTKs phosphorylating these proteins, and the proteins binding to these phosphoryl-ated sites were predicted by the Netphos, ScanProsite, and Scansite programs. These results suggest that HS can activate various PTKs and HS responses can be regulated by phosphorylations of proteins having various functions.
Heat shock responses are well conserved phenomena through evolution. Modest elevations of temperature induce apoptotic cell death. A common feature of the heat shock re-sponse is that an initial, nonlethal heat shock provides a tran-sient resistance against subsequent lethal heat shock. This phenomenon is called thermotolerance. Thermotolerant cells induce the overexpression of a family of heat shock proteins (Hsps)1 and are thereby protected from cell death caused by various stresses. This suggests that the chaperonic function of Hsps is associated with the development of thermotolerance. However, the details of the molecular events underlying heat shock responses are not well defined.
Heat shock causes a dramatic reprogramming in cellular metabolism. Heat shock affects the cells at the level of the nucleic acids, the membrane, and the cytoskeleton. Heat shock induces a significant reduction in normal transcription and translation processes. The next event in the heat shock re-sponse pathway is the activation of heat shock transcription factor (HSF). Activated HSF binds to the heat shock element and induces the synthesis of Hsps (1– 4). The production of Hsps induces a transient thermotolerance.
Heat shock has been shown previously to alter the phospho-rylation of some cellular proteins in several different systems, including soybean seedlings (5) and mammalian cell lines (6). Heat shock elevates the level of protein phosphorylation in several cell lines (7). Recently, there has been increasing evi-dence that cellular stress responses are regulated by protein kinases. Heat shock activates a number of protein kinases, including p38/HOG1 kinase (8), Jun kinase (9), MAPK (10 –12), ribosomal S6 kinase (13), phosphatidylinositol 3-kinase, c-Src tyrosine kinase (14), MAP kinase activated protein kinase 1 (MAPKAP kinase 1) (15), and MAPKAP kinase 2 (16). How-ever, only a few of the substrates of these kinases have been identified. For example, RNA polymerase II (17, 18), histone H1 (19), Hsp (20), eukaryotic translation initiation factor 2 (21), and HSF (22–24) have been identified as substrates phos-phorylated by heat shock.
In this study, we examined the global phosphorylation changes after heat shock in a radiation-induced fibrosarcoma cell line, RIF-1, and its thermotolerant derivative, TR-RIF-1. Identifications of phosphorylated proteins induced by heat shock were performed by proteomics combined with two-dimen-sional gel electrophoresis, Western analysis using
anti-phos-* This work was supported in part by Korea Science and Engineering Foundation through the Center for Cell Signaling Research at Ewha Womans University, by Korea Institute of Science & Technology Eval-uation and Planning Research Fund for Women’s Universities, and by IMT2000 Project IMT2000-C5–2 for IT-BT. The costs of publication of this article were defrayed in part by the payment of page charges. This article must therefore be hereby marked “advertisement” in accordance with 18 U.S.C. Section 1734 solely to indicate this fact.
‡ Supported by the Brain Korea 21 Project. Both authors contributed equally to this work.
§ To whom correspondence should be addressed: Division of Molecu-lar Life Sciences and College of Pharmacy, Ewha Womans University, Seoul 120-750, Korea. Tel.: 82-2-3277-3038; Fax: 82-2-3277-3760; E-mail: kjl@mm.ewha.ac.kr.
1The abbreviations used are: Hsp, heat shock protein; HSF, heat
shock factor; PTK, protein-tyrosine kinase; RIF, radiation-induced fi-brosarcoma; GAPDH, glyceraldehyde-3-phosphate dehydrogenase; EGFR, epidermal growth factor receptor; MALDI-TOF MS, matrix-assisted laser desorption/ionization mass spectrometry; MAP, mitogen-activated protein; MAPK, MAP kinase; hnRNP, heterogeneous nuclear ribonucleoprotein. Throughout this manuscript, the term “protein phos-phorylation” is used in short for “protein tyrosine phosphos-phorylation” and “phosphorylation” for “tyrosine phosphorylation.”
© 2002 by The American Society for Biochemistry and Molecular Biology, Inc. Printed in U.S.A.
This paper is available on line at http://www.jbc.org
23193
at Ewha Medical Library on March 29, 2017
http://www.jbc.org/
photyrosine antibody, and mass spectrometry. Kinetic analysis of protein phosphorylation during recovery after heat shock allowed us to develop information on the relationship between phosphorylated proteins and their possible functions in heat shock response. We sorted the phosphorylated proteins identi-fied into three groups based on the kinetic analysis. Computer-assisted predictions of phosphorylation sites, the PTKs possibly involved, and the proteins that possibly bind to these phospho-rylated motifs have been performed to understand the large amount of information. This is a new trial to obtain compre-hensive understanding in the signaling pathways activated in response to heat shock.
EXPERIMENTAL PROCEDURES
Cell Culture and Heat Treatment—Radiation-induced fibrosarcoma
RIF-1 (25) and thermotolerant TR-RIF-1 cell lines derived from RIF-1 (gifts from Dr. G. M. Hahn) were cultured in RPMI 1640 containing 10% fetal bovine serum, 100g/ml streptomycin, and 100 units/ml penicillin G at 37 °C in an atmosphere of 5% CO2, 95% air. For the heat treatment
studies, monolayers of cells grown in tissue culture dishes were incu-bated at 45⫾ 0.1 °C in a water bath.
Profiling of Protein Synthesis by [35S]Methionine Pulse Labeling—
Patterns of cellular protein synthesis after heat shock were examined by pulse labeling with [35S]methionine (1Ci/ml) in methionine-free
RPMI 1640 media for 1 h. The labeled proteins were separated on SDS-PAGE gels, autoradiographed, and quantified by BAS2500 (Fuji photo film).
Immunoprecipitation—The cells were treated with or without heat
shock at 45 °C for 30 min and subsequently lysed in hypotonic buffer (10 mMHEPES, pH 7.9, 1.5 mMMgCl2, 10 mMKCl, 0.5 mMdithiothreitol,
1 mMphenylmethylsulfonyl fluoride, 5g/ml aprotinin, 1 g/ml
pep-statin A, 20 M/ml leupeptin, 5 mMNa3VO4, 5 mMNaF) to a final
volume of 3 times the original packed cell volume in ice. After centrif-ugation, the supernatant (cytosol fraction) was separated, and the pel-let was resuspended in half-packed cell volume of low salt buffer (20 mM
HEPES, pH 7.9, 25% glycerol, 1.5 mMMgCl2, 0.02MKCl, 0.2 mMEDTA,
0.5 mMdithiothreitol, 1 mM phenylmethylsulfonyl fluoride, 5g/ml
aprotinin, 1g/ml pepstatin A, 20 M/ml leupeptin, 5 mMNa3VO4, 5 mM
NaF). High salt buffer (same as low salt buffer except that 0.02MKCl
replaced with 1.2 MKCl) was added to one-half of the packed cells volume in dropwise, incubated in ice for 30 min, and centrifuged for 30 min at 14,500 rpm. The supernatant (nucleus fraction) was added to the cytosol fraction. The protein concentrations were measured by the Bradford assay. Equal amounts of proteins (700g) were added to an immunoprecipitation buffer containing 20 mMHEPES, pH 7.4, 15%
glycerol, 150 mMKCl, 0.5% Nonidet P-40, 1 mMEDTA, 1 mM phenyl-methylsulfonyl fluoride, 5 g/ml aprotinin, 1 g/ml pepstatin A, 20 M/ml leupeptin, 5 mMNa3VO4, 5 mMNaF. 5l of anti-phosphotyrosine
antibody was added and incubated at 4 °C for 3 h. 20l of protein A/G beads were then added and incubated for 1 h. The precipitated immune complexes were washed three times with the immunoprecipitation buffer. Proteins from control and heat-shocked cells were separated by SDS-PAGE under reducing conditions, transferred to NC membrane, and probed with polyclonal antibody of GAPDH (gift from Dr. K. S. Kwon) and monoclonal antibody to HSC70/HSP70 (StressGen). The immune complexes were detected with Amersham Biosciences ECL kit and LAS-1000S (Fuji photo film).
Two-dimensional Gel Electrophoresis and Immunoblot Analysis—
The protein samples were mixed for 30 min at room temperature with a buffer containing 9.5Murea, 2% Triton X-100, 5% -mercaptoeth-anol, 1 mM phenylmethylsulfonyl fluoride, 5 g/ml aprotinin, 10
g/ml pepstatin A, 10 g/ml leupeptin, 1 mMEDTA, 10 mMNa3VO4,
10 mMNaF and electrofocused in 7-cm Immobiline™ DryStrips (pH
4 –7, 6 –11) with the Amersham Biosciences IPGphor. The following focusing protocol was used: 50A per strip at 20 °C; 1) rehydration for 16 h; 2) 500 V for 1 h (step and hold); 3) 1000 V for 1 h (step and hold); and 4) 8000 V for 3 or 9 h (step and hold). After electrofocusing, the strips were shaken for 15 min with equilibration buffer (1.5 M
Tris-Cl, pH 8.8, 6Murea, 30% glycerol, 2% SDS, 10 mg/ml
dithio-threitol) and loaded onto Bio-Rad minigel two-dimensional SDS-PAGE. Proteins from SDS-PAGE were stained with Coomassie Blue or Silver or electroblotted onto a nitrocellulose membrane. The blot was incubated with anti-phosphotyrosine antibody (4G10) (Upstate Biotechnology, Inc.) at a 1:1000 dilution in PBST at 4 °C overnight. The protein-antibody complexes were visualized with horseradish peroxidase-goat anti-mouse immunoglobulin G conjugate at a 1:2000
dilution. The blots were incubated for 1 min in the ECL plus kit (Amersham Biosciences) solution and exposed to x-ray film (Hyper-film, Amersham Biosciences). Images were scanned using a LAS-1000S CCD-based camera and semi-quantitatively analyzed using the software package ImageMaster two-dimensional software (Amer-sham Biosciences). Each sample was run in triplicate together with internal standards of phosphotyrosine of known molecular weights (Upstate Biotechnology, Inc.) and the ratio of intensity between sam-ple and internal standard was used for the quantitative analysis.
In-gel Digestion and Mass Spectrometric Analysis—The cellular
pro-teins were separated on two-dimensional gel electrophoresis and stained with Coomassie Blue or Silver. Each spot was in-gel digested with some modifications (26, 27). The gel spots were excised with a scalpel, crushed, and destained by washing with 25 mMammonium bicarbonate, 50% acetonitrile. In the case of silver-stained gel, it is destained by washing with 15 mMK4Fe(CN)6, 50 mMsodium thiosulfate
prior to crushing the gel. The gels were dehydrated by addition of acetonitrile, rehydrated by adding 10 –20l of 25 mMammonium bi-carbonate with 10 ng/l of sequencing grade trypsin (Promega), and incubated at 37 °C for 12–15 h. Peptides were extracted by adding 30l of solution containing 60% acetonitrile, 0.1% trifluoroacetic acid. The extraction was repeated three times and completed by adding 20l of acetonitrile. The extracted solutions were pooled and evaporated to dryness in a SpeedVac vacuum centrifuge. Samples were reconstituted in 10l of 0.1% trifluoroacetic acid and treated with ZipTips containing C18 resin (Millipore) according to the manufacturer’s instructions. The washed peptides were eluted with saturated matrix solution ( ␣-cyano-4-hydroxycinnamic acid in 60% acetonitrile, 0.1% trifluoroacetic acid). FIG. 1. Heat shock effects on tyrosine phosphorylation and
synthesis of proteins. A, RIF-1 and TR-RIF-1 cells were treated with
heat shock at 45 °C for 0, 15, and 45 min. Cells were separated on SDS-PAGE and immunostained with phosphotyrosine-specific mono-clonal antibody. Proteins were visualized by chemiluminescence and the image was read by LAS-1000S. B, RIF-1 and TR-RIF-1 cells were treated with heat shock at 45 °C for 30 min and recovered for 0.5, 3, 6, 12, and 24 h. At the indicated times, cells were pulse-labeled with 1 Ci/ml [35S]methionine in methionine-free RPMI 1640 media for 1 h,
and the same amounts of proteins were separated on 10% SDS-PAGE and autoradiographed by BAS2500. C indicates control.
at Ewha Medical Library on March 29, 2017
http://www.jbc.org/
Peptide mixtures were analyzed with MALDI-TOF MS using a delayed ion extraction and ion mirror reflector mass spectrometer (Voyager-DE STR; Applied Biosystems, Inc.). External calibration was carried out
using Sequazyme Peptide Mass Standard Kit (Perspective Biosystems) and internal calibration, by using the autolytic peaks of trypsin. This procedure typically results in mass accuracies of 50 ppm. For inter-FIG. 2. Two-dimensional gel images visualized by silver staining, Coomassie Blue staining, and immunostaining. RIF-1 and TR-RIF-1 cells were analyzed by two-dimensional gel and visualized by staining. One of the best images was presented. A, two-dimensional silver-stained gel map of pI range 4 –7. B, two-dimensional phosphotyrosine immuno-stained gel map of pI range 4 –7. C, two-dimensional Coomassie Blue-stained gel map of pI range 6 –11. D, two-dimensional phosphotyrosine immuno-stained gel map of pI range 6 –11. Numbered spots were excised and analyzed by in-gel trypsin digestion and MALDI-TOF MS. E, immunoblots of proteins detected with anti-phosphotyrosine antibodies of heat shock-treated cells. Western blot analysis was carried out after two-dimensional gel electrophoresis of the heat shock treated or not treated total proteins. Analyzed spots are indicated by arrows, and the numbers match the numbers on A and B.
at Ewha Medical Library on March 29, 2017
http://www.jbc.org/
pretation of the mass spectra, we used the MS-Fit program available on the web site of the University of California, San Francisco (prospector.ucsf.edu/).
Prediction of Phosphotyrosine Motifs—The phosphorylation sites
were predicted by NetPhos program from the website (www.cbs.dtu.dk/ services/NetPhos) having low stringency and ScanProsite (www.ex-pasy.ch/tools/scnpsite.html) having high stringency. PTKs involved in phosphorylations, and the possible binding proteins of tyrosine phos-phorylated proteins were predicted by Scansite program at the website (scansite.mit.edu/).
RESULTS
Heat Shock-induced Protein Phosphorylations—To deter-mine whether protein phosphorylations might be involved in heat shock response and thermotolerance, we first examined the induction of tyrosine phosphorylation in control RIF-1 cells and their thermotolerant derivatives, TR-RIF-1 cells. Both RIF-1 and TR-RIF-1 cells were exposed to heat shock at 45 °C for 15 or 45 min. After each treatment,
tyrosine-phospho-TABLE I
A list of identified proteins
Spot No. Identified protein NCBI Accession No. Mass pI Coverage
Da %
Proteins that act as chaperones/mediators of protein folding
1 Heat shock protein 70 cognate 309319 70,837.6 5.38 34
2 Heat shock protein 70 cognate 309319 70,837.6 5.38 32
3 HSP70 3986773 70,079.7 5.53 40
5 CCT (chaperonin containing TCP-1)-subunit 468550 59,624.6 5.72 54
6 Similar to ER-60 protease 13096984 56,678.8 5.88 58
62 47-kDa heat shock protein 303678 46,534.0 8.88 23
Proteins that function in transcription and translation
4 Heat shock transcription factor 2 51448 58,155.6 4.77 6
11 hnRNP H 2253041 49,199.9 5.89 14
12 Murin homolog of human ftp-3 (hnRNP H) 1666700 49,280.0 5.89 31
20 Ribonucleoprotein F 17390408 45,730.0 5.31 29
36 Nucleolar protein 200011 32,560.3 4.62 26
37 Eukaryotic translation elongation factor 1-␦ 10442752 31,293.3 4.91 25 47 Eukaryotic translation elongation factor 12 13278099 24,693.9 4.53 34 48 Similar to replication protein A2 13435424 29,430.4 5.47 23
55 L-protein (Homo sapiens) 32356 60,187.8 6.65 16
56 L-protein (Homo sapiens) 32356 60,187.8 6.65 13
72 hnRNP A2/B1 3329498 35,993.3 8.67 37 73 hnRNP A2/B1 3329498 35,993.3 8.67 45 75 TIS 1711240 34,196.5 9.27 48 78 TIS 1711242 28,897.8 8.97 29 79 hnRNP A2/B1 3329498 35,993.3 8.67 45 83 NonO 1083440 54,599.3 8.86 29 86 RNA-binding protein␣-CP1 5805273 37,498.2 6.66 44
Proteins that act in amino acid biosynthesis
22 Ornithine-oxo-acid aminotransferase 53459 48,355.0 6.19 23 59 Inosine-5-monophosphate dehydrogenase 2 124427 55,785.5 6.84 25
61 Glutamate dehydrogenase 51082 61,337.3 8.05 30
66 Precytosolic aspartate aminotransferase 309110 47,411.8 9.13 12
Proteins that are related to oxidation or reduction
51 Nonselenium glutathione peroxidase 2072655 24,870.9 5.71 59 90 Glutathione S-transferase homolog 2393724 27,497.9 6.91 54
Proteins that compose channels
80 Voltage-dependent anion channel 1 6755963 30,755.6 8.62 76 88 Voltage-dependent anion channel 2 6755965 31,733.0 7.44 14
Proteins that act signaling molecules
24 Annexin A7 14290464 49,909.7 5.91 22
32 CPP32 2317650 31,475.1 6.45 31
35 TGF- receptor-binding protein 6014677 36,461.1 5.38 25
50 Prohibitin or B-cell receptor associated protein 32 541732 29,820.3 5.57 36
67 MAP kinase kinase 1495702 37,432.6 7.00 32
68 MAP kinase kinase 1495702 37,432.6 7.00 26
69 MAP kinase kinase 1495702 37,432.6 7.00 24
74 Annexin II, lipocortin II 6996913 38,676.4 7.55 28
81 G protein subunit-like 2137308 35,018.9 8.08 16
82 L-34 protein (amino acids 1–264) 52851 27,428.9 8.58 24
Proteins that function in cell motility or structure
7 Vimentin 2078001 51,564.7 4.96 51 8 Vimentin 2078001 51,564.7 4.96 58 9 Vimentin 2078001 51,564.7 4.96 15 15-Tubulin 55048 49,640.3 4.78 45 17 BAF53a 4001805 47,430.4 5.40 21 21 Vimentin 2078001 51,564.7 4.96 33 26␥-Actin 809561 41,019.4 5.56 52 29-Tropomyosin 50190 32,945.0 4.61 15
33 Capping protein␣1 subunit 595917 32,751.8 5.34 20
38␣-Tubulin Isotype M-␣-6 202217 49,909.8 4.96 24
39␣-Tropomyosin 509182 32,680.8 4.69 27
40␣-Tropomyosin 509182 32,680.8 4.69 17
43-Tubulin 55048 49,671.3 4.78 36
46 Tropomyosin 5 54912 29,020.9 4.75 34
49 Capping protein-subunit, isoform 2 500749 30,629.0 5.69 31
54 Lamin A 346883 74,185.1 6.41 38
at Ewha Medical Library on March 29, 2017
http://www.jbc.org/
rylated proteins were detected with anti-phosphotyrosine an-tibody 4G10 (Fig. 1A). Tyrosine phosphorylations increased in a dose-dependent manner in both RIF-1 and TR-RIF-1 cells. Some of the phosphorylated proteins were common to the two cell lines and some were different.
Next we carried out metabolic labeling of the newly synthe-sized proteins to determine the kinetics of protein synthesis after heat shock in both cells. Although heat shock at 45 °C for 45 min showed more dramatic increase of tyrosine phosphoryl-ation as shown in Fig. 1A, the cells for this study were exposed to heat shock at 45 °C for only 30 min because heat shock of RIF-1 cells at 45 °C for 45 min caused the severe cell death (28). Protein synthesis was monitored by [35S]methionine pulse la-beling during recovery after heat shock. Cells were exposed to heat shock at 45 °C for 30 min, allowed to recover for various lengths of time, and then labeled with [35S]methionine for 1 h at 37 °C to measure the protein synthesis rates. Equal amounts of proteins were applied on each lane of SDS-PAGE. As shown in Fig. 1B, heat shock in both cell lines immediately blocked total protein synthesis which was gradually restored with Hsp synthesis first and followed by total synthesis. Recovery rate of protein synthesis in TR-RIF-1 cells was much faster than in RIF-1 cells and both cell lines recovered to normal after 24 h of recovery. Longer exposure to heat shock at 45 °C blocked pro-tein synthesis to a greater degree and resulted in slower recov-ery or cell death (data not shown). This suggests that it is important to examine the kinetics of tyrosine phosphorylation level of each protein during recovery after heat shock rather than at a fixed time point.
Identification of Phosphorylated Proteins—To determine the tyrosine-phosphorylated proteins involved in heat shock re-sponse, proteome analysis was performed with cells exposed to heat shock and recovered for various times. Both RIF-1 and TR-RIF-1 cells were subjected to heat shock at 45 °C for 30 min and recovered at 37 °C for 0, 4, and 24 h. Cellular proteins harvested at each time point were separated on two sets of two-dimensional gel in two pI ranges, 4 –7 and 6 –11. The gels were visualized by Coomassie Blue or Silver staining or were
blotted to NC membrane and detected with immunostaining using anti-phosphotyrosine monoclonal antibody and ECL chemiluminescence detection kit (Fig. 2). The immunostained NC membranes were exposed to x-ray film for various times to find the linear range depending on the concentrations of the phosphorylated proteins. The film images were scanned using ImageMaster LabScan version 3.00 software connected to Umax scanner. We found 93 phosphorylated proteins contain-ing both basally phosphorylated proteins and heat shock-in-duced phosphorylated proteins both in RIF-1 and TR-RIF-1 cells: 52 spots in pI range of 4 –7 and 41 spots in pI range of 6 –11. Immunostained spots detected in any one of the immu-noblot analyses were overlaid and are depicted by numbered arrows in the silver-stained gel (Fig. 2A) and Coomassie Blue-stained gel (Fig. 2C). The corresponding immunoBlue-stained gels were shown in Fig. 2, B and D. Examples of heat shock-induced tyrosine phosphorylation changes detected with immuno-staining are shown in Fig. 2E.
Protein spots detected on the immunoblot were cut out from the corresponding gel, subjected to in-gel digestion with tryp-sin, and mass peptide fingerprint analyses were conducted. Low abundance proteins (weakly stained with silver) were identified by pooling spots from more than three gels. The obtained mass data were fitted by MS-Fit database search analysis. This allowed us to identify 81 of 93 proteins (64 new phosphorylated proteins and 20 phosphorylated proteins that were previously reported). The identified proteins were listed and grouped by their known functions in Table I and as follows: 5 proteins (6 spots) acting in protein folding, 13 proteins (17 spots) functioning in transcription and translation, 4 proteins acting in amino acid biosynthesis, 2 proteins relating to oxida-tion and reducoxida-tion, 2 channel proteins, 8 (10 spots) signaling molecules, 11 proteins (16 spots) functioning in cell motility or structure, 13 protein (18 spots) acting in energy metabolism, and 6 miscellaneous proteins. Of these, known tyrosine-phos-phorylated proteins are as follows: hnRNP A2/B1 and GAPDH are phosphorylated by c-Src (29) and EGFRK (30), respectively. Annexin II cloned as PTK substrate has been identified as
TABLE I—continued
Spot No. Identified protein NCBI Accession No. Mass pI Coverage
Da %
Proteins that act in energy metabolism
16 ATP synthase-subunit 2623222 56,380.1 5.14 38
19 Proteasome 26S subunit, ATPase 2 13529470 48,648.3 5.72 38
28 Galactokinase 8650486 42,295.6 5.17 23
53 Similar to mitochondrial aconitase 13435538 85,464.2 8.08 29
58 Pyruvate kinase, M2 isozyme 2506796 57,887.3 7.17 35
63 Phosphoglycerate kinase 202423 44,536.8 7.54 28 64 Phosphoglycerate kinase 202423 44,536.8 7.54 29 65 Aldolase 1, A isoform 6671539 39,356.1 8.30 29 70 GAPDH 6679937 35,810.2 8.43 27 71 GAPDH 6679937 35,810.2 8.43 27 76 Lactate dehydrogenase A 538135 36,498.9 7.61 36
77 Creatine kinase, M chain 125306 43,045.3 6.58 15
84 Pyruvate kinase isozyme M2 1363219 57,861.4 7.58 26
85 Pyruvate kinase isozyme M2 1363219 57,861.4 7.58 27
87 Aldolase reductase 3046247 35,718.5 6.71 20
91 Similar to phosphoglycerate mutase 1 12805529 28,832.2 6.68 59
92 Triosephosphate isomerase 54855 26,695.9 6.90 40
93 Triosephosphate isomerase 54855 26,695.9 6.90 34
Miscellaneous
18 Putative 12850298 52,769.2 5.75 21
27 Reticulocalbin 220582 38,113.4 4.70 24
30 RIKEN cDNA 2410174K12 gene 14318755 38,159.2 5.32 29
41 Putative 12848170 38,937.5 6.41 36
52 -Proteasome subunit 1762779 29,116.4 5.47 34
60 RIKEN cDNA 2700043D08 gene 13435984 55,761.2 8.72 35
10, 13, 14, 23, 25, 31, 34, 42, 44, 45, 57, 89a aThese spot numbers are unidentified.
at Ewha Medical Library on March 29, 2017
http://www.jbc.org/
FIG. 3. Quantification of protein tyrosine phosphorylation. A, comparison of basal phosphorylations in control RIF-1 cells and thermo-tolerant TR-RIF-1 cells. Immunostained spots with phosphotyrosine antibody in unstressed RIF-1 (black bars) and TR-RIF-1 (white bars) cells were quantified, and their intensities were normalized to the intensities of RIF-1 cells and expressed as a relative intensity. B and C, kinetics of the phosphorylation in tyrosine residues in various spots during recovery after heat shock at 45 °C for 30 min. Immunostained spots of heat shock-stressed RIF-1 (B) and TR-RIF-1 (C) were quantified, and their intensities were normalized to control without heat shock and expressed in relative magnitude as a relative intensity. White bars, control cells; black bars, cells immediately after heat shock; gray bars, 4 h recovered cells after heat shock; hatched bars, 24 h recovered cells. Bars more than 10-fold were abbreviated.
at Ewha Medical Library on March 29, 2017
http://www.jbc.org/
major substrates for retrovirus encoded PTK pp60 v-Src (31), platelet-derived growth factor (32), insulin (33), and hepatocyte growth factor/scatter factor (34) receptor tyrosine kinases. Hsp70 was revealed as phosphorylation at Tyr-524 in COS-1 cells that corresponded with Tyr-525 in mouse Hsp70 (35). Aldolase 1A and lactate dehydrogenase A were shown that
phosphorylated in Tyr-361 (Tyr-364 in mouse aldolase 1A) (36) and Tyr-238 (Tyr-239 in mouse lactate dehydrogenase A) (37), respectively.
A few proteins could not be identified because these were low abundant proteins (⬍100 fmol) and poorly detected with silver staining, or because peptide mass fingerprints with sound
spec-FIG. 3—continued
at Ewha Medical Library on March 29, 2017
http://www.jbc.org/
tra did not match with mouse protein database. Different spots including spots 1 and 2 (heat shock protein 70 cognate), 11 and 12 (hnRNP H), 55 and 56 (L-protein), 67, 68, and 69 (MAP kinase kinase), 72, 73, and 79 (hnRNP A2/B1), 75 and 78 (topoisomerase inhibitor-suppressed), 7, 9, and 21 (vimentin), 39 and 40 (␣-tropomyosin), 15 and 43 (-tubulin), 63 and 64 (phosphoglycerate kinase), 70 and 71 (GAPDH), 58, 84, and 85 (pyruvate kinase isozyme M2), and 92 and 93 (triosephosphate isomerase) turned out to be the same proteins possibly due to modifications such as phosphorylation or degradation. Spot 18, 30, 41, and 60 were identified as putative proteins or unnamed proteins with known sequences. Blast search for the homolo-gous sequence proteins showed that these have human homol-ogous proteins, ubiquitol-cytochrome c reductase core I protein, suppressor of G2 allele of skp1 homolog, pyruvate
dehydrogen-ase, and mitochondrial serine hydroxymethyltransferdehydrogen-ase, re-spectively. These results suggest that proteins having various cellular functions were tyrosine-phosphorylated during heat shock response. This type of massive proteomic analytical ap-proach which agrees with previous results may provide clues to the understanding of the heat shock phenomena.
Heat Shock Changes in the Levels of Protein Phosphoryla-tion—To determine the possible molecules involved in heat shock responses and thermotolerance, we examined the kinet-ics of protein tyrosine phosphorylations in both RIF-1 and thermotolerant TR-RIF-1 cells during recovery after heat shock. Cellular proteins obtained from cells exposed to heat shock at 45 °C for 30 min and then recovered for 0, 4, and 24 h were separated on two-dimensional gel and detected with im-munoblotting with phosphotyrosine antibody. Each spot was
TABLE II
Comparison of protein tyrosine phosphorylation after heat shock in RIF-1 and TR-RIF-1 cells
TR/RIF, tyrosine phosphorylation level of control TR-RIF-1 cells divided by the level of control RIF-1 cells in normal state; c, control; Imm, immediately after heat shock; 4h, 4 h recovery after heat shock; 24h, 24 h recovery after heat shock; 1, relative tyrosine phosphorylation level of control cells; 0, decreased intensity;⫹, 2–5-fold increase; ⫹⫹, 5–10-fold increase: ⫹⫹⫹, 10–100-fold increase: ⫹⫹⫹⫹, more than 100-fold increase: ⫺, 2–5-fold decrease; – –, 5–10-fold decrease; – – –, 10–100 fold decrease; ⫽, less than 2-fold difference
Spot No. Identified protein TR/RIF RIF-1 TR-RIF-1
c Imm 4h 24h c Imm 4h 24h
PROTEIN FAMILY 1
Proteins that act as chaperones/mediators of protein folding
1 Heat shock protein 70 cognate ⫹⫹⫹ 1 1 1 1 1 0 1 0
2 Heat shock protein 70 cognate ⫹ 1 ⫹ ⫹⫹ 0 1 1 ⫹ 1
3 HSP70 ⫹ 1 1 1 ⫹⫹⫹⫹ 1 1 ⫹ ⫹
5 CCT (chaperonin-containing TCP-1)-subunit ⫹⫹ 1 1 ⫹ 1 1 ⫹ ⫹ 0
Proteins that function in transcription and translation
56 L-protein (H. sapiens) ⫹⫹⫹ 1 ⫹⫹⫹ ⫹⫹⫹ ⫹⫹⫹ 1 ⫹ 0 ⫹
86 RNA-binding protein␣-CP1 ⫹⫹⫹ 1 0 0 ⫹⫹⫹⫹ 1 ⫹ 1 ⫹⫹
Proteins that are related to oxidation or reduction
51 Nonselenium glutathione peroxidase ⫹⫹ 1 ⫹ ⫹⫹ ⫹⫹ 1 1 1 1
90 Glutathione S-transferase homolog ⫹⫹⫹ 1 0 ⫹ 0 1 ⫹⫹ ⫹ ⫹
Proteins that compose channels
88 Voltage-dependent anion channel 2 ⫹⫹ 1 0 ⫹ ⫹ 1 ⫹ ⫹ 1
Proteins that act as signaling molecules
32 CPP32 ⫹ 1 1 1 ⫹⫹ 1 ⫹ 1 0
35 TGF- receptor-binding protein ⫹⫹ 1 ⫹ ⫹ ⫹⫹ 1 1 ⫹ 1
50 Prohibitin, B-cell receptor-associated protein (BAP) 32 ⫹⫹⫹ 1 ⫹⫹ ⫹⫹⫹ ⫹⫹ 1 0 1 1
Proteins that function in cell motility or structure
46 Tropomyosin 5 ⫹ 1 ⫹ ⫹ ⫹⫹⫹ 1 ⫹ ⫹ 1
49 Capping protein-subunit, isoform 2 ⫹⫹⫹ 1 ⫹ ⫹⫹⫹ ⫹⫹⫹ 1 1 ⫹ 1
Proteins that act in energy metabolism
58 Pyruvate kinase, M2 isozyme ⫹⫹ 1 ⫹ ⫹⫹⫹ ⫹⫹⫹ 1 ⫹ ⫹⫹ ⫹⫹
70 GAPDH ⫹⫹ 1 ⫹ 0 1 1 1 1 1
84 Pyruvate kinase isozyme M2 ⫹⫹⫹ 1 1 ⫹⫹⫹ ⫹⫹⫹ 1 ⫹ 0 ⫹
85 Pyruvate kinase isozyme M2 ⫹⫹⫹ 1 1 ⫹ ⫹ 1 1 0 0
92 Triosephosphate isomerase ⫹⫹⫹⫹ 1 0 ⫹⫹⫹⫹⫹ ⫹⫹⫹⫹ 1 ⫹ ⫹ 1
Miscellaneous
30 RIKEN cDNA 2410174K12 gene ⫹⫹ 1 ⫹ ⫹⫹⫹ ⫹⫹⫹ 1 1 1 0
41 Putative ⫹⫹ 1 ⫹ ⫹⫹ ⫹⫹⫹ 1 ⫹ ⫹ 1
42 Unidentified ⫹⫹⫹⫹ 1 ⫹ ⫹⫹⫹ ⫹⫹ 1 1 0 0
44 Unidentified ⫹⫹⫹⫹ 1 1 ⫹ ⫹⫹⫹⫹ 1 0 0 0
45 Unidentified ⫹⫹ 1 1 ⫹⫹ ⫹ 1 0 0 0
PROTEIN FAMILY 2
Proteins that function in transcription and translation
72 hnRNP A2/B1 – 1 ⫹ ⫹ ⫹ 1 ⫹ ⫹⫹⫹ ⫹⫹
75 TIS – – 1 1 1 ⫹ 1 ⫹⫹ ⫹ ⫹⫹
78 TIS – – – 1 0 0 1 1 ⫹⫹⫹ ⫹ ⫹
Proteins that act in amino acid biosynthesis
61 Glutamate dehydrogenase – – 1 ⫹⫹ 0 0 1 ⫹⫹ 1 ⫹⫹⫹
66 Precytosolic aspartate aminotransferase – – – 1 1 0 ⫹ 1 ⫹⫹⫹ ⫹⫹⫹ ⫹⫹⫹
Proteins that compose channels
80 Voltage-dependent anion channel 1 – 1 1 0 ⫹ 1 ⫹ ⫹ ⫹
Proteins that act as signaling molecules
24 Annexin A7 – 1 0 1 ⫹ 1 ⫹ ⫹ ⫹
67 MAP kinase kinase – – 1 1 0 1 1 ⫹⫹ ⫹⫹ ⫹
68 MAP kinase kinase – – 1 1 1 ⫹ 1 ⫹⫹ ⫹⫹ ⫹⫹
74 Annexin II, lipocortin II – 1 ⫹ 1 ⫹ 1 ⫹ ⫹⫹ ⫹⫹
82 L-34 protein (AA 1–264) – 1 1 0 1 1 1 ⫹ ⫹
Proteins that function in cell motility or structure
15-Tubulin – 1 0 0 1 1 ⫹ ⫹ ⫹
21 Vimentin – 1 1 1 1 1 ⫹ ⫹ ⫹
at Ewha Medical Library on March 29, 2017
http://www.jbc.org/
semi-quantified using ImageMaster two-dimensional version 3.01 software. To compensate the false positive or negative caused by the different efficiency of each gel in transferring proteins from gel to membrane, blocking of nonspecific binding, probing with antibody, exposure time of chemiluminescence, and so on, we loaded same amount of phosphotyrosine molec-ular weight marker in each gel. We converted the measured intensity of each spot into fold number over the intensity of standard marker. We calculated the relative intensity of each sample to compare the intensity with control sample without heat shock and represented in Fig. 3.
Because phosphorylations may modulate protein activity, the degree of protein phosphorylation is probably a better marker of cellular status than protein levels. To determine the molecules involved in heat shock signaling and
thermotoler-FIG. 4. Heat shock-induced tyrosine phosphorylation of GAPDH and heat shock protein 70 cognate. RIF-1 and TR-RIF-1
cells were either left untreated or heat shock-treated at 45 °C for 30 min and recovered for 4 h at 37 °C. Cleared cell lysates and nuclear fractions were put together and immunoprecipitated with anti-phosphotyrosine antibodies, washed, and resolved by SDS-PAGE. The gel was trans-ferred to NC membrane and then probed with polyclonal anti-GAPDH or monoclonal anti-HSP70 antibody. Immunocomplexes were detected by ECL solution kit and read by LAS-1000 S.
TABLE II—continued
Spot No. Identified protein TR/RIF RIF-1 TR-RIF-1
c Imm 4h 24h c Imm 4h 24h
Proteins that act in energy metabolism
16 ATP synthase-subunit – 1 ⫹ ⫹ ⫹ 1 ⫹ ⫹⫹⫹ ⫹
53 Similar to mitochondrial aconitase – 1 1 0 1 1 ⫹ 1 ⫹
71 GAPDH – 1 ⫹ 0 ⫹ 1 ⫹ ⫹⫹ ⫹
76 Lactate dehydrogenase A – 1 1 ⫹ 1 1 ⫹⫹ ⫹⫹ 1
87 Aldolase reductase – – 1 0 0 0 1 ⫹ 1 ⫹
91 Similar to phosphoglycerate mutase 1 – 1 0 0 0 1 ⫹⫹⫹ ⫹ ⫹⫹
Miscellaneous
57 Unidentified – – – 1 ⫹ 1 0 1 ⫹ ⫹⫹⫹ ⫹
89 Unidentified – – 1 0 1 0 1 1 ⫹ ⫹⫹⫹
PROTEIN FAMILY 3
Proteins that act as chaperones/mediators of protein folding
6 Similar to ER-60 protease ⫽ 1 ⫹ ⫹ ⫹ 1 ⫹ ⫹ 1
Proteins that function in transcription and translation
4 Heat shock transcription factor 2 ⫹ 1 1 1 1 1 ⫹ ⫹ 0
11 hnRNP H ⫽ 1 ⫹ ⫹ ⫹ 1 ⫹ ⫹ 1
12 Murin homolog of human ftp-3 (hnRNP H) ⫽ 1 1 ⫹ ⫹ 1 ⫹⫹ ⫹⫹ 1
20 Ribonucleoprotein F ⫽ 1 1 ⫹ ⫹ 1 ⫹ ⫹ 1
36 Nucleolar protein ⫺ 1 ⫹⫹ ⫹ ⫹ 1 ⫹ ⫹ 1
37 Eukaryotic translation elongation factor1-␦ ⫹ 1 ⫹ ⫹ ⫹ 1 ⫹ ⫹ 1 47 Eukaryotic translation elongation factor12 ⫺ 1 1 ⫹ ⫹ 1 ⫹ 1 1
48 Similar to replication protein A2 ⫹ 1 1 1 ⫹⫹ 1 0 ⫹ 1
55 L-protein (H. sapiens) ⫽ 1 1 1 ⫹ 1 1 0 1
73 hnRNP A2/B1 ⫽ 1 1 ⫹⫹ ⫹⫹ 1 1 ⫹ ⫹
79 hnRNP A2/B1 ⫺ 1 ⫹ ⫹ ⫹ 1 ⫹ 1 ⫹
83 NonO ⫽ 1 1 ⫹⫹ ⫹⫹⫹ 1 0 ⫹⫹ ⫹⫹⫹
Proteins that act in amino acid biosynthesis
22 Ornithine oxo-acid aminotransferase ⫽ 1 ⫹ ⫹ ⫹⫹ 1 ⫹ 1 1
59 Inosine-5-monophosphate dehydrogenase 2 ⫽ 1 ⫹ ⫹ ⫹ 1 1 ⫹ ⫹⫹
Proteins that act as signaling molecules
69 MAP kinase kinase ⫽ 1 ⫹ ⫹⫹ ⫹⫹ 1 ⫹⫹ ⫹⫹ ⫹
81 G protein-subunit-like ⫺ 1 1 0 ⫹⫹⫹ 1 ⫹⫹ 0 ⫹
Proteins that function in cell motility or structure
7 Vimentin ⫹ 1 1 1 ⫹ 1 ⫹ ⫹ 1 8 Vimentin ⫺ 1 ⫹ 1 1 1 1 ⫹ ⫹ 9 Vimentin ⫽ 1 ⫹ ⫹ ⫹⫹ 1 ⫹⫹ ⫹⫹⫹ 1 17 BAF53a ⫽ 1 ⫹ ⫹ ⫹ 1 ⫹ ⫹ ⫹ 26 ␥-Actin ⫽ 1 ⫹ ⫹ ⫹ 1 ⫹ ⫹ ⫹ 29 -Tropomyosin ⫽ 1 ⫹ 1 1 1 ⫹ ⫹ ⫹
33 Capping protein␣-1 subunit ⫽ 1 1 ⫹⫹ ⫹⫹ 1 ⫹ ⫹⫹⫹ ⫹
39 ␣-Tropomyosin ⫹ 1 1 ⫹ ⫹ 1 ⫹ ⫹ ⫹
Proteins that act in energy metabolism
19 Proteasome 26 S subunit, ATPase 2 ⫽ 1 ⫹ ⫹ ⫹⫹ 1 ⫹ ⫹ 1
28 Galactokinase ⫽ 1 ⫹ ⫹⫹ ⫹⫹ 1 1 1 0
63 Phosphoglycerate kinase ⫺ 1 ⫹ 0 1 1 1 0 ⫹
64 Phosphoglycerate kinase 1 ⫺ 1 1 ⫹⫹ 1 1 ⫹ 1 0
65 Aldolase 1, A isoform ⫺ 1 ⫹ ⫹ 1 1 1 ⫹ ⫹
77 Creatine kinase, M chain ⫽ 1 0 0 ⫹ 1 ⫹ ⫹ ⫹
93 Triosephosphate isomerase ⫹ 1 0 0 0 1 ⫹ 1 ⫹ Miscellaneous 10 Unidentified ⫽ 1 0 1 ⫹ 1 ⫹ ⫹ 1 14 Unidentified ⫹⫹ 1 1 1 1 1 ⫹ 1 1 18 Putative ⫹ 1 1 ⫹ ⫹ 1 1 ⫹ 1 23 Unidentified ⫺ 1 ⫹⫹⫹ ⫹⫹⫹ ⫹⫹⫹ 1 ⫹⫹⫹ ⫹⫹ 1 27 Reticulocalbin ⫽ 1 1 ⫹ ⫹ 1 ⫹ 1 1 52 -Proteasome subunit ⫹ 1 ⫹ ⫹⫹ ⫹ 1 1 ⫹⫹ ⫹
60 RIKEN cDNA 2700043D08 gene ⫺ 1 1 1 ⫹ 1 1 1 ⫹
at Ewha Medical Library on March 29, 2017
http://www.jbc.org/
ance, we therefore compared the degree of protein tyrosine phosphorylation in RIF-1 cells and TR-RIF-1 cells at basal level (Fig. 3A) and we examined the kinetics of tyrosine phosphoryl-ation of each protein during recovery after heat shock (Fig. 3B, C). We chose the following three recovery time points based on protein synthesis profiles shown in Fig. 1B: (a) immediately after heat shock when protein synthesis is completely blocked in both of RIF-1 and TR-RIF-1 cell lines; (b) after 4 h of recovery time when TR-RIF-1 cells are restarting protein synthesis in-cluding Hsp synthesis but not RIF-1 cells; and (c) after 24 h recovery when both of cell lines are recovered, protein synthe-sis returned to normal, and transient thermotolerant state even in RIF-1 is sustained. The degree of phosphorylations of each spot was quantified and normalized over standard mark-ers and control cells.
Table II summarizes these studies. We sorted the proteins into three groups depending on the ratio of phosphorylation degree of basal level without heat shock in TR-RIF-1 to in RIF-1 (TR/RIF in Table II).
The first group of proteins (Table II, PROTEIN FAMILY 1)
show higher basal tyrosine phosphorylation levels in TR-RIF-1 cells than in control RIF-1 cells. These proteins responded sensitively to heat shock and significantly phosphorylated only in RIF-1 cells. This group of proteins showed increased extents of tyrosine phosphorylations in TR-RIF-1 cells and only phos-phorylated by heat shock in RIF-1 cells. It is possible that the phosphorylated forms of the proteins are involved in maintain-ing cellular thermotolerance. These include 4 chaperones/me-diators of protein folding, 2 oxido-reduction related proteins, 2 transcription and translation related proteins, 3 signaling mol-ecules, 1 protein that serves as an ion channel, 2 proteins influencing cell motility and structure, 5 proteins playing roles in energy metabolism, and 5 miscellaneous or unidentified.
The second group of proteins showed higher basal tyrosine phosphorylation levels in RIF-1 cells than in TR-RIF-1 cells (Table II, PROTEIN FAMILY 2). These proteins responded sensitively to heat shock only in TR-RIF-1 cells and were dra-matically phosphorylated by heat shock. The dephosphorylated forms of the proteins may make the cells less sensitive to heat shock. Heat shock-induced tyrosine phosphorylation of the
pro-TABLE III
A list of predicted tyrosine phosphorylation sites using NetPhos and ScanProsite prediction programs
The table lists proteins identified in this study and predicted phosphotyrosine residues using NetPhos (www.cbs.dtu.dk/services/NetPhos/) and ScanProsite (www.expasy.ch/tools/scanpsite.html). The table also shows previously reported tyrosine phosphorylated proteins by references.
Spot No. Identified protein NetPhos prediction site prediction siteScanProsite Ref.
Proteins that act as chaperones/mediators of protein folding
1 Heat shock protein 70 cognate 15, 41, 288, 431, 525, 545 525 35 2 Heat shock protein 70 cognate 15, 41, 288, 431, 525, 545 525 35
3 HSP70 15, 41, 431, 424 525 51
5 CCT (chaperonin-containing TCP-1)-subunit 12, 137, 274 503
6 Similar to ER-60 protease 67, 95, 115, 269, 416, 445, 454 115, 416, 479 52 62 47-kDa heat shock protein 153, 346, 370, 382
Proteins that function in transcription and translation
4 Heat shock transcription factor 2 279, 293, 362 249
11 hnRNP H 210, 243, 253, 266, 276, 306, 372, 376, 433 266, 306 52 12 Murin homolog of human ftp-3 (hnRNP H) 210, 243, 249, 253, 366, 376, 306, 372, 376, 433, 444 266, 306
20 ribonucleoprotein F 11, 194, 210, 253, 266, 276, 306, 372, 414 306 36 Nucleolar protein
37 Eukaryotic translation elongation factor 1-␦ 18, 26 18 47 Eukaryotic translation elongation factor 1 2 24, 28, 213
48 Similar to replication protein A2 14, 20, 125, 256
55 L-protein (Homo sapiens) 61, 132, 173, 181, 254, 293, 297, 302, 332, 344, 399 254 56 L-protein (Homo sapiens) 61, 132, 173, 181, 254, 293, 297, 302, 332, 344, 399 254
72 hnRNP A2/B1 123, 222, 232, 264, 275, 288 29 73 hnRNP A2/B1 123, 222, 232, 264, 275, 288 29 75 TIS 128, 244, 253, 262 78 TIS 128, 244, 260, 289, 314 79 hnRNP A2/B1 123, 222, 232, 264, 275, 288 29 83 NonO 160, 269 35 86 RNA-binding protein␣-CP1 207
Proteins that act in amino acid biosynthesis
22 Ornithine-oxo-acid aminotransferase 45, 50, 126, 158, 194, 209, 245, 299 52 59 Inosine-5-monophosphate dehydrogenase 2 4, 41, 258, 289, 294, 430
61 Glutamate dehydrogenase 193, 240, 289, 429, 539 464 66 Precytosolic aspartate aminotransferase 316, 401, 420 96, 401
Proteins that are related to oxidation or reduction
51 Nonselenium glutathione peroxidase 217
90 Glutathione S-transferase homolog 97, 108, 160, 174 108
Proteins that compose channels
80 Voltage-dependent anion channel 1 7, 62, 118 88 Voltage-dependent anion channel 2 19, 74
Proteins that act as signaling molecules
24 Annexin A7 6, 358, 377, 401, 402
32 CPP32 32, 41, 128, 147, 195, 274 32
35 TGF- receptor-binding protein 139, 300, 308, 318 50 Prohibitin or B-cell receptor-associated protein
(BAP) 32
67 MAP kinase kinase 339 305
68 MAP kinase kinase 339 305
69 MAP kinase kinase 339 305
74 Annexin II, lipocortin II 24, 30, 151, 188, 275, 327 31–34, 54
81 G protein-subunit-like 52 52
82 L-34 protein (AA 1–264)
at Ewha Medical Library on March 29, 2017
http://www.jbc.org/
teins in TR-RIF-1 cells may make TR-RIF-1 cells like RIF-1 cells and trigger heat shock signaling pathway as RIF-1 cells do. This group includes 3 proteins functioning in transcription and translation, 2 proteins related to amino acid biosynthesis, 1 voltage-dependent anion channel, 5 signaling molecules, 2 cytoskeletal proteins, 6 energy metabolism-related proteins, and 2 unidentified proteins.
The third group of proteins showed similar basal tyrosine phosphorylation levels between RIF-1 and TR-RIF-1 cells, and they similarly responded to heat shock and similar increase of tyrosine phosphorylation in both cells (Table II, PROTEIN FAMILY 3). This group of proteins is phosphorylated by heat shock in both RIF-1 and TR-RIF-1 cells, although minor kinetic differences exist. These proteins may directly respond to heat shock and may be involved in heat shock signaling pathways regardless of thermotolerance. This group of proteins includes the following: 1 that acts as chaperone/mediator, 12 proteins functioning in transcription and translation, 2 acting in amino acid biosynthesis, 2 acting in signaling, 8 cytoskeletal proteins, 7 acting in energy metabolism, and 7 putative proteins or unidentified proteins.
Before the quantification, we expected that most of the pro-teins would show increased levels of protein tyrosine phospho-rylation (Fig. 1A). However, some proteins such as the 47-kDa heat shock protein,␣-tubulin isotype M-␣-6, lamin A, and an unidentified protein showed decreased levels of tyrosine phos-phorylation as a function of time after heat shock. This
sug-gests that some kinases may be inactivated by heat shock or some phosphatases may be activated by heat shock. It would be of interest to identify these kinase and phosphatases involved in heat shock signaling pathway.
To determine the reliability of our semi-quantitative analy-sis, we performed immunoprecipitation analysis with anti-phosphotyrosine antibody in heat-shocked RIF-1 and TR-RIF-1 cells. Heat shock induced dramatic phosphorylation on GAPDH in heat-shocked TR-RIF-1 cells (Fig. 4). Although the phospho-rylation levels of control cells were detectable in two-dimen-sional gel analysis, it is hard to detect in Fig. 4. It may be due to a small fraction of phosphorylation on GAPDH in control RIF-1 and TR-RIF-1 cells or a small amount of anti-phospho-tyrosine antibody used in the immunoprecipitation. In the case of HSC70, heat shock increased tyrosine phosphorylation in both cell lines, although the total amount of phosphorylated protein is higher in TR-RIF-1 cells. These results were coinci-dent with the quantitative analysis results performed as pre-sented in Fig. 3. In Fig. 3B and C, spot 70 (GAPDH) did not show prominent changes in both RIF-1 and TR-RIF-1 cells and spot 71 (GAPDH) of TR-RIF-1 cells showed an increased level of phosphorylation intensity after a 4-h recovery more than 5-fold compared with RIF-1 cells. Heat shock increased the phosphorylation level of spot 2 (HSC70) in both RIF-1 and TR-RIF-1 cells after a 4-h recovery. The basal levels of tyrosine phosphorylation of GAPDH and HSC70 in Fig. 4 were well matched with the quantitative results in Fig. 3A. In addition,
TABLE III—continued
Spot No. Identified protein NetPhos prediction site prediction siteScanProsite Ref.
Proteins that function in cell motility or structure
7 Vimentin 10, 33, 256, 271 14, 52, 55 8 Vimentin 10, 33, 256, 271 14, 52, 55 9 Vimentin 10, 33, 256, 271 36, 52, 55 15 -Tubulin 59, 106, 200, 222, 310, 425 52 17 BAF53a 69, 144, 253, 274, 287, 416 21 Vimentin 11, 30, 53, 276, 291 36, 52, 55 26 ␥-Actin 46, 191, 211, 233, 287, 355 191, 211 55 29 -Tropomyosin 60, 162, 214, 221
33 Capping protein␣1 subunit 134, 197, 237, 245
38 ␣-Tubulin isotype M-␣-6 210, 224, 399, 432, 449 172 39 ␣-Tropomyosin 60, 162, 214, 221, 261, 267
40 ␣-Tropomyosin 60, 162, 214, 221, 261, 267
43 -Tubulin 59, 106, 200, 222, 310, 425 52
46 Tropomyosin 5 126, 178, 185
49 Capping protein-subunit, isoform 2 71, 107, 111
54 Lamin A 359 267 35, 52
Proteins that act in energy metabolism
16 ATP synthase-subunit 247, 418 395 52
19 Proteasome 26 S subunit, ATPase 2 4, 111, 174, 429 147
28 Galactokinase 47, 300, 318 312
53 Similar to mitochondrial aconitase 42, 306, 390, 432, 544, 665, 715 432
58 Pyruvate kinase, M2 Isozyme 161, 175, 370 148, 390
63 Phosphoglycerate kinase 76, 161, 196, 324 64 Phosphoglycerate kinase 1 76, 161, 196, 324 65 Aldolase 1, A isoform 85, 328, 343, 364 223 36 70 GAPDH 47, 138, 253, 316, 318 328 30 71 GAPDH 47, 138, 253, 316, 318 328 30 76 Lactate dehydrogenase A 83, 239 239 30, 37, 53
77 Creatine kinase, M chain 20, 82, 125, 173, 279
84 Pyruvate kinase isozyme M2 161, 175, 370 148, 390
85 Pyruvate kinase isozyme M2 161, 175, 370 148, 390
87 Aldolase reductase 122 40
91 Similar to phosphoglycerate mutase 1 133, 142 92 30, 37, 53
92 Triosephosphate isomerase 48 53
93 Triosephosphate isomerase 48 53
Miscellaneous
18 Putative 131, 219, 348, 450
27 Reticulocalbin 111, 134, 222
30 RIKEN cDNA 2410174K12 gene 95, 145, 189, 254
41 Putative 67, 132
52 -Proteasome subunit 102, 169 52
60 RIKEN cDNA 2700043D08 gene 100, 234, 270, 309 309
at Ewha Medical Library on March 29, 2017
http://www.jbc.org/
we detected tyrosine phosphorylation of hnRNP A2/B1 in RIF-1 cells and vimentin in Rat2 cells by immunoprecipitation and Western blot analysis (data not shown). Although we did not examine all of the listed proteins, the specificity of
anti-phos-photyrosine antibody used in Western blot analysis and accu-racy of computational quantification are quite reliable.
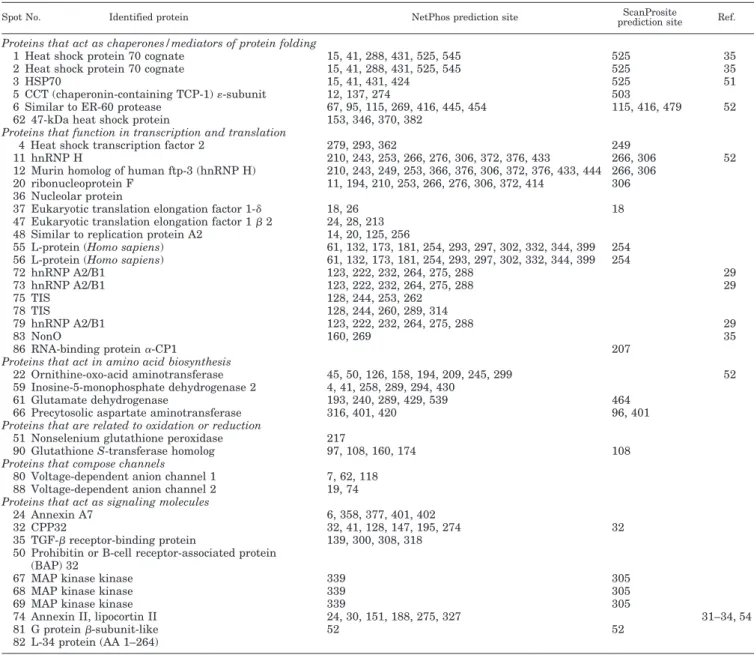
Prediction of Possible Tyrosine Phosphorylation Sites of Each Protein—Large scale analysis of 64 phosphorylated proteins by
TABLE IV
A list of predicted tyrosine phosphorylation sites using Scansite prediction program
The table lists proteins identified in this study and predicted phosphotyrosine residues using Scansite (scansite.mit.edu/). The table also shows the possible protein tyrosine kinases that phosphorylate the proteins and the possible proteins that bind to the tyrosine-phosphorylated proteins.
at Ewha Medical Library on March 29, 2017
http://www.jbc.org/
heat shock were performed by computer-assisted program. This study allowed us to predict the possible phosphorylation sites, possible protein kinases involved, and the possible pro-teins that bind to phosphorylated propro-teins. Prediction of phos-phorylation sites were performed by two computer programs including NetPhos (www.cbs.dtu.dk/services/NetPhos/) and ScanProsite (www.expasy.ch/tools/scnpsite.html) shown in Ta-ble III. The discrepancies between the two programs arise from the different algorithms. ScanProsite predicts the phosphoryl-ation sites based on the limited motifs (RK)X(2)(DE)X(3)Y or (RK)X(3)(DE)X(2)Y (where Y is the phosphorylation site), whereas NetPhos is based on neural network method which tends to predict the false positive sites. Table IV lists the predicted phosphotyrosine residues with possible phosphoty-rosine kinase or phosphotyphosphoty-rosine recognition motifs using Scansite (scansite.mit.edu/). The predicted site was character-istic of each of the program. Steen et al. (38) reported that such predictions should be done very cautiously. All three programs predicted the same phosphorylation site in only one protein, Tyr-306 in hnRNP H (spots 11 and 12). However, as the pro-grams use unique algorithms for prediction of phosphorylation sites, combining and comparing the results from the three programs should give useful information. In fact, the programs can predict the tyrosine phosphorylation sites as reported ex-perimentally; HSC70 (spots 1 and 2), aldolase A isoform (spot 65), and lactate dehydrogenase A (spot 76) were previously known as tyrosine-phosphorylated proteins and Tyr-525 (Tyr-524 in COS-1 cells) (35), Tyr-364 (Tyr-361 in rabbit liver cell) (36), and Tyr-239 (Tyr-238 in Rous sarcoma virus-transformed cell) (37) were the tyrosine phosphorylation sites, respectively. At least two of the three programs predicted the known sites correctly.
Scansite predicted not only tyrosine phosphorylation sites but also tyrosine kinase that phosphorylated the predicted sites and binding proteins of phosphorylated motifs. From the
results, we can postulate the heat shock-activated signaling pathways. The numbers presented at the bottom of Table IV suggest that the sum of the numbers of proteins that are predicted as sites for each of kinase or phosphotyrosine recog-nition motif. It appears that the bigger the number, the higher the possibility that the kinases and phosphotyrosine recogni-tion motif-containing proteins were activated. Except for PDZ class 2 phosphotyrosine recognition motif, all kinases and phos-photyrosine recognition motifs were predicted from 3 to 13. It means the listed protein tyrosine kinases and proteins that recognize phosphotyrosine motifs can be activated in response to heat shock. Activation of EGFR and c-Src (14) and induction of epidermal growth factor (40) and basic fibroblast growth factor (41) by heat shock were reported previously. p56 Lck was activated in lymphocyte in response to oxidants, heavy metals, and heat shock (42). As Lck and Nck are immune cell-specific kinases, homologs of Lck and Nck may act in RIF-1 and TR-RIF-1 cells in response to heat shock. Also, heat shock induced activation of Ras-Raf-MAPK and Shc-Grb2 pathways (43). In this study, 13 sites and 6 sites were predicted as Grb2-SH2 and Shc-SH2 recognition sites, respectively. The most frequently predicted site was PLC␥-SH2 binding domain. Heat shock-induced activation of PLC was briefly reported previously (44 – 47).
DISCUSSION
These studies have identified a number of proteins involved in heat shock phenomena by proteome analysis. We focused on phosphorylation based on the previous reports (7) that heat shock activates various kinases and induces tyrosine phospho-rylation in cultured cells. Large scale proteome analysis com-bining the separation of proteins on two-dimensional gel with protein identifications with MALDI-TOF MS made it possible to identify 93 phosphorylated proteins by heat shock in RIF-1 and TR-RIF-1 cells. This is the first report that 93 proteins
TABLE IV—continued
at Ewha Medical Library on March 29, 2017
http://www.jbc.org/
having various functions are responsive to phosphorylation by heat shock. Eighty one of 93 proteins were identified. Identifi-cation of 64 distinct proteins from 81 spots shows the existence of post-translational modifications and alternative splicing in addition to phosphorylation by heat shock. Of these, 21 pro-teins were reported previously as phosphorylated by various signals (see references in Table III) and 43 are newly identified as phosphorylated by heat shock. In some cases, the amount of protein was too small to be identified from the available se-quence data base for the mouse genome. Thus there may well be other novel proteins that have not yet been registered in the protein data base.
These studies further show that kinetic analysis of the phos-phorylation can reveal the possible process by which a protein may act in heat shock response which includes a transient im-mediate blockage of protein synthesis, protein synthesis recovery (Hsps first and then normal proteins after heat shock), and transient induction of thermotolerance. Major differences be-tween thermotolerant TR-RIF-1 cells and control cells include less sensitivity to heat shock and faster recovery after heat shock in TR-RIF-1 cells. Activation of SAPK/JNK, a marker of stress, in TR-RIF-1 cells, by same amount of heat shock, was less than that in control RIF-1 cells (28) because of the insensitivity of thermo-tolerant cells. The recovery of Hsp and normal protein synthesis in TR-RIF-1 cells was much faster than in control cells as shown in Fig. 1B. Although the rate and extent of heat shock response are different in RIF-1 and TR-RIF-1 cells, the heat shock path-ways seem to be the same.
We were able to sort the 81 proteins identified into three groups based on the kinetic analysis of phosphorylation by heat shock. The first group of proteins showed increased basal phos-phorylations in TR-RIF-1 cells (without heat shock) over RIF-1 cells and a significant increase in phosphorylation after heat shock only in RIF-1 cells. This suggests that the phosphoryla-tion of the first group of proteins is required for the mainte-nance of thermotolerance. Mild heat shock to control RIF-1 cells induced transient thermotolerance after 24 h of recovery, which is consistent with phosphorylation status of the first group of proteins in RIF-1 cells after 24 h of recovery after heat shock. This group contains chaperones that are known to be involved in thermotolerance (Hsp70 (2 spots), HSC70, and chaperonin containing TCP-1 ⑀-subunit), and also transcrip-tion- and translatranscrip-tion-related proteins (L-protein and RNA binding protein ␣-CP1), oxidoreduction-related proteins (non-selenium glutathione peroxidase and glutathione S-transferase homolog), signaling molecules (CPP32, transforming growth factor- receptor-binding protein and B-cell receptor-associated protein 32), energy metabolism-related enzymes (pyruvate ki-nase M2 (3 spots), triosephosphate isomerase, and GAPDH), cytoskeletal proteins (tropomyosin 5 and capping protein -subunit 2), and 2 putative and 3 unidentified proteins. Newly registered proteins involved in thermotolerance are mainly reducing enzymes and key enzymes of the glycolytic pathway including pyruvate kinase M2 and triosephosphate isomerase. The relationship between phosphorylation of these proteins and thermotolerance needs to be established in further studies. The second group of proteins showed increased phosphoryl-ation in control RIF-1 cells without heat shock, over TR-RIF-1 cells, and a significant increase in phosphorylation by heat shock appearing only in TR-RIF-1 cells. This suggests that phosphorylation of the second group of proteins may be re-quired for the signaling pathway in response to heat shock. Phosphorylated proteins in RIF-1 cells easily respond to heat shock. On the other hand, the reduced phosphorylation in TR-RIF-1 cells may induce the insensitivity and inhibit re-sponse to heat shock as shown previously (28). For example,
reduced phosphorylations of MAP kinase kinase in TR-RIF-1 cells may cause less activation of MAPK in response to heat shock than RIF-1 cells (data not shown). These studies have identified 20 proteins that are less phosphorylated in thermo-tolerant cells as heat shock signaling molecules.
The third group of proteins are phosphorylated by heat shock in both RIF-1 and TR-RIF-1 cells, although the extent and kinetics of phosphorylations in response to heat shock were different. These proteins may directly respond to heat shock and may be involved in heat shock signaling pathways regard-less of thermotolerance. This group of proteins may be func-tioning in transcription and translation (12 proteins) and in cell motility and structure (8 proteins). This is consistent with the finding that heat shock induces protein synthesis blockage and recovery (28), and cytoskeletal protein collapse and recovery (48) during recovery after heat shock. Intermediate filament vimentin modifications were identified in response to heat shock previously (48). Translocations of vimentin by various stresses were reported (49, 50).
The broad spectrum of protein phosphorylations observed during recovery after heat shock warrant investigations of the cellular processes in stress-induced cell death and thermotol-erance. However, it was impossible to examine many of the individual phosphorylated proteins experimentally. We em-ployed three computer-assisted programs to predict the phos-phorylation sites, possible PTKs involved, and binding proteins to be phosphorylated residues. Although each program has different stringency, some predictions common to two of the programs were noted. The results are consistent with the pre-vious findings for phosphorylation sites: Tyr-306 in hnRNP H (spot 11 and 12), tyrosine phosphorylation sites of Hsc70 (spot 1, 2), aldolase A isoform (spot 65), and lactate dehydrogenase A (spot 76). Scansite predictions allowed us to identify the possi-ble PTKs phosphorylating target proteins by heat shock. Al-though EGFR PTK phosphorylation sites were predicted only in 4 proteins (heat shock protein 70 cognate (spots 1 and 2), Hsp70, aldolase reductase) in this study, the results were in agreement with previous findings (14). c-Src activated in re-sponse to heat shock (14) may phosphorylate 5 substrate pro-teins (hnRNP F, 47-kDa heat shock protein, hnRNP A2/B1 (spots 72, 73, and 79), voltage-dependent anion channel 1) as predicted in this study. Tyrosine phosphorylation recognition motif containing molecules such as Grb2-SH2 and Shc-SH2 were predicted in 10 proteins (phosphoglycerate kinase (spots 63 and 64), MAP kinase kinase (spots 67– 69), hnRNP A2/B1 (spots 72, 73, and 79), topoisomerase inhibitor-suppressed (spot 78), similar to phosphoglycerate mutase 1) and 6 proteins (heat shock protein 70 cognate (spots 1 and 2), Hsp70, L-protein (spots 55 and 56), aldolase A (spot 65)), respectively. The acti-vation of the Shc-Grb2 pathway by heat shock was reported previously (43). It appears that PTKs or phosphotyrosine rec-ognition motifs that have been predicted in this study are likely to be involved in activated signal pathways by heat shock.
In summary, proteomic analysis combined with two-dimen-sional gel, Western blotting and mass spectrometry are power-ful tools for globally identifying the key molecules in heat shock signaling. This is the first comprehensive study to report on molecular phenomena in heat shock responses by combining high throughput proteomic analysis with kinetic studies and computer-assisted methodology. Further definition of the mo-lecular pathways involved in heat shock should provide a bet-ter understanding of heat-induced signaling pathways and the cellular mechanisms underlying thermotolerance.
Acknowledgments—We thank Dr. George M. Hahn for RIF-1 and
RIF-TR-1 cells and Dr. H. J. Kim at Hyundai Pharm. Ind. Co. for the use of MALDI-TOF-MS.
at Ewha Medical Library on March 29, 2017
http://www.jbc.org/
REFERENCES
1. Craig, E. A. (1985) CRC Crit. Rev. Biochem. 18, 239 –280 2. Lindquist, S. (1986) Annu. Rev. Biochem. 55, 1151–1191 3. Subjeck, J. R., and Shyy, T. T. (1986) Am. J. Physiol. 250, C1–C17 4. Lis, J., and Wu, C. (1992) in Transcriptional Regulation (McKnight, S. L., and
Yamamoto, K., eds) Vol. 2, pp. 907–930, Cold Spring Harbor Laboratory Press, Cold Spring Harbor, NY
5. Krishnan, H. B., and Pueppke S. G. (1987) Biochem. Biophys. Res. Commun. 148, 762–767
6. Landry, J., Crete, P., Lamarche, S., and Chretien, P. (1988) Radiat. Res. 113, 426 – 436
7. Maher, P. A., and Pasquale, E. B. (1989) J. Cell Biol. 108, 2029 –2035 8. Rouse, J., Cohen, P., Trigon, S., Morange, M., Alonso-Llamazares, A.,
Zamanillo, D., Hunt, T., and Nebreda, A. R. (1994) Cell 78, 1027–1037 9. Adler, V., Schaffer, A., Kim, J., Dolan, L., and Ronai, Z. (1995) J. Biol. Chem.
270, 26071–26077
10. Dubois, M. F., and Bensaude, O. (1993) FEBS Lett. 324, 191–195 11. Chen, F., Torres, M., and Duncan, R. F. (1995) Biochem. J. 312, 341–349 12. Bendinelli, P., Piccoletti, R., Maroni, P., and Bernelli-Zaerazz, A. (1995)
Bio-chem. Biophys. Res. Commun. 216, 54 – 62
13. Jurivich, D. A., Chung, J., and Blenis, J. (1991) J. Cell. Physiol. 148, 252–259 14. Lin, R. Z., Hu, Z. W., Chin, J. H., and Hoffman, B. B. (1997) J. Biol. Chem. 272,
31196 –31202
15. Erikson, R. L. (1991) J. Biol. Chem. 266, 6007– 6010
16. Stokoe, D., Engel, K., Campbell, D. G., Cohen, P., and Gaestel, M. (1992) FEBS Lett. 313, 307–313
17. Dubois, M. F., Bensaude, O., and Morange, M. (1991) C. R. Acad. Sci. (Paris) 313, 165–170
18. Legagneux, V., Morange, M., and Bensaude, O. (1990) Eur. J. Biochem. 193, 121–126
19. Glover, C. V., Vavra, K. J., Guttman, S. D., and Gorovsky, M. A. (1981) Cell 23, 73–77
20. Welch, W. J. (1987) Adv. Exp. Med. Biol. 225, 287–304
21. Duncan, R. F., and Hershey, J. W. (1989) J. Cell Biol. 109, 467– 481 22. Larson, J. S., Schuetz, T. J., and Kingston, R. E. (1988) Nature 335, 372–375 23. Sorger, P. K., and Pelham, H. R. (1988) Cell 54, 855– 864
24. Sarge, K. D., Murphy, S. P., and Morimoto, R. I. (1993) Mol. Cell. Biol. 13, 1392–1407
25. Hahn, G. M., and van Kersen, I. (1988) Cancer Res. 48, 1803–1807 26. Sechi, S., and Chait, B. T. (1998) Anal. Chem. 70, 5150 –5158 27. Quadroni, M., and James, P. (1999) Electrophoresis 20, 664 – 677 28. Kim, H. J., and Lee, K. J. (2002) Mol. Cell. Biochem. 229, 139 –151 29. Pype, S., Slegers, H., Moens, L., Merlevede, W., and Goris, J. (1994) J. Biol.
Chem. 269, 31457–31465
30. Reiss, N., Kanety, H., and Schlessinger, J. (1986) Biochem. J. 239, 691– 697 31. Bellagamba, C., Hubaishy, I., Bjorge, J. D., Fitzpatrick, S. L., Fujita, D. J., and
Waisman, D. M. (1997) J. Biol. Chem. 272, 3195–3199
32. Grima, D. T., Kandel, R. A., Pepinsky, B., and Cruz, T. F. (1994) Biochemistry 33, 2921–2926
33. Karasik, A., Pepinsky, R. B., Shoelson, S. E., and Kahn, C. R. (1988) J. Biol. Chem. 263, 11862–11867
34. Skouteris, G. G., and Schroder, C. H. (1996) J. Biol. Chem. 271, 27266 –27273 35. Otto, H., Dreger, M., Bengtsson, L., and Hucho, F. (2001) Eur. J. Biochem. 268,
420 – 428
36. Sygusch, J., Beaudry, D., and Allaire, M. (1990) Arch. Biochem. Biophys. 283, 227–233
37. Cooper, J. A., Esch, F. S., Taylor, S. S., and Hunter, T. (1984) J. Biol. Chem. 259, 7835–7841
38. Steen, H., Kuster, B., Fernandez, M., Pandey, A., and Mann, M. (2002) J. Biol. Chem. 277, 1031–1039
39. Valgeirsdottir, S., Claesson-Welsh, L., Bongcam-Rudloff, E., Hellman, U., Westermark, B., and Heldin, C. H. (1998) J. Cell Sci. 111, 1973–1980 40. Sheffield, L. G. (1998) J. Endocrinol. 159, 111–116
41. Erdos, G., Lee, Y. J., Cho, J. M., and Corry, P. M. (1995) J. Cell. Physiol. 164, 404 – 413
42. Lander, H. M., Levine, D. M., and Novogrodsky, A. (1992) Cell. Immunol. 145, 146 –155
43. Bendinelli, P., Piccoletti, R., Maroni, P., and Bernelli-Zaerazz, A. (1995) Bio-chem. Biophys. Res. Commun. 216, 54 – 61
44. Yang, J. M., Chin, K. V., and Hait, W. N. (1995) Biochem. Biophys. Res. Commun. 210, 21–30
45. Calderwood, S. K., Stevenson, M. A., and Price, B. D. (1993) J. Cell. Physiol. 156, 153–159
46. Kiang, J. G., and McClain, D. E. (1993) Am. J. Physiol. 264, C1561–C1569 47. Calderwood, S. K., and Stevenson, M. A. (1993) J. Cell. Physiol. 155, 248 –256 48. Lee, S. Y., Song, E. J., Kim, H. J., Kang, H. J., Kim, J. H., and Lee, K. J. (2001)
Cell Death Differ. 8, 1093–1102
49. Lutz, Y., Jacob, M., and Fuchs, J. P. (1988) Exp. Cell Res. 175, 109 –124 50. van der Houven van Oordt, W., Diaz-Meco, M. T., Lozano, J., Krainer, A. R.,
Moscat, J., and Caceres, J. F. (2000) J. Cell Biol. 149, 307–316 51. Knowlton, A. A., Grenier, M., Kirchhoff, S. R., and Salfity, M. (2000) Am. J.
Physiol. 278, H2143–H2149
52. Yanagida, M., Miura, Y., Yagasaki, K., Taoka, M., Isobe, T., and Takahashi, N. (2000) Electrophoresis 21, 1890 –1898
53. Marcus, K., Immler, D., Sternberger, J., and Meyer, H. E. (2000) Electrophore-sis 21, 2622–2636
54. Pepinsky, R. B. (1991) Methods Enzymol. 198, 260 –272
55. Soskic, V., Gorlach, M., Poznanovic, S., Boehmer, F. D., and Godovac-Zimmermann, J. (1999) Biochemistry 38, 1757–1764
at Ewha Medical Library on March 29, 2017
http://www.jbc.org/
Hee-Jung Kim, Eun Joo Song and Kong-Joo Lee
Thermotolerance
Proteomic Analysis of Protein Phosphorylations in Heat Shock Response and
doi: 10.1074/jbc.M201007200 originally published online March 8, 2002
2002, 277:23193-23207.
J. Biol. Chem.
10.1074/jbc.M201007200
Access the most updated version of this article at doi:
Alerts:
When a correction for this article is posted
•
When this article is cited
•
to choose from all of JBC's e-mail alerts
Click here
http://www.jbc.org/content/277/26/23193.full.html#ref-list-1
This article cites 55 references, 16 of which can be accessed free at
at Ewha Medical Library on March 29, 2017
http://www.jbc.org/