Contents lists available atScienceDirect
Nuclear Materials and Energy
journal homepage:www.elsevier.com/locate/nmeRF sheath modeling of experimentally observed plasma surface interactions
with the JET ITER-Like Antenna
A. Křivská
a,⁎, V. Bobkov
b, L. Colas
c, P. Dumortier
a,d, F. Durodié
a, P Jacquet
d, C.C. Klepper
e,
D. Milanesio
f, G. Urbanczyk
c, JET contributors
1aLaboratory for Plasma Physics, ERM/KMS, 30 Avenue de la Renaissance B-1000, Brussels, Belgium bMax-Planck-Institut für Plasmaphysik, D-85748 Garching, Germany
cIRFM CEA, Cadarache F-13108 Saint Paul lez Durance, France dCCFE, Culham Science Centre, Abingdon, Oxfordshire OX14 3DB, UK eOak Ridge National Laboratory, Oak Ridge, TN 37831-6169, USA fPolitecnico di Torino, Corso Duca degli Abruzzi 24, I-10129 Torino, Italy
A B S T R A C T
Waves in the Ion Cyclotron Range of Frequencies (ICRF) enhance local Plasma-Surface Interactions (PSI) near the wave launchers and magnetically-connected objects via Radio-Frequency (RF) sheath rectification. ITER will use 20MW of ICRF power over long pulses, questioning the long-term impact of RF-enhanced localized erosion on the lifetime of its Beryllium (Be) wall. Recent dedicated ICRF-heated L-mode discharges documented this process on JET for different types of ICRF antennas. Using visible spectroscopy in JET ICRF-heated L-mode discharges, poloidally-localized regions of enhanced (by ∼2–4x) Be I and Be II light emission were observed on two outboard limiters magnetically connected to the bottom of the active ITER-Like Antenna (ILA). The observed RF-PSI induced by the ILA was qualitatively comparable to that induced by the JET standard, type-A2 antennas, for similar strap toroidal phasing and connection geometries. The Be II line emission was found more intense when powering the bottom half of the ILA rather than its top half. Conversely, more pronounced SOL density modifications were observed with only top array operation, on field lines connected to the top half of the ILA. So far the near-field modeling of the ILA with antenna code TOPICA (Torino Polytechnic Ion Cyclotron Antenna), using curved antenna model, was partially able to reproduce qualitatively the observed phenomena. A quantitative discrepancy persisted between the observed Be source amplification and the calculated, corresponding increases in E//field at the magnetically connected locations to the ILA when changing from only top to only bottom half antenna operation. This paper revisits these current drive phased and half-ILA powered cases using for the new simulations flat model of the ILA and more realistic antenna feeding to calculate the E//field maps with TOPICA code. Further, the Self-consistent Sheaths and Waves for Ion Cyclotron Heating Slow Wave (SSWICH-SW) code, which couples slow wave evanescence with DC Scrape-Off Layer (SOL) biasing, is used to estimate the poloidal distribution of rectified RF-sheath Direct Current (DC) potential VDCin the private SOL between the ILA poloidal limiters. The approach so far was limited to correlating the observed, enhanced emission regions at the remote limiters to the antenna near-electric fields, as calculated by TOPICA. The present approach includes also a model for the rectification of these near-fields in the private SOL of the ILA. With the improved approach, when comparing only top and only bottom half antenna feeding, we obtained good qualitative correlation between all experimental measurements and the calculated local variations in the E//field and VDC potential.
1. Introduction
Waves in the Ion Cyclotron Range of Frequencies (ICRF) enhance local Plasma-Surface Interactions (PSI) near the wave launchers and magnetically-connected objects via Radio-Frequency (RF) sheath rec-tification. It is believed that the RF-PSI are mainly driven by parallel component of RF antenna electric near-field E//(parallel to confine-ment magnetic field of the tokamak) even though far-field RF sheaths may also contribute to RF-PSI interactions[1]. The first study where RF-PSI were observed spectroscopically in JET with ITER-like wall is presented in[2]. It shows that the RF-specific effect on the Be antenna
limiter moves around when the safety factor at 95% of the flux surface q95is swept. Also Earlier near-field simulations with slow wave only, e.g. [3] did compare well with experimental observations. For this reason our work is focused only on near-field E//. Progress in under-standing pointed to the dominant role of induced currents in the an-tenna box as a main source of anan-tenna E//fields[4]. E//field generates oscillations of voltages VRFacross a rectifying thin plasma boundary layers, called RF sheaths, where a line of the confinement magnetic field intercepts a conducting obstacle. Local sheath oscillations are subsequently rectified and lead to enhancement of the Direct Current (DC) plasma potentials VDC. The DC plasma biasing due to RF sheath
https://doi.org/10.1016/j.nme.2019.03.009
Received 2 August 2018; Received in revised form 1 March 2019; Accepted 5 March 2019 ⁎Corresponding author.
E-mail address:[email protected](A. Křivská).
1See the author list of “X. Litaudon et al. 2017 Nucl. Fusion 57 102001
Nuclear Materials and Energy 19 (2019) 324–329
Available online 14 March 2019
2352-1791/ © 2019 The Authors. Published by Elsevier Ltd. This is an open access article under the CC BY-NC-ND license (http://creativecommons.org/licenses/BY-NC-ND/4.0/).
rectification on the ICRF antenna structure can propagate along field lines over distances up to several meters away from the antennas. In[5] there is shown for both the ILA and one of the classic JET A2 antennas impacting Be erosion at distant limiters. The increased DC plasma po-tential accelerates ions that follow the confinement magnetic field lines, hit the obstacle and cause enhanced erosion[6]and localized heat flux. Plasma ExB convection also results from DC electric fields EDC= -grad⊥(VDC) arising from gradients in the DC potentials.
ITER will use 20MW of ICRF power over long pulses, raising con-cern over potential impact of RF-enhanced localized erosion on the lifetime of its actively-cooled Beryllium (Be) wall components. Recent, dedicated ICRF-heated L-mode discharges documented this process on JET for different types of ICRF antennas. Using visible spectroscopy, poloidally-localized regions of enhanced (by ∼ 2-4x) Be I and Be II light emission were observed on two outboard limiters magnetically con-nected to the bottom of the active ITER-Like Antenna (ILA)[2,7]. Se-quential toggling of the ICRF antennas combined with concurrent magnetic pitch-angle sweeping, consistently showed that these regions can be traced, via magnetic field-line connection, to regions of antici-pated high E// RF near-field at an antenna mouth. The Be II line emission was measured at K14 spot. It is horizontal, at outer wall di-rected at midplane, sightline #14 in charge-exchange recombination spectroscopy diagnostic. The Be II line emission was found more intense when powering the bottom half of the ILA rather than its top half. Conversely, more pronounced SOL density modifications were observed with lithium beam emission spectroscopy (Li-BES) system for only top array operation, on field lines connected to the top half of the ILA[5,8]. The observed RF-PSI induced by the ILA were qualitatively com-parable to those induced by the JET standard, type A2 antennas, for similar strap toroidal phasing and connection geometries[9,10]. For the type A2 antennas, the observed, enhanced, long-range RF-PSI effect was shown to be consistent with E// near-field A2-specific antenna modeling with code TOPICA (Torino Polytechnic Ion Cyclotron An-tenna)[11].
So far the near-field modeling of the ILA with TOPICA code, using curved antenna model, was partially able to reproduce qualitatively the enhancement of Be II light emission. A quantitative discrepancy per-sisted between the observed Be source amplification and the calculated, corresponding increases in E//field. The results showed increased E// fields at the area magnetically connected to K14 spot but there was no obvious difference in amplitude when changing from only top to only bottom half antenna operation. The experimental arrangement and results and indirect comparison with the calculated E//field maps are in detail described in[9]. This paper revisits these current drive-phased
and half-ILA powered cases using for the new simulations flat model of the ILA and improved modeling inputs and more realistic antenna feeding for calculation of the E//field maps with TOPICA code. Further, the Self-consistent Sheaths and Waves for Ion Cyclotron Heating Slow Wave (SSWICH-SW) code[12]is used to estimate poloidal distribution of RF-sheath DC potential in the private SOL between the poloidal limiters of the ILA. The present approach includes also a model for the rectification of these near-fields in the private SOL of the ILA. First si-mulations of the ILA curved model with SSWICH-SW code for various full antenna feeding were presented in [13]. With the improved ap-proach we obtain good qualitative correlation between all experimental measurements and the calculated local variations in the E//field and VDCpotential. This work helps to study the formation of RF sheaths around the antenna and magnetically connected objects.
2. Description of the simulations
The ILA was reinstalled for the 2015 JET experimental campaign [14]with ITER-like wall. It uses compact phased arrays of poloidal current straps to launch Fast Wave. Evanescent Slow Wave is excited parasitically. The ILA has successfully been operated with power den-sities up to 6.2 MW/m2on L-mode and 4.1 MW/m2on H-mode and voltages up to 42 kV[15]. Detailed description of the antenna system can be found in[16].
Calculation of E//field maps at the ILA mouth was performed with TOPICA code using improved modeling inputs and more realistic an-tenna feeding. In TOPICA code, the problem is separated into two parts. The antenna, which is assumed to be in vacuum, is treated in spatial domain, while the spectral domain is adopted to evaluate the interac-tion with plasma inside the toroidal chamber. Field continuity and boundary conditions allow formulating of a set of two coupled integral equations for the unknown equivalent current sources; then the equa-tions are reduced to a linear system by a method of moments solution scheme employing 2D finite elements defined over a 3D non-planar surface triangular-cell mesh. Accurate plasma modelling was obtained by coupling the plasma description of the FELICE code[17]to TOPICA. If the plasma boundary surface is curved a convenient geometrical ‘stretching’ is applied on it and the plasma is considered plane and transversely unbounded. Detailed code description can be found in [11].
To avoid possible errors related to dealing with a curved geometry, for the new simulations we used flat model of the ILA (Fig. 1a) with flat plasma boundary surface. It includes radially protruding limiters and side walls, which represent two Faraday screens of the adjacent A2 Fig. 1. a) Flat model of the ILA, b) side view (zoomed and elongated) with limiters and antenna frame, vacuum-plasma boundary is in black, first sur-face or E//calculations above the lim-iters is in blue, surface for E// calcula-tions between the limiters is in red (corresponding to x = 0 onFig. 5). (For interpretation of the references to color in this figure legend, the reader is re-ferred to the web version of this ar-ticle.)
antennas. The vacuum-plasma interface was placed 1 cm in front of the leading edge of the long poloidal limiters. First surface where we compute the E//field was defined in the vacuum region 5 mm behind the vacuum-plasma interface. Second surface for the E//field calcula-tions was placed between the poloidal limiters, 5 mm behind their leading edge and 3 mm above the leading edge of the antenna frame as sketched inFig. 1b. E//maps evaluated on the second surface were used as the main input to estimate distribution of the RF-sheath potential VDCin the private SOL between the poloidal limiters of the ILA. For this purpose we used the asymptotic version of the SSWICH-SW code with radiating boundary conditions, which couples slow wave evanescence with Direct Current (DC) Scrape-Off Layer (SOL) biasing. Only Slow waves, from a given TOPICA E//field map, propagate to plasma-facing boundaries in the launcher vicinity, cause sheath RF oscillations there. The code only includes a model for the rectification of these near-fields in the private SOL of the ILA, while measurements were performed in the free SOL. But from earlier simulations on Tore Supra[3]and ASDEX Upgrade[18]we expect similar poloidal structures of the DC potentials in the free and private SOL, despite smaller absolute values. Sketch of the simulation domain can be found in[8]. The SSWICH-SW code was chosen because it is suitable for relative comparisons of antenna designs and electrical settings. Main disadvantages are number of approxima-tions made on the original physical model. Parallel DC plasma con-ductivity is taken as infinite while transverse plasma concon-ductivity is neglected in the simplified model of DC plasma biasing.
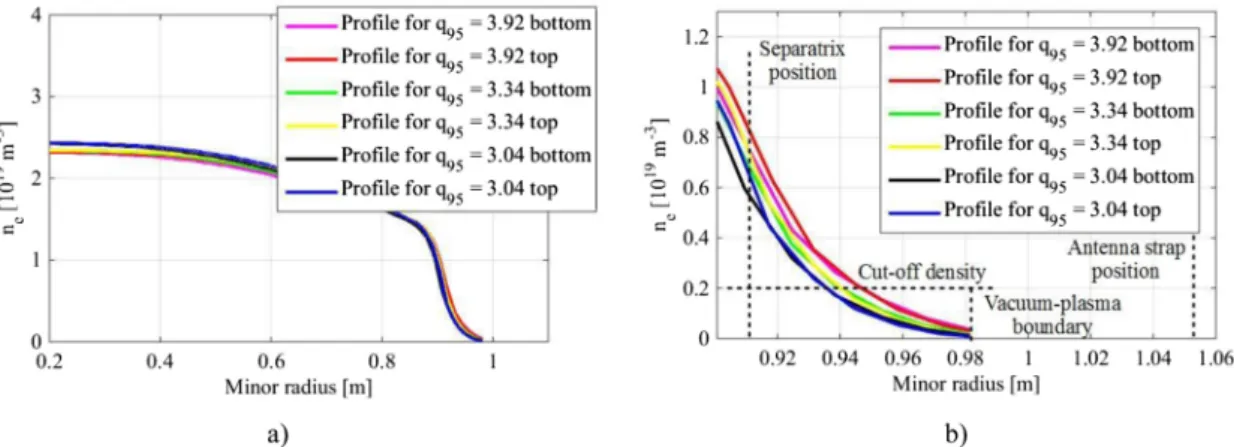
Compared to the previous work, new plasma kinetic profiles for L-mode JET pulse #90454 with varying safety factor at 95% of the flux surface q95from 3.04 to 3.92 were generated separately for top and bottom coordinates of the ILA. Plasma density profiles were measured with reflectometer and plasma temperature profiles were obtained with ECE Michelson interferometers (Fig. 2). For all the kinetic profiles the antenna-plasma radial outer gap distance was equal to 6 cm, central plasma density was around 3.35 × 10¹⁹ m−3 and central plasma temperature was 1.6 keV. Central static magnetic field was 2.5 T, 10° tilted with respect to the toroidal direction. In the simulations plasma geometry was assumed slab with temperature and density gradients along minor radius of the tokamak chamber. Simulations were per-formed for working frequency 42 MHz and minority heating scheme with 3.5% of hydrogen and 96.5% of deuterium.
The ILA is a complex 3D geometry object installed in the machine. The exact antenna dimensions and position were not known because of the manufacturing and mounting tolerances. For the antenna modeling, it is necessary to know the position of the plasma kinetic profiles w.r.t the antenna front face. Before running the new simulations presented here, an in-vessel survey was carried out and the exact actual position of top, middle and bottom part of the antenna in the machine was determined.
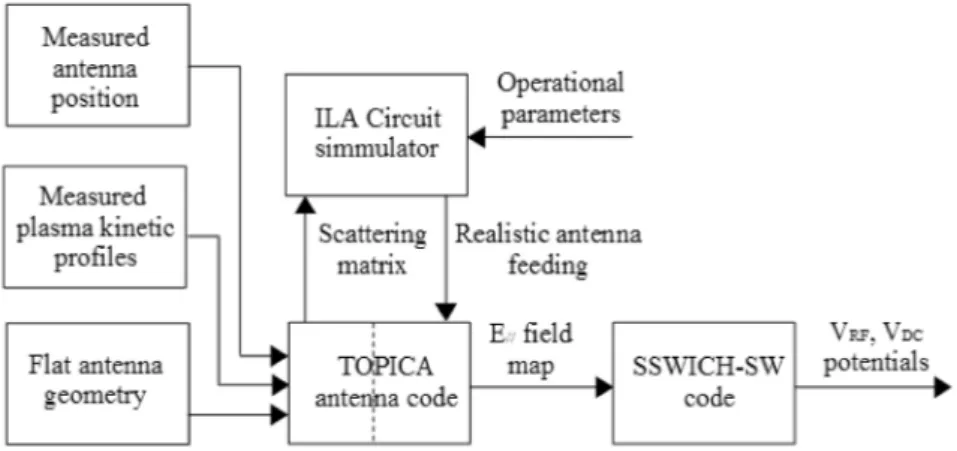
To determine the realistic antenna feeding voltages for given an-tenna scattering matrix and operational parameters, a fully compre-hensive circuit and simulation model for the ILA[19]has been im-plemented compared to the previous work. The antenna scattering matrix was obtained from numerical simulations by TOPICA taking into account the experimental kinetic profile in front of the antenna. This scattering matrix together with measured operational parameters such as the frequency, the power, the T-junction impedance and the phasing of the antenna are the input of the ILA circuit simulation programme used to evaluate the realistic antenna feeding. The realistic antenna feeding voltages for current drive strap phasing (0 −π/2), corre-sponding to measured coupled power to plasma, was applied for only top and only bottom half array of the antenna. The complete descrip-tion of the simuladescrip-tion process is summarized in the flow diagram shown inFig. 3.
3. Simulation results
3.1. Distribution of E//near field
Distributions of absolute value of E//near field calculated 5 mm in front of the leading edge of the poloidal limiters of the ILA with TOPICA code are presented inFig. 4. These results were obtained for kinetic profiles with q95= 3.34. The red dots show the area that is magneti-cally connected to K14 spot where the local Be II line emission was spectroscopically measured.Fig. 4a) shows E//field map for (0 −π/2) phasing, only top antenna feeding and coupled power to plasma
P = 550 kW. Increased E//fields are located along the poloidal limiters and the highest values are in the top part.Fig. 4b) shows E//field map for (0 −π/2) phasing, only bottom antenna feeding and coupled power to plasma P = 490 kW. Increased E//fields are located along the po-loidal limiters too but the peak values are in the bottom part. The field imbalance between the left and right side visible inFig. 4b) is due to larger imbalance in strap feeding voltages. In current drive operation there is 90° difference between the left and the right antenna straps and mutual coupling is high. Due to it the antenna system tends to be more sensitive to small differences in phasing and feeding voltages can be less balanced. During the experiment the feeding voltages were be less ba-lanced when operating only lower antenna half. The higher fields are assumed to be mainly due to image current densities circulating on the passive antenna limiters. At the area magnetically connected to K14 spot the maximum E//field is about 2x higher for only bottom than for only top feeding.
3.2. Distribution of RF-sheath DC potential
Radial-poloidal distribution of RF-sheath DC potential VDCin the
Fig. 2. a) Electron density profiles with varying q95that were measured during shot #90454 with reflectometer KG10 separately for top and bottom coordinates of the ILA. b) Detail of the edge density profiles.
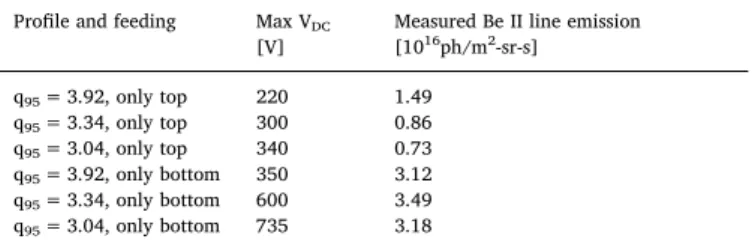
private SOL between the ILA poloidal limiters for (0 −π/2) phasing and only top and only bottom half array antenna feeding are depicted in Fig. 5. Potential VDCappears over the whole poloidal height of the side limiters, and not only in front of the radiating straps. Presented results were obtained for kinetic profiles with q95= 3.34. Table 1 shows maximum VDCat area magnetically connected to K14 spot and mea-sured Be II line emissions at K14 spot for all considered kinetic profiles and feeding. In all cases the potentials exceed the threshold for sput-tering Be with D+ions. The maximum VDCpotentials are by ∼1.6–2.2x higher for only bottom than only top antenna feeding. Greater Be II increase by ∼2–4x occurred when bottom half of ILA was powered rather than its top half. When comparing only top and only bottom half antenna feeding we obtained good qualitative correlation between all experimental measurements and the calculated local variations in and VDCpotential.
Fig. 6. presents 1D RF-sheath DC potential, averaged in radial di-rection, for (0 −π/2) phasing and both half array antenna feedings. The peak values of VDCpotentials are in poloidal direction from y = 0.7 m to y = 1.2 m for only top and from y = −0.7 m to y = −1.2 m for only bottom array feeding.
4. Conclusion and discussion
Distributions of E//near field and VDCpotential in the private SOL between the ILA poloidal limiters were calculated for (0 −π/2) phasing and half antenna feeding using the ILA flat model and improved rea-listic modeling inputs. Areas with increased values of E//fields and VDC potential were identified. For only top/only bottom feeding, the peak
E//and VDCvalues are not localized in front of the active straps but they are localized in the top/bottom part of the ILA poloidal limiters, re-spectively. Higher VDCpotential values were obtained for the kinetic profiles with lower q95. The maximum VDCpotentials at area magne-tically connected to K14 spot are by ∼1.6–2.2x higher for only bottom than only top antenna feeding. The Be II line emission measured at K14 spot (understood as local, RF sheath-enhanced erosion) was found by ∼2–4x more intense when powering the bottom half of the ILA rather than its top half. Further, more pronounced SOL density modifications were observed with Li-BES system for only top array operation, on field lines connected to the top half of the ILA. With the updated approach, when comparing only top and only bottom half antenna feeding, we obtained good qualitative correlation between all experimental mea-surements and the calculated local variations in the E//field and VDC potential. From all the new simulation inputs, it is usage of the flat model geometry what changed the spatial distributions of E//field and VDCpotential compared to the previous work.
Simulations made with the flat model geometry lead to results which are in better agreement with experiments than using the curved geometry even when we apply almost the same mesh density on the antenna model and the same plasma input parameters. The reasons are not fully clear and further investigations are ongoing. First possible reason could be related to mesh density which could become in-sufficient when the antenna geometry and the vacuum-plasma boundary surface are curved. This could lead to errors in simulation and part of other electric field component could be included to E// com-ponent during post-processing. This hypothesis could be tested by creating and simulating more simple and smaller curved and flat Fig. 3. Flow diagram of the complete description of the simulation process.
Fig. 4. Distribution of absolute values of E//field for (0 −π/2) phasing and a) only top and b) only bottom half array antenna feeding. The results were obtained for density profiles with q95= 3.34. Dashed lines: zones on antenna limiters connected magnetically to visible spectrometer spot K14 for q95= 3.92 (red) q95= 3.34 (white), q95= 3.04 (magenta). (For interpretation of the references to color in this figure legend, the reader is referred to the web version of this article.)
antenna models. Mesh density on the vacuum-plasma interface could be increased and influence on the results would be observed. So far in our simulations of the detailed ILA model, we applied the highest possible mesh density on the vacuum-plasma interface. This density is limited by the memory of the computing node on the supercomputer cluster.
Second possible explanation could be related to the stretching procedure implemented to couple 3D TOPICA with the 1D FELICE
plasma model, which may lead to an approximation error above all on the poloidal component, i.e. where the antenna curvature is stronger. Unfortunately, the only way to verify this is to couple a 3D plasma model (or even 2D with only poloidal density variation), which is currently not supported by TOPICA code. To overcome this limitation, the E//field of the ILA could be computed using other simulation tool such as RAPLICASOL (Radiofrequency wAve couPLing for Ion Cyclotron Antenna in Scrape-Off-Layer) [20]. It is a finite element solver for Maxwell's equations in the cold plasma approximation. It was recently extended to be able to handle 3D plasma density profiles[21]. All the presented calculations of VDC potentials were performed with asymptotic version of the SSWICH-SW code. Absolute values of VDCpotentials are probably over-estimated with the present calcula-tions, that do not allow for transverse transport of DC currents. Further, the radial extent of the density perturbation in front of the antenna limiters cannot be presently reproduced. In the next step we will use for simulations a more complete version of SSWICH-SW code[20]which includes finite DC transverse conductivity and allows to calculate the VDCpotentials not only between the antenna limiters but also in free SOL around the limiters and antenna central septum. We also plan to Fig. 5. Radial-poloidal distribution of RF-sheath DC potential for (0 −π/2) phasing and a) only top and b) only bottom half array antenna feeding. The results ware obtained for density profiles with q95= 3.34. x = 0 mm in the radial direction corresponds to location 5 mm behind the leading edge of the poloidal limiters (red line onFig. 1), x = 5 mm corresponds to the leading edge of the poloidal limiters. (For interpretation of the references to color in this figure legend, the reader is referred to the web version of this article.)
Table 1
Maximum VDCat antenna-limiter area magnetically connected to remote-lim-iter spot K14 and experimentally determined values from ref.[9]providing the average Be II emission at spot 14, when ILA is active.
Profile and feeding Max VDC
[V] Measured Be II line emission[1016ph/m2-sr-s] q95= 3.92, only top 220 1.49 q95= 3.34, only top 300 0.86 q95= 3.04, only top 340 0.73 q95= 3.92, only bottom 350 3.12 q95= 3.34, only bottom 600 3.49 q95= 3.04, only bottom 735 3.18
investigate how distributions of E//field and VDCpotential change with varying frequency, wall clearance and plasma parameters.
Conflict of interest
The authors declare that they have no known competing financial interests or personal relationships that could have appeared to influ-ence the work reported in this paper.
Acknowledgments
This work has been carried out within the framework of the EUROfusion Consortium and has received funding from the Euratom research and training programme 2014-2018 under grant agreement no 633053. The views and opinions expressed herein do not necessarily reflect those of the European Commission. This work has been carried out using Cineca's supercomputer system Marconi.
References
[1] R. Ochoukov, et al., Plasma Phys. Control. Fusion 56 (1) (2013) 015004.
[2] C.C. Klepper, J. Nucl. Mater 438 (2013) S594–S598. [3] J. Jacquot, Phys. Plasmas 21 (2014) 061509. [4] L. Colas, Nucl. Fusion 45 (2005) 767.
[5] L. Colas, et al., “2D Mappings of ICRF-induced SOL Density Modifications on JET”, proc. 45th EPS Conference on Plasma Physics, Prague, ECA Vol. 42A (2018) O4.101
http://ocs.ciemat.es/EPS2018PAP/pdf/O4.101.pdf. [6] C.C. Klepper, D. Borodin, Phys. Scr. T167 (2016) 014035. [7] C.C. Klepper, et al., Phys. Scripta T167 (2016) 0140352016. [8] V. Bobkov, et al., Nucler Materials and Energy 18 (2019) 131–140. [9] C.C. Klepper, et al., EPJ Web of Conferences, 157 2017, p. 03024. [10] P. Jacquet, et al., EPJ Web of Conferences, 157 2017, p. 02004. [11] V. Lancellotti, D. Milanesio, R. Maggiora, Nucl. Fusion 46 (2006) S476. [12] L. Colas, J. Jacquot, S. Heuraux, Phys. Plasmas 19 (2012) 092505. [13] A. Křivská, et al., EPJ Web of Conferences, 157 2017, p. 03026. [14] P. Dumortier, Fusion Eng. Des. 123 (2017) 285–288. [15] F. Durodié, Plasma Phys. Control. Fusion 54 (2012) 7. [16] F. Durodié, et al., Fusion Eng. Des. 74 (2005) 223–228. [17] M. Brambilla, Tech. Rep., IPP, (1992).
[18] A. Křivská, AIP Conference Proceedings 1689, 2015050002.
[19] F. Durodié, Proc. 20th Top. Conf on RF Power in Plasmas, AIP Conf. Proc. 1689, 2015070013.
[20] J. Jacquot, AIP Conference Proceedings, 1689 2015050008. [21] W. Tierens, et al., EPJ Web of Conferences, 157 2017, p. 03053.