Relative fat mass at baseline and its
early change may be a predictor
of incident nonalcoholic fatty liver
disease
Hwi Young Kim
1,6*, Su Jung Baik
2,6, Hye Ah Lee
3, Byoung Kwon Lee
2,4, Hye Sun Lee
5,
Tae Hun Kim
1& Kwon Yoo
1The relationship between changes in body components and the risk of nonalcoholic fatty liver disease (NAFLD) is not fully understood. We investigated the effects of body components and subsequent changes on incident NAFLD at follow-up ultrasound scanning in a longitudinal cohort. We included 9967 participants without NAFLD at baseline who underwent serial health examinations. Sex-specific, weight-adjusted skeletal muscle index (SMI_Wt) was used. Mean follow-up duration was
48.5 ± 33.5 months. NAFLD developed in 2395 participants (24.0%). Body composition was measured using bioelectrical impedance analysis. The following baseline body components were significantly associated with incident NAFLD: the lowest and middle SMI_Wt tertiles in the normal-weight group
(adjusted hazard ratio [aHR] = 2.20 and 1.54, respectively), and fat percentage in the normal-weight (aHR = 1.12), overweight (aHR = 1.05), and obese groups (aHR = 1.03) (all P < 0.05). Among 5,033 participants who underwent ≥ 3 health examinations, SMI_Wt increase between the first and second
examinations was an independent protective factor against incident NAFLD in non-obese groups (P < 0.05). Increased fat percentage was an independent risk factor for incident NAFLD in all weight categories (P < 0.05). High fat mass at baseline may be a better predictor of incident NAFLD than muscle mass. Reciprocal changes in fat and muscle mass during the first year of follow-up predicted incident NAFLD in non-obese groups.
Abbreviations
NAFLD Nonalcoholic fatty liver disease SMI Skeletal muscle index
BMI Body mass index aHR Adjusted hazard ratio FP Fat percentage FIB-4 Fibrosis score-4
APRI Aspartate aminotransferase-to-platelet ratio index HDL High-density lipoprotein T1 Lowest tertile T2 Middle tertile T3 Highest tertile CI Confidence interval Wt Body weight
MAFLD Metabolic dysfunction-associated fatty liver disease
OPEN
1Department of Internal Medicine, College of Medicine, Ewha Womans University, 1071, Anyangcheon-ro,
Yangcheon-gu, Seoul 07985, Republic of Korea. 2Healthcare Research Team, Health Promotion Center, Gangnam
Severance Hospital, Seoul, Republic of Korea. 3Clinical Trial Center, Ewha Womans University Medical Center,
Seoul, Republic of Korea. 4Division of Cardiology, Gangnam Severance Hospital Cardiovascular Center, Yonsei
University Health System, Seoul, Republic of Korea. 5Biostatistics Collaboration Unit, Medical Research Center,
Yonsei University College of Medicine, Seoul, Republic of Korea. 6These authors contributed equally: Hwi Young
Nonalcoholic fatty liver disease (NAFLD) is one of the most common causes of chronic liver diseases, repre-senting approximately 25% of global prevalence1. NAFLD is a spectrum of liver diseases related to metabolic
abnormalities, ranging from simple hepatic steatosis to nonalcoholic steatohepatitis with varying degrees of fibrosis, or even cirrhosis2. Patients with NAFLD have increased risks of hepatic or non-hepatic malignancies,
cardiovascular events, and increased mortality3.
Although obesity is a risk factor for NAFLD4, the relationship between body composition and NAFLD appears
complex. Incident NAFLD development is associated with insulin resistance and weight gain5. However, body
mass index (BMI) is an imperfect measurement of adiposity and metabolic abnormality that does not distin-guish between fat and muscle. Cut-off values of BMI to determine obesity differ for ethnic groups6. Moreover,
body composition cannot be readily predicted by BMI, given that similar BMI may represent variable degrees of visceral adiposity, which is known to predispose the development of NAFLD7.
Recent studies have shown that overweight and obesity in metabolically healthy individuals are associated with a greater risk of incident NAFLD than that in normal weight individuals8. Higher muscle mass showed an
inverse correlation with incident NAFLD, and increase in muscle mass suggested beneficial effects in NAFLD development9. Notwithstanding, the complex relationship between weight change (or body composition) with
time and NAFLD development has not been fully explored. In this study, we investigated the effects of baseline values and changes in body composition on the development of incident NAFLD in a longitudinal cohort.
Results
Baseline characteristics.
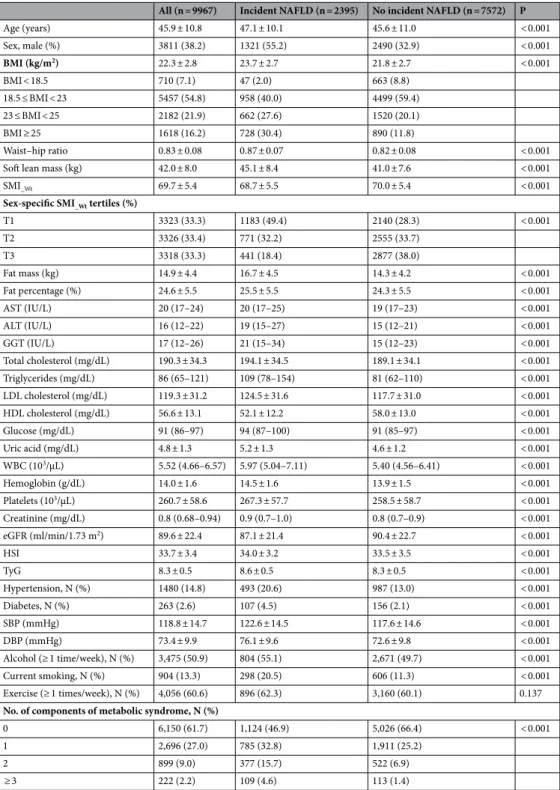
Overall, 9967 participants were included in the study (Fig. 1). The baseline char-acteristics of the study participants are summarized in Table 1. The mean age was 45.9 ± 10.8 years, and 6156 (61.8%) participants were men. The mean BMI was 22.3 ± 2.8 kg/m2. Study participants were categorizedaccord-ing to their BMI as underweight (n = 710, 7.1%), normal weight (n = 5457, 54.8%), overweight (n = 2182, 21.9%), and obese (n = 1618, 16.2%).
During follow-up (mean follow-up duration, 48.5 ± 33.5 months), incident NAFLD was observed in 2395 participants (24.0%; incident rate 59.4 per 1000 person-years). Participants with incident NAFLD were more frequently older (47.1 vs 45.6 years), were men (55.2% vs 32.9%), had higher baseline BMI (23.7 vs 21.8), and were more likely to have metabolic abnormalities (53.1% vs 33.6%) than those without NAFLD (all P < 0.001). In the study groups, incident NAFLD developed in 6.6%, 17.6%, 30.3%, and 45.0% of the underweight, normal weight, overweight, and obese groups, respectively (P < 0.001) (Table 1). Calculation of serum fibrosis indices in participants with incident NAFLD demonstrated that an absolute majority was classified as low risk for all indices including NAFLD fibrosis score (< − 1.455: n = 2393, 99.9%), fibrosis score-4 (FIB-4, < 1.3: n = 1852, 77.3%), and aspartate aminotransferase-to-platelet ratio index (APRI, < 0.5: n = 2108, 88.8%).
Relationships between baseline body composition parameters and incident NAFLD during
follow-up among BMI subgroups.
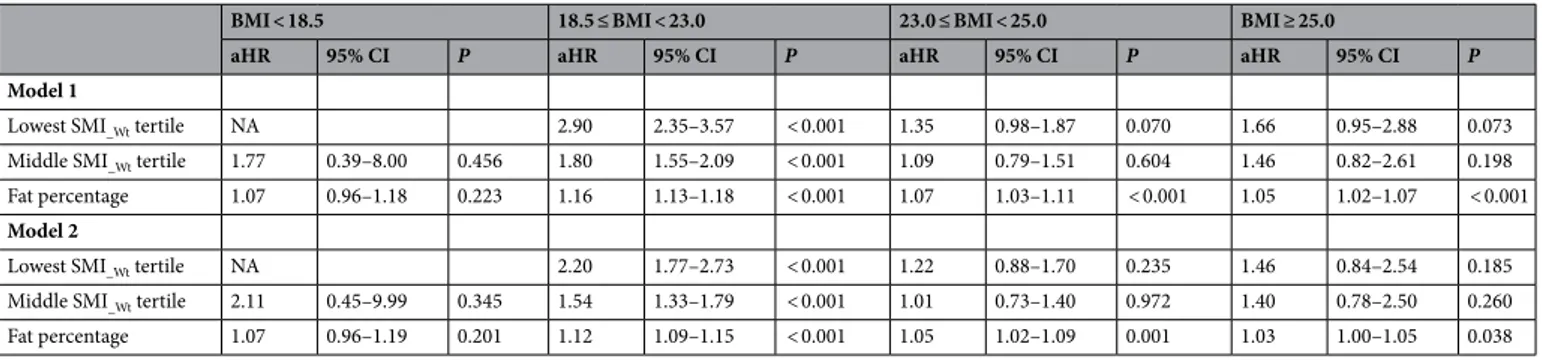
Given that baseline muscle and fat masses were significantly different among the subgroups according to BMI cut-off values (underweight, normal weight, overweight, and obese; Figure 1. Flowchart for patient selection.Supplementary Table S1), associations among baseline body composition parameters and incident NAFLD were investigated in each BMI subgroup using multivariate Cox regression analysis (Table 2).
Table 1. Baseline characteristics of the study subjects. Frequencies and percentages for categorical variables, mean ± standard deviations for continuous variables. NAFLD nonalcoholic fatty liver disease, BMI body mass index, SMI_Wt weight-adjusted skeletal muscle index, AST aspartate aminotransferase, ALT alanine
aminotransferase, GGT γ-glutamyl transpeptidase, LDL low-density lipoprotein, HDL high-density
lipoprotein, WBC white blood cell, eGFR estimated glomerular filtration rate, HSI hepatic steatosis index, TyG triglyceride-glucose index, SBP systolic blood pressure, DBP diastolic blood pressure, T1 lowest tertile, T2 middle tertile, T3 highest tertile.
All (n = 9967) Incident NAFLD (n = 2395) No incident NAFLD (n = 7572) P
Age (years) 45.9 ± 10.8 47.1 ± 10.1 45.6 ± 11.0 < 0.001 Sex, male (%) 3811 (38.2) 1321 (55.2) 2490 (32.9) < 0.001 BMI (kg/m2) 22.3 ± 2.8 23.7 ± 2.7 21.8 ± 2.7 < 0.001 BMI < 18.5 710 (7.1) 47 (2.0) 663 (8.8) 18.5 ≤ BMI < 23 5457 (54.8) 958 (40.0) 4499 (59.4) 23 ≤ BMI < 25 2182 (21.9) 662 (27.6) 1520 (20.1) BMI ≥ 25 1618 (16.2) 728 (30.4) 890 (11.8) Waist–hip ratio 0.83 ± 0.08 0.87 ± 0.07 0.82 ± 0.08 < 0.001
Soft lean mass (kg) 42.0 ± 8.0 45.1 ± 8.4 41.0 ± 7.6 < 0.001
SMI_Wt 69.7 ± 5.4 68.7 ± 5.5 70.0 ± 5.4 < 0.001
Sex-specific SMI_Wt tertiles (%)
T1 3323 (33.3) 1183 (49.4) 2140 (28.3) < 0.001 T2 3326 (33.4) 771 (32.2) 2555 (33.7) T3 3318 (33.3) 441 (18.4) 2877 (38.0) Fat mass (kg) 14.9 ± 4.4 16.7 ± 4.5 14.3 ± 4.2 < 0.001 Fat percentage (%) 24.6 ± 5.5 25.5 ± 5.5 24.3 ± 5.5 < 0.001 AST (IU/L) 20 (17–24) 20 (17–25) 19 (17–23) < 0.001 ALT (IU/L) 16 (12–22) 19 (15–27) 15 (12–21) < 0.001 GGT (IU/L) 17 (12–26) 21 (15–34) 15 (12–23) < 0.001 Total cholesterol (mg/dL) 190.3 ± 34.3 194.1 ± 34.5 189.1 ± 34.1 < 0.001 Triglycerides (mg/dL) 86 (65–121) 109 (78–154) 81 (62–110) < 0.001 LDL cholesterol (mg/dL) 119.3 ± 31.2 124.5 ± 31.6 117.7 ± 31.0 < 0.001 HDL cholesterol (mg/dL) 56.6 ± 13.1 52.1 ± 12.2 58.0 ± 13.0 < 0.001 Glucose (mg/dL) 91 (86–97) 94 (87–100) 91 (85–97) < 0.001 Uric acid (mg/dL) 4.8 ± 1.3 5.2 ± 1.3 4.6 ± 1.2 < 0.001 WBC (103/µL) 5.52 (4.66–6.57) 5.97 (5.04–7.11) 5.40 (4.56–6.41) < 0.001 Hemoglobin (g/dL) 14.0 ± 1.6 14.5 ± 1.6 13.9 ± 1.5 < 0.001 Platelets (103/µL) 260.7 ± 58.6 267.3 ± 57.7 258.5 ± 58.7 < 0.001 Creatinine (mg/dL) 0.8 (0.68–0.94) 0.9 (0.7–1.0) 0.8 (0.7–0.9) < 0.001 eGFR (ml/min/1.73 m2) 89.6 ± 22.4 87.1 ± 21.4 90.4 ± 22.7 < 0.001 HSI 33.7 ± 3.4 34.0 ± 3.2 33.5 ± 3.5 < 0.001 TyG 8.3 ± 0.5 8.6 ± 0.5 8.3 ± 0.5 < 0.001 Hypertension, N (%) 1480 (14.8) 493 (20.6) 987 (13.0) < 0.001 Diabetes, N (%) 263 (2.6) 107 (4.5) 156 (2.1) < 0.001 SBP (mmHg) 118.8 ± 14.7 122.6 ± 14.5 117.6 ± 14.6 < 0.001 DBP (mmHg) 73.4 ± 9.9 76.1 ± 9.6 72.6 ± 9.8 < 0.001 Alcohol (≥ 1 time/week), N (%) 3,475 (50.9) 804 (55.1) 2,671 (49.7) < 0.001 Current smoking, N (%) 904 (13.3) 298 (20.5) 606 (11.3) < 0.001 Exercise (≥ 1 times/week), N (%) 4,056 (60.6) 896 (62.3) 3,160 (60.1) 0.137 No. of components of metabolic syndrome, N (%)
0 6,150 (61.7) 1,124 (46.9) 5,026 (66.4) < 0.001
1 2,696 (27.0) 785 (32.8) 1,911 (25.2)
2 899 (9.0) 377 (15.7) 522 (6.9)
In the normal weight subgroup, participants in the lowest sex-specific, weight-adjusted skeletal muscle index (SMI_Wt) tertile (T1) were significantly associated with an increased adjusted hazard ratio (aHR = 2.20; 95%
confidence interval [CI], 1.77–2.73.; P < 0.001) for incident NAFLD after adjusting for age, sex, blood pressure, glucose, triglyceride, high-density lipoprotein (HDL), uric acid, and smoking status (Model 2, Table 2). Partici-pants in T2 (the middle SMI_Wt) were also significantly associated with an increased adjusted hazard ratio for
NAFLD (aHR = 1.54; 95% CI 1.33–1.79; P < 0.001) (Model 2, Table 2).
In the other BMI subgroups (underweight, overweight, and obese), low muscle mass was not significantly associated with NAFLD development. On the contrary, fat percentage (FP) was significantly associated with incident NAFLD in the normal weight (aHR = 1.12; 95% CI 1.09–1.15; P < 0.001), overweight (aHR = 1.05; 95% CI 1.02–1.09; P < 0.001), and obese (aHR = 1.03; 95% CI 1.00–1.05; P = 0.04) subgroups.
Figure 2 depicts the cumulative incidences of NAFLD according to SMI_Wt and FP tertiles. Participants in
the lowest tertile of SMI_Wt (T1) showed the highest risk for incident NAFLD, followed by those in the middle
and highest tertiles (Fig. 2a; P < 0.001 by log-rank test). Accordingly, participants in the highest tertile of FP had the highest risk for incident NAFLD, followed by those in the middle and lowest tertiles (Fig. 2b; P < 0.001 by log-rank test).
Among noninvasive fibrosis indices, NAFLD fibrosis score had a weak negative correlation with the baseline muscle mass and FIB-4 had a weak positive correlation with the baseline fat mass (Supplementary Table S2).
Development of incident NAFLD and its relationship with changes in clinical parameters
between first and second examinations.
Of the entire study population, 5033 participants under-went a health examination three or more times during the study period, with a median interval of 1.2 years (interquartile range 1.0–2.0) between the first and second examinations. Changes in body composition and clinical parameters between the first and second examinations are summarized in Table 3. Participants in the underweight and normal-weight groups showed increases in body weight and FP, with a decrease in SMI_Wt,whereas participants in the overweight and obese groups showed decreases in body weight, with no change or increase in SMI_Wt and no change or decrease in FP, respectively (all P < 0.001). In addition, significantly
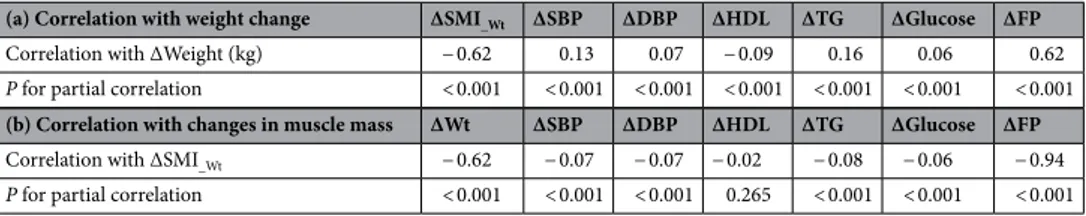
posi-tive correlations were observed between increased weight, between the first and second examinations (ΔWt), and harmful changes in metabolic parameters (increased systolic and diastolic blood pressures, triglyceride, and glucose levels, and decreased HDL cholesterol; all P < 0.001) (Table 4). We further investigated the associa-tion between changes in these parameters and incident NAFLD development in the 5033 participants (Table 5). Increase in SMI_Wt between the first and second examinations was an independent protective factor against
incident NAFLD in the underweight (aHR = 0.76; 95% CI 1.61–0.95; P = 0.015), normal-weight (aHR = 0.93; 95% CI 0.89–0.97; P = 0.002), and overweight groups (aHR = 0.90; 95% CI 1.84–0.96; P = 0.002) after adjustment for multiple covariates and baseline values. Moreover, FP increase was an independent risk factor for incident NAFLD in all weight categories (all P < 0.05).
Figure 3 depicts the cumulative incidences of NAFLD according to the tertiles of changes in SMI_Wt and FP.
Participants in the highest tertile of FP change showed the highest risk for incident NAFLD, followed by those in the middle and lowest tertiles (Fig. 3b; P = 0.01 by log-rank test). However, differences among the subgroups according to change in SMI_Wt tertiles were nonsignificant (Fig. 3a; P = 0.1 by log-rank test).
Assessment of the changes in body composition measurements showed no significant correlation with fibrosis indices (Supplementary Table S3).
Post hoc analysis: metabolic dysfunction-associated fatty liver disease as the alternative
out-come.
According to the recently proposed diagnostic criteria10, 1914 subjects were identified as metabolicdysfunction-associated fatty liver disease (MAFLD) out of 2395 subjects with NAFLD (79.9%). Unlike the over-weight and obese groups, the number of subjects was decreased 63.8% in the lean group (MAFLD, n = 17, vs NAFLD, n = 47) and 43.7% in the normal-weight group (MAFLD, n = 539, vs. NAFLD, n = 958). Associations between MAFLD development and low muscle mass/high FP at baseline were consistent with those on the Table 2. Baseline risk factors for incident NAFLD according to BMI categories. Model 1: adjusted for age, sex and smoking; Model 2: Model 1 and further adjusted for blood pressure, glucose, triglyceride, HDL and uric acid. BMI body mass index, aHR adjusted hazard ratio, CI confidence interval, SMI_Wt weight-adjusted skeletal
muscle index, HDL high- density lipoprotein.
BMI < 18.5 18.5 ≤ BMI < 23.0 23.0 ≤ BMI < 25.0 BMI ≥ 25.0
aHR 95% CI P aHR 95% CI P aHR 95% CI P aHR 95% CI P
Model 1
Lowest SMI_Wt tertile NA 2.90 2.35–3.57 < 0.001 1.35 0.98–1.87 0.070 1.66 0.95–2.88 0.073
Middle SMI_Wt tertile 1.77 0.39–8.00 0.456 1.80 1.55–2.09 < 0.001 1.09 0.79–1.51 0.604 1.46 0.82–2.61 0.198
Fat percentage 1.07 0.96–1.18 0.223 1.16 1.13–1.18 < 0.001 1.07 1.03–1.11 < 0.001 1.05 1.02–1.07 < 0.001 Model 2
Lowest SMI_Wt tertile NA 2.20 1.77–2.73 < 0.001 1.22 0.88–1.70 0.235 1.46 0.84–2.54 0.185
Middle SMI_Wt tertile 2.11 0.45–9.99 0.345 1.54 1.33–1.79 < 0.001 1.01 0.73–1.40 0.972 1.40 0.78–2.50 0.260
development of NAFLD (aHR for MAFLD = 3.05 [95% CI 2.29–4.07] vs aHR for NAFLD = 2.20 [95% CI 1.77– 2.73]) (Supplementary Table S4). However, in contrast to NAFLD, change in muscle mass was not significantly associated with the development of MAFLD in the low bodyweight group, and the effect was smaller in the nor-mal- weight group (aHR for MAFLD = 0.86 [95% CI 0.81–0.91] vs aHR for NAFLD = 0.93 [95% CI 0.89–0.97]) (Supplementary Table S5).
Figure 2. Kaplan–Meier curves for NAFLD-free survival according to weight-adjusted relative muscle and fat mass at baseline. (a) NAFLD-free survival according to sex-specific muscle mass tertiles. (b) NAFLD-free survival according to fat percentage tertiles. NAFLD nonalcoholic fatty liver disease, T1 lowest tertile, T2 middle tertile, T3 highest tertile.
Table 3. Changes in clinical parameters between baseline and follow-up examinations in subjects who underwent three or more health examinations (n = 5,033). BMI body mass index, SMI_Wt weight-adjusted
skeletal muscle index, FP fat percentage, SBP systolic blood pressure, DBP diastolic blood pressure, HDL high-density lipoprotein, TG triglyceride.
Changes in parameters BMI < 18.5 18.5 ≤ BMI < 23.0 23.0 ≤ BMI < 25.0 BMI ≥ 25.0 P ΔWeight (kg) 0.7 ± 1.5 0.3 ± 1.7 − 0.1 ± 2.1 − 0.5 ± 2.3 < 0.001 ΔSMI_Wt − 0.9 ± 2.1 − 0.4 ± 2.1 0.0 ± 2.2 0.3 ± 2.3 < 0.001 ΔFP (%) 0.8 ± 1.9 0.4 ± 1.8 0.0 ± 1.9 − 0.3 ± 2.0 < 0.001 ΔSBP (mmHg) − 0.2 ± 8.1 − 0.2 ± 10.0 − 1.6 ± 10.7 − 1.6 ± 10.9 < 0.001 ΔDBP (mmHg) − 0.1 ± 6.2 − 0.5 ± 6.5 − 1.0 ± 6.6 − 1.2 ± 6.7 0.012 ΔHDL (mg/dL) 0.2 ± 7.1 − 0.1 ± 6.5 0.0 ± 6.3 0.4 ± 5.9 0.230 ΔTG (mg/dL) 1.7 ± 26.5 3.4 ± 32.1 0.0 ± 39.6 − 2.5 ± 50.4 < 0.001 ΔGlucose (mg/dL) 1.3 ± 6.7 0.5 ± 7.9 0.9 ± 6.7 1.1 ± 10.7 0.081
Discussion
This population-based longitudinal study suggested that high baseline fat mass rather than muscle mass may be a better predictor for incident NAFLD across BMI categories in participants without NAFLD at baseline. Moreover, reciprocal changes in fat and muscle masses during the first year of follow-up also predicted incident NAFLD in the non-obese population. Both findings were significantly associated with NAFLD development after adjustment for metabolic parameters.
The incidence rate of NAFLD in the present study (59.4 per 1000 person-years) was comparable to the pooled incidence rates in Asia (50.9 per 1000 person-years) in a recent systematic review11. The incremental incidence
rates in subgroups with higher BMI categories reaffirmed the role of obesity in the development of NAFLD12.
However, because BMI is an imperfect marker of adiposity or body fat distribution13, decreased or excess
com-ponents of body composition at a given time and their changes with time were investigated to understand their roles in NAFLD development in various BMI categories. Low skeletal muscle mass has been suggested as a risk factor for NAFLD, considering the important role of skeletal muscles in insulin-mediated glucose disposal and secretion of myokines14,15.
Several recent studies have reported the relevance of sarcopenia as a risk factor for NAFLD, mostly in cross-sectional settings. According to a study based on a Korean nationwide survey, sarcopenia was independently associated with an increased prevalence of NAFLD defined by hepatic steatosis index score after adjusting for obesity or insulin resistance16. Other studies have also reported an association between low muscle mass and
NAFLD prevalence in cross-sectional settings17,18. Recently, a longitudinal retrospective cohort study from Korea
demonstrated that relative skeletal muscle mass at baseline was inversely associated with NAFLD development and positively associated with the resolution of NAFLD9. Because NAFLD incidence differed significantly among
different BMI subgroups in the present study, we explored risk factors for incident NAFLD among the four dif-ferent BMI subgroups. Consistent with former studies, the results of the present study for 9967 participants with at least two health examinations suggested associations between reduced relative muscle mass at baseline and incident NAFLD risk in the normal-weight group in a dose-dependent manner, after adjustment for multiple confounders.
Additionally, our results indicated that high baseline fat mass was a better predictor for incident NAFLD than low muscle mass in the normal-weight, overweight, and obese groups. From the Rotterdam study of a large population-based cohort, cross-sectional analysis showed that both high fat mass and low muscle mass were associated with NAFLD in normal-weight women (BMI < 25), whereas fat mass was a better predictor for NAFLD prevalence in both sexes19. Likewise, our results suggested that relative excess of fat mass predicted incident
NAFLD better in all study populations except in participants with BMI < 18.5, whereas low muscle mass was only significant in the normal-weight subgroup. In addition, changes between the first and second health examinations were investigated to identify their relationship with the development of NAFLD in participants who underwent three or more health checkups during the study period (n = 5033). Even in the case of relatively small changes in body weight, muscle mass, and fat mass between the first and second examinations, differences among the Table 4. Correlation between changes in metabolic parameters and changes in weight or body composition variables in subjects who underwent three or more health examinations. SMI_Wt weight-adjusted skeletal
muscle index, SBP systolic blood pressure, DBP diastolic blood pressure, HDL high-density lipoprotein, TG triglyceride, FP fat percentage, Wt body weight.
(a) Correlation with weight change ΔSMI_Wt ΔSBP ΔDBP ΔHDL ΔTG ΔGlucose ΔFP
Correlation with ΔWeight (kg) − 0.62 0.13 0.07 − 0.09 0.16 0.06 0.62
P for partial correlation < 0.001 < 0.001 < 0.001 < 0.001 < 0.001 < 0.001 < 0.001
(b) Correlation with changes in muscle mass ΔWt ΔSBP ΔDBP ΔHDL ΔTG ΔGlucose ΔFP
Correlation with ΔSMI_Wt − 0.62 − 0.07 − 0.07 − 0.02 − 0.08 − 0.06 − 0.94 P for partial correlation < 0.001 < 0.001 < 0.001 0.265 < 0.001 < 0.001 < 0.001
Table 5. Changes in body composition parameters and risk of incident NAFLD according to BMI categories. Model 1: adjusted for age, sex and baseline values; Model 2: Model 1 and further adjusted for changes in blood pressure, glucose, triglyceride, HDL and uric acid. BMI body mass index, aHR adjusted hazard ratio, CI confidence interval, SMI_Wt weight-adjusted skeletal muscle index, HDL high- density lipoprotein.
BMI < 18.5 18.5 ≤ BMI < 23.0 23.0 ≤ BMI < 25.0 BMI ≥ 25.0
aHR 95% CI P aHR 95% CI P aHR 95% CI P aHR 95% CI P
Model 1 ΔSMI_Wt 0.78 0.64–0.96 0.016 0.93 0.89–0.98 0.002 0.91 0.86–0.97 0.006 0.95 0.89–1.01 0.071 ΔFat percentage 1.48 1.19–1.86 0.001 1.10 1.05–1.16 < 0.001 1.16 1.07–1.25 < 0.001 1.10 1.03–1.18 0.005 Model 2 ΔSMI_Wt 0.76 0.61–0.95 0.015 0.93 0.89–0.97 0.002 0.90 0.84–0.96 0.002 0.95 0.89–1.01 0.094 ΔFat percentage 1.44 1.14–1.83 0.002 1.11 1.05–1.17 < 0.001 1.18 1.09–1.28 < 0.001 1.11 1.03–1.19 0.006
four BMI subgroups were significant concerning the direction of changes (Table 3). Table 4 shows that changes in weight were correlated with changes in body composition and metabolic abnormalities, that is, even a small amount of weight gain was associated with blood pressure elevation, serum glucose and triglyceride increases, and HDL cholesterol decrease in addition to reduced muscle mass and increased fat mass. These findings sug-gest an evolving process toward metabolic abnormalities in NAFLD development as in previous studies, which reported insulin resistance or low adiponectin in non-obese participants with NAFLD20,21.
Considering the small, but significant, reciprocal changes in muscle and fat mass accompanying weight changes in our study participants, we further explored the relationship between changes in body composition parameters and incident NAFLD risk. A significant increase in incident NAFLD risk was noted per percent increase in fat mass after adjustment for baseline values and other confounders in all BMI categories between the first and second examinations with a median interval of 1.2 years (Table 5). However, the degree of increase in incident NAFLD risk per percent decrease in muscle mass showed less robustness overall, as well as a non-significant association in the obese group. A recent single-center retrospective study from Korea reported that a progressive increase in fat mass and loss of muscle mass with aging was significantly associated with incident NAFLD, particularly in non-obese participants, between baseline and follow-up health examinations at 10 years22.
However, loss of muscle mass over a longer time period is an aging process23. Instead of evaluating the effect
of aging on NAFLD development, we focused on the effect of early changes in body composition from the perspective of NAFLD prevention. Studies have demonstrated the efficacy of lifestyle intervention in prevent-ing progression to diabetes in individuals with prediabetes, even compared with metformin24,25. Similarly, our
results show that if participants with unfavorable body composition at baseline achieve an increase in muscle mass and more importantly decrease in fat mass over a 1- or 2-year period, even small amounts of such changes can reduce the risk of future NAFLD.
Generally, Asians have proportionately higher body fat for a given BMI than people of other races26,27.
Non-obese Asian participants with NAFLD have a higher body fat content compared with those with comparable BMI without NAFLD28. Therefore, more robustness of fat mass compared with muscle mass in terms of NAFLD risk in
the present study must be validated in other populations, including those in the West. Although there have been Figure 3. NAFLD-free survival duration according to changes in weight-adjusted relative muscle and fat mass during follow-up. (a) NAFLD-free survival according to tertiles of changes in sex-specific muscle mass. (b) NAFLD-free survival according to tertiles of changes in fat percentage. NAFLD nonalcoholic fatty liver disease, T1 lowest tertile, T2 middle tertile, T3 highest tertile.
several Western studies on the relationship between body composition and NAFLD, which included advanced nonalcoholic steatohepatitis29,30, similar studies in a presumably healthy population are scarce, except for the
Rotterdam study19. Despite its cross-sectional design, the results of the Rotterdam study at least underscore the
relative importance of fat mass in NAFLD risk. Additionally, a recent randomized controlled trial from Hong Kong concluded that NAFLD remission was achieved with lesser weight reduction through lifestyle interven-tions in non-obese patients compared with obese patients31. The effect of fat mass and its changes on NAFLD
development, particularly in the non-obese participants of the present study, suggest common pathophysiologic processes to those in the Hong Kong study in which non-obese patients achieved NAFLD remission with a mod-est degree of weight reduction31.
Recently, an international expert consensus statement recommended an updated definition of MAFLD instead of NAFLD32. MAFLD may more accurately reflects current knowledge of fatty liver diseases associated with
metabolic dysfunction than NAFLD. When we applied MAFLD as the outcome, the change in muscle mass was not significantly associated with the development of MAFLD in the low bodyweight group and the effect was smaller in the normal-weight group. These results may have been affected by the smaller number of subjects in the lean group and normal-weight groups. However, the associations between MAFLD development and low muscle mass/high FP at baseline were consistent with the NAFLD results.
The present study had several limitations. First, NAFLD diagnosis was based on ultrasonography, instead of liver biopsy, which is the gold standard for the diagnosis of and severity assessment for NAFLD. Addition-ally, the use of ultrasonography for diagnosis raises concerns about possible misclassification bias of incident NAFLD diagnosis, which may weaken the associations found. However, recommending or performing liver biopsy in presumably healthy individuals could raise an ethical concern, considering that this study exclusively enrolled health checkup examinees. Second, the bioelectrical impedance analyzer used in this study was unable to determine the distribution (android or gynoid) of the fat mass, which is known to be related to metabolic abnormalities and NAFLD19,33. In addition, assessment of visceral adiposity, such as abdominal fat computed
tomography, was unavailable. Third, the database lacked information on muscle function, such as grip strength, which is one of the various aspects in the assessment of sarcopenia34. Fourth, noninvasive techniques for NAFLD
severity assessment, such as transient elastography, was not included in the health examination programs. Fifth, the present study included health checkup examinees from Korea, which may limit generalization of the results to other settings or ethnic groups with different cut-off values of BMI for obesity and different body composi-tion patterns27,35. Lastly, we were unable to assess the effect of genetic variants due to the study design (lack of
study samples). Recent genetic studies suggest a possible link between altered body composition and the devel-opment of NAFLD, for example, higher prevalence of patatin-like phospholipase domain-containing protein 3 (PNPLA3) [G] allele among non-obese individuals, an association between transmembrane 6 superfamily member 2 (TM6SF2) rs58542926 genotype and NAFLD that was independent of obesity, and interferon lambda 4 variant in non-obese nonalcoholic steatohepatitis20,36,37. More detailed studies are required to confirm the
mechanistic link among genetic factors, body composition, and the risk of NAFLD.
In summary, although low muscle mass at baseline was a significant predictor for incident NAFLD in indi-viduals with normal weight, high baseline fat mass predicted incident NAFLD in overweight and obese partici-pants, as well as in those with normal weight, in this large-scale population-based study. In addition, reciprocal changes in fat and muscle masses during the first year of follow-up predicted incident NAFLD in participants with BMI < 25 kg/m2. The results of the present study add to the rationale of lifestyle interventions to prevent
NAFLD development in individuals with high relative fat mass regardless of body habitus. Prospective valida-tion is warranted for a bidirecvalida-tional relavalida-tionship between NAFLD and fat mass, that is, the effect of changes in body composition on incident NAFLD development, as well as resolution/progression of preexisting NAFLD with lifestyle intervention.
Methods
Study subjects and follow-up.
In this study, 19,717 consecutive adult participants who had undergone a comprehensive health examination with two or more follow-up examinations between January 2007 and December 2018 at the Health Promotion Center of Gangnam Severance Hospital (Seoul, Korea) were included; some of the participants were offered health-screening examinations by their employers and the others vol-untarily participated in health evaluation follow-up programs. The information obtained in the questionnaire included frequency of drinking alcohol per week and average amounts of alcohol consumed at a time. Alcohol intake was calculated based on drinking frequency and the amount of alcohol per drink for alcoholic beverages. The exclusion criteria were (1) fatty liver by baseline ultrasound (n = 5953), (2) alcohol intake > 30 g/day for men and > 20 g/day for women (n = 1,724), (3) positive serology for hepatitis B surface antigen and/or hepatitis C anti-body (n = 796), (4) suspicious chronic liver disease (n = 130) or malignancy (n = 58) on baseline imaging stud-ies, and (5) missing data on anthropometric measurements, body composition analysis findings, or ultrasound results (n = 1089). Finally, 9967 participants were included in the study (Fig. 1). Informed consent was obtained from all participants and only de-identified data were used from the routine health screening. The study protocol was approved by the Institutional Review Board of Gangnam Severance Hospital (IRB No. 3-2016-0280). The study protocol conformed to the ethical guidelines of the World Medical Association Declaration of Helsinki.Diagnosis of NAFLD.
Abdominal ultrasonography was performed by seven experienced radiologists who were blinded to the clinical and laboratory characteristics of the study participants at the time of the exami-nation. The diagnosis of fatty liver was based on the presence of at least two ultrasonographic features: (1) a diffuse increase in the fine echoes of the liver parenchyma compared with the spleen or kidney parenchyma; (2) ultrasound beam attenuation; and (3) poorly visualized intrahepatic structures38. Serum fibrosis markerswere calculated for participants with incident NAFLD using laboratory values at the time of NAFLD diagnosis, including NAFLD fibrosis score, fibrosis score-4 (FIB-4), and aspartate aminotransferase-to-platelet ratio index (APRI)39–41.
The diagnosis of MAFLD was based on the evidence of hepatic steatosis (i.e., ultrasonographic fatty liver), in addition to one of the following three criteria: overweight/obesity (BMI ≥ 23 kg/m2), presence of type 2 diabetes
mellitus, or evidence of metabolic dysregulation10.
Clinical and laboratory assessments.
A standardized, self-administered questionnaire was used to col-lect information on demographic characteristics, smoking status, preexisting medical conditions, and medica-tion use. Height was measured to the nearest 0.1 cm using a stadiometer. Weight was measured to the nearest 0.1 kg and BMI was calculated as weight in kilograms divided by height in meters squared. The participants were categorized according to BMI based on the Korean Society for the Study of Obesity practice guidelines: underweight (BMI < 18.5), normal weight (18.5 ≤ BMI < 23), overweight (23 ≤ BMI < 25), and obese (BMI > 25)42.Blood samples were obtained following overnight fasting for 10–12 h. The laboratory tests included complete blood count, liver biochemistry, total cholesterol, triglycerides, high-density lipoprotein (HDL) cholesterol, glu-cose, hepatitis B surface antigen, and antibody to hepatitis C virus. Hypertension was defined as a systolic blood pressure ≥ 140 mmHg, diastolic blood pressure ≥ 90 mmHg, or current use of antihypertensives43. Diabetes was
defined as a fasting serum glucose ≥ 126 mg/dL or self-reported insulin or antidiabetic use44.
Measurement of body composition parameters.
Body composition was measured using bioelectrical impedance analysis through tissue conductivity (X-SCAN Plus, Jawon Medical Co., Seoul, Korea)45, accordingto the manufacturer’s instructions. Briefly, study participants avoided eating or drinking 8 h before measure-ment and drinking alcohol 24 h before measuremeasure-ment. They grasped the handles of the device and contacted the electrodes while standing for up to 5 min. Skeletal muscle index was defined as total skeletal muscle mass/ weight × 100, a modified formula according to the study of Janssen and colleagues34,46–48.
We divided participants using sex-specific, weight-adjusted SMI tertiles (SMI_Wt; T1, T2, and T3). The relative
proportion of body fat mass component was expressed as a percentage of total body weight49. Change in body
composition between the first and second health examinations was calculated by subtracting baseline SMI_Wt or
fat percentage (FP) from their corresponding values at the second health examination.
Statistical analysis.
Baseline characteristics are expressed as frequencies and percentages for categorical variables, and as mean ± standard deviations for continuous variables. Student’s t-test, χ2 test, and analysis ofvariance were used to compare variables. Variables with skewed distribution were converted to natural loga-rithms for further analysis. The Kaplan–Meier method was used to describe the cumulative incidence of NAFLD at follow-up ultrasound scanning, and the log-rank test was used for comparison. Covariate variables were selected through a stepwise method of Cox proportional hazards analysis, excluding duplicate indicators among the significant variables related to NAFLD in univariate analysis, and were considered in multivariate analysis. Multivariate-adjusted Cox proportional hazards analysis was used to determine the hazard ratio of NAFLD at follow-up according to relevant variables. All tests were based on two-sided probability, and P < 0.05 was consid-ered statistically significant. All analyses were performed using the SAS 9.4 (SAS Institute, Cary, NC, USA) and R 3.3.2 software packages (R Foundation for Statistical Computing, Vienna, Austria). R software (“survival” and “rms” packages) was used for the Kaplan–Meier analysis and survival plot.
Data availability
The data analyzed during the current study are available from the corresponding author on reasonable request. Received: 8 June 2020; Accepted: 6 October 2020
References
1. Younossi, Z. M. et al. Global epidemiology of nonalcoholic fatty liver disease-Meta-analytic assessment of prevalence, incidence, and outcomes. Hepatology 64, 73–84. https ://doi.org/10.1002/hep.28431 (2016).
2. European Association for the Study of the L, European Association for the Study of D & European Association for the Study of O. EASL-EASD-EASO clinical practice guidelines for the management of non-alcoholic fatty liver disease. J. Hepatol. 64, 1388–1402.
https ://doi.org/10.1016/j.jhep.2015.11.004 (2016).
3. Wong, V. W. et al. Coronary artery disease and cardiovascular outcomes in patients with non-alcoholic fatty liver disease. Gut 60, 1721–1727. https ://doi.org/10.1136/gut.2011.24201 6 (2011).
4. Subichin, M. et al. Liver disease in the morbidly obese: A review of 1000 consecutive patients undergoing weight loss surgery. Surg.
Obes. Relat. Dis. 11, 137–141. https ://doi.org/10.1016/j.soard .2014.06.015 (2015).
5. Zelber-Sagi, S. et al. Predictors for incidence and remission of NAFLD in the general population during a seven-year prospective follow-up. J. Hepatol. 56, 1145–1151. https ://doi.org/10.1016/j.jhep.2011.12.011 (2012).
6. Alberti, K. G., Zimmet, P., Shaw, J. & IDF Epidemiology Task Force Consensus Group. The metabolic syndrome—a new worldwide definition. Lancet 366, 1059–1062. https ://doi.org/10.1016/S0140 -6736(05)67402 -408 (2005).
7. Barreira, T. V., Broyles, S. T., Gupta, A. K. & Katzmarzyk, P. T. Relationship of anthropometric indices to abdominal and total body fat in youth: Sex and race differences. Obesity 22, 1345–1350. https ://doi.org/10.1002/oby.20714 (2014).
8. Chang, Y. et al. Metabolically healthy obesity and the development of nonalcoholic fatty liver disease. Am. J. Gastroenterol. 111, 1133–1140. https ://doi.org/10.1038/ajg.2016.178 (2016).
9. Kim, G. et al. Relationship between relative skeletal muscle mass and nonalcoholic fatty liver disease: A 7-year longitudinal study.
Hepatology 68, 1755–1768. https ://doi.org/10.1002/hep.30049 (2018).
10. Eslam, M. et al. A new definition for metabolic dysfunction-associated fatty liver disease: An international expert consensus state-ment. J. Hepatol. 73, 202–209. https ://doi.org/10.1016/j.jhep.2020.03.039 (2020).
11. Li, J. et al. Prevalence, incidence, and outcome of non-alcoholic fatty liver disease in Asia, 1999–2019: A systematic review and meta-analysis. Lancet Gastroenterol. Hepatol. 4, 389–398. https ://doi.org/10.1016/S2468 -1253(19)30039 -1 (2019).
12. Rinella, M. E. Nonalcoholic fatty liver disease: A systematic review published correction appears in JAMA. JAMA 313, 2263–2273.
https ://doi.org/10.1001/jama.2015.5370 (2015).
13. Cusi, K. Role of obesity and lipotoxicity in the development of nonalcoholic steatohepatitis: Pathophysiology and clinical implica-tions. Gastroenterology 142, 711–725. https ://doi.org/10.1053/j.gastr o.2012.02.003 (2012).
14. Bugianesi, E. et al. Insulin resistance in non-diabetic patients with non-alcoholic fatty liver disease: Sites and mechanisms.
Dia-betologia 48, 634–642. https ://doi.org/10.1007/s0012 5-005-1682-x (2005).
15. Pratesi, A., Tarantini, F. & Di Bari, M. Skeletal muscle: An endocrine organ. Clin. Cases Miner. Bone Metab. 10, 11–14. https ://doi. org/10.11138 /ccmbm /2013.10.1.011 (2013).
16. Lee, Y.-H. et al. Sarcopaenia is associated with NAFLD independently of obesity and insulin resistance: Nationwide surveys (KNHANES 2008–2011). J. Hepatol. 63, 486–493 (2015).
17. Hong, H. C. et al. Relationship between sarcopenia and nonalcoholic fatty liver disease: The Korean Sarcopenic Obesity Study.
Hepatology 59, 1772–1778. https ://doi.org/10.1002/hep.26716 (2014).
18. Moon, J. S., Yoon, J. S., Won, K. C. & Lee, H. W. The role of skeletal muscle in development of nonalcoholic Fatty liver disease.
Diabetes Metab. J. 37, 278–285. https ://doi.org/10.4093/dmj.2013.37.4.278 (2013).
19. Alferink, L. J. M. et al. Nonalcoholic fatty liver disease in the rotterdam study: About muscle mass, sarcopenia, fat mass, and fat distribution. J. Bone Miner. Res. 34, 1254–1263. https ://doi.org/10.1002/jbmr.3713 (2019).
20. Wei, J. L. et al. Prevalence and severity of nonalcoholic fatty liver disease in non-obese patients: A population study using proton-magnetic resonance spectroscopy. Am. J. Gastroenterol. 110, 1306–1314. https ://doi.org/10.1038/ajg.2015.235 (2015).
21. Feldman, A. et al. Clinical and metabolic characterization of lean caucasian subjects with non-alcoholic fatty liver. Am. J.
Gastro-enterol. 112, 102–110. https ://doi.org/10.1038/ajg.2016.318 (2017).
22. Lee, M. J. et al. Age-related decrease in skeletal muscle mass is an independent risk factor for incident nonalcoholic fatty liver disease: A 10-year retrospective cohort study. Gut Liver 13, 67–76. https ://doi.org/10.5009/gnl18 070 (2019).
23. Goodpaster, B. H. et al. The loss of skeletal muscle strength, mass, and quality in older adults: The health, aging and body composi-tion study. J. Gerontol. A Biol. Sci. Med. Sci. 61, 1059–1064. https ://doi.org/10.1093/geron a/61.10.1059 (2006).
24. Knowler, W. C. et al. Reduction in the incidence of type 2 diabetes with lifestyle intervention or metformin. N. Engl. J. Med. 346, 393–403. https ://doi.org/10.1056/NEJMo a0125 12 (2002).
25. Lindstrom, J. et al. Sustained reduction in the incidence of type 2 diabetes by lifestyle intervention: Follow-up of the Finnish Diabetes Prevention Study. Lancet 368, 1673–1679. https ://doi.org/10.1016/S0140 -6736(06)69701 -8 (2006).
26. Nazare, J. A. et al. Ethnic influences on the relations between abdominal subcutaneous and visceral adiposity, liver fat, and cardio-metabolic risk profile: The International study of prediction of intra-abdominal adiposity and its relationship with cardiocardio-metabolic risk/intra-abdominal adiposity. Am. J. Clin. Nutr. 96, 714–726. https ://doi.org/10.3945/ajcn.112.03575 8 (2012).
27. Alberti, K. G., Zimmet, P., Shaw, J. & Group, I. The metabolic syndrome—a new worldwide definition. Lancet 366, 1059–1062.
https ://doi.org/10.1016/S0140 -6736(05)67402 -8 (2005).
28. Das, K. et al. Nonobese population in a developing country has a high prevalence of nonalcoholic fatty liver and significant liver disease. Hepatology 51, 1593–1602. https ://doi.org/10.1002/hep.23567 (2010).
29. Petta, S. et al. Sarcopenia is associated with severe liver fibrosis in patients with non-alcoholic fatty liver disease. Aliment. Pharmacol.
Ther. 45, 510–518. https ://doi.org/10.1111/apt.13889 (2017).
30. Issa, D. et al. Presence of sarcopenia (muscle wasting) in patients with nonalcoholic steatohepatitis. Hepatology 60, 428–429. https ://doi.org/10.1002/hep.26908 (2014).
31. Wong, V. W. et al. Beneficial effects of lifestyle intervention in non-obese patients with non-alcoholic fatty liver disease. J. Hepatol. 69, 1349–1356. https ://doi.org/10.1016/j.jhep.2018.08.011 (2018).
32. Eslam, M., Sanyal, A. J. & Georgek, J. MAFLD. A consensus-driven proposed nomenclature for metabolic associated fatty liver disease. Gastroenterology 158, 1999–2014. https ://doi.org/10.1053/j.gastr o.2019.11.312 (2020).
33. Min, K. B. & Min, J. Y. Android and gynoid fat percentages and serum lipid levels in United States adults. Clin. Endocrinol. (Oxf.) 82, 377–387. https ://doi.org/10.1111/cen.12505 (2015).
34. Cruz-Jentoft, A. J. et al. Sarcopenia: Revised European consensus on definition and diagnosis. Age Ageing 48, 16–31. https ://doi. org/10.1093/agein g/afy16 9 (2019).
35. Heymsfield, S. B., Peterson, C. M., Thomas, D. M., Heo, M. & Schuna, J. M. Jr. Why are there race/ethnic differences in adult body mass index-adiposity relationships? A quantitative critical review. Obes. Rev. 17, 262–275. https ://doi.org/10.1111/obr.12358 (2016). 36. Liu, Y. L. et al. TM6SF2 rs58542926 influences hepatic fibrosis progression in patients with non-alcoholic fatty liver disease. Nat.
Commun. 5, 4309. https ://doi.org/10.1038/ncomm s5309 (2014).
37. Petta, S. et al. Interferon lambda 4 rs368234815 TT>δG variant is associated with liver damage in patients with nonalcoholic fatty liver disease. Hepatology 66, 1885–1893. https ://doi.org/10.1002/hep.29395 (2017).
38. Mathiesen, U. L. et al. Increased liver echogenicity at ultrasound examination reflects degree of steatosis but not of fibrosis in asymp-tomatic patients with mild/moderate abnormalities of liver transaminases. Dig. Liver Dis. 34, 516–522. https ://doi.org/10.1016/ s1590 -8658(02)80111 -6 (2002).
39. Angulo, P. et al. The NAFLD fibrosis score: A noninvasive system that identifies liver fibrosis in patients with NAFLD. Hepatology 45, 846–854. https ://doi.org/10.1002/hep.21496 (2007).
40. Vallet-Pichard, A. et al. FIB-4: An inexpensive and accurate marker of fibrosis in HCV infection comparison with liver biopsy and fibrotest. Hepatology 46, 32–36. https ://doi.org/10.1002/hep.21669 (2007).
41. Wai, C. T. et al. A simple noninvasive index can predict both significant fibrosis and cirrhosis in patients with chronic hepatitis C.
Hepatology 38, 518–526. https ://doi.org/10.1053/jhep.2003.50346 (2003).
42. Seo, M. H. et al. 2018 Korean society for the study of obesity guideline for the management of obesity in Korea. J. Obes. Metab.
Syndr. 28, 40–45. https ://doi.org/10.7570/jomes .2019.28.1.40 (2019).
43. 45Korean Society Hypertension (KSH) Hypertension Epidemiology Research Working Group., Kim, H.C. & Cho, M.C. Korea hypertension fact sheet. Clin Hypertens. 24, 13, doi:https ://doi.org/10.1186/s4088 5-018-0098-0 (2018).
44. Won, J. C. et al. Diabetes fact sheet in Korea, 2016: An appraisal of current status. Diabetes Metab. J. 42, 415–424. https ://doi. org/10.4093/dmj.2018.0017 (2018).
45. Lee, I. S., Shin, G. & Choue, R. A 12-week regimen of caloric restriction improves levels of adipokines and pro-inflammatory cytokines in Korean women with BMIs greater than 23 kg/m2. Inflamm. Res. 59, 399–405. https ://doi.org/10.1007/s0001 1-009-0113
(2010).
46. Cruz-Jentoft, A. J. et al. Sarcopenia: European consensus on definition and diagnosis: Report of the European Working Group on Sarcopenia in older people. Age Ageing 39, 412–423. https ://doi.org/10.1093/agein g/afq03 4 (2010).
47. Merriwether, E. N., Host, H. H. & Sinacore, D. R. Sarcopenic indices in community-dwelling older adults. J. Geriatr. Phys. Ther. 35, 118–125. https ://doi.org/10.1519/JPT.0b013 e3182 3c4be f (2012).
48. Buckinx, F. et al. Pitfalls in the measurement of muscle mass: A need for a reference standard. J. Cachexia Sarcopenia Muscle 9, 269–278. https ://doi.org/10.1002/jcsm.12268 (2018).
49. Zoico, E. et al. Physical disability and muscular strength in relation to obesity and different body composition indexes in a sample of healthy elderly women. Int. J. Obes. Relat. Metab. Disord. 28, 234–241. https ://doi.org/10.1038/sj.ijo.08025 52 (2004).
Acknowledgements
National Research Foundation of Korea (NRF) grant funded by the Ministry of Science and ICT (Grant no. 2018R1A5A2025286), and by a Korea Medical Institute research grant (2019).
Author contributions
Study conception and design by H.Y.K. and S.J.B.; data collection by H.Y.K. and S.J.B.; data analysis and inter-pretation by H.Y.K., S.J.B., H.A.L., B.K.L., H.S.L., T.H.K., and Y.K.; manuscript writing by H.Y.K. and S.J.B.; critical review, revision, and approval of the manuscript by H.Y.K., S.J.B., H.A.L., B.K.L., H.S.L., T.H.K., and Y.K.
Competing interests
The authors declare no competing interests.
Additional information
Supplementary information is available for this paper at https ://doi.org/10.1038/s4159 8-020-74659 -9. Correspondence and requests for materials should be addressed to H.Y.K.
Reprints and permissions information is available at www.nature.com/reprints.
Publisher’s note Springer Nature remains neutral with regard to jurisdictional claims in published maps and institutional affiliations.
Open Access This article is licensed under a Creative Commons Attribution 4.0 International License, which permits use, sharing, adaptation, distribution and reproduction in any medium or format, as long as you give appropriate credit to the original author(s) and the source, provide a link to the Creative Commons licence, and indicate if changes were made. The images or other third party material in this article are included in the article’s Creative Commons licence, unless indicated otherwise in a credit line to the material. If material is not included in the article’s Creative Commons licence and your intended use is not permitted by statutory regulation or exceeds the permitted use, you will need to obtain permission directly from the copyright holder. To view a copy of this licence, visit http://creat iveco mmons .org/licen ses/by/4.0/.