MRI Findings and Prediction of Time to Progression of Patients
with Hepatocellular Carcinoma Treated with Drug-eluting Bead
Transcatheter Arterial Chemoembolization
The purpose of this study was to investigate the utility of MRI findings after drug-eluting beads (DEB) - transcatheter arterial chemoembolization (TACE) for hepatocellular carcinoma in predicting time to progression (TTP). This study included 48 patients with 60 lesions who underwent liver MRI within 3 months after DEB-TACE. MRI was assessed for arterial enhancement pattern, late washout, arterioportal shunt, signal intensity on T2-weighted image, intratumoral septa, enhancing tissue on subtraction images, and treatment response. Cox-regression analysis was performed to identify independent factors to predict TTP. TTP was calculated using the Kaplan-Meier method with the log-rank test. Per lesion, 30 achieved complete remission, 22 had a partial response, and the remaining 8 lesions displayed stable disease on MRI. Arterial enhancement pattern, washout and enhancing tissue on subtraction images from MRI were associated with viable tumor on the last follow-up computerized tomography. Arterial enhancement, washout and enhancing tissue on subtraction images were significant predictors of TTP, but only enhancing tissue on subtraction images remained a significant predictor of TTP (P = 0.018) in the multivariate analysis. TTP was longer in the group without enhancing tissue on subtraction images compared to the group with enhancing tissue (601 days vs. 287 days,
P < 0.001). Enhancing tissue on subtraction images from MRI after DEB-TACE is predictive
for longer TTP.
Keywords: Transcatheter Arterial Chemoembolization; Drug-eluting Beads; Carcinoma, Hepatocellular; Magnetic Resonance Imaging; Subtraction Image
Seungsoo Lee,1 Kyung Ah Kim,2
Mi-Suk Park,1 and Sun Young Choi3
1Department of Radiology, Research Institute of
Radiological Science, Yonsei University, College of Medicine, Seoul; 2Department of Radiology, St.
Vincent’s Hospital, College of Medicine, The Catholic University of Korea, Seoul; 3Department of
Radiology and Medical Research Institute, School of Medicine, Ewha Womans University, Seoul, Korea Received: 16 January 2015
Accepted: 1 April 2015 Address for Correspondence: Kyung Ah Kim, MD
Department of Radiology, St. Vincent’s Hospital, the Catholic University of Korea, 93 Jungbu-daero, Paldal-gu, Suwon 442-723, Korea
Tel: +82.31-249-8496, Fax: +82.31-247-5713 E-mail: [email protected]
http://dx.doi.org/10.3346/jkms.2015.30.7.965 • J Korean Med Sci 2015; 30: 965-973
INTRODUCTION
Hepatocellular carcinoma (HCC) is the most common primary liver cancer and one of the common causes of cancer death (1). HCC can be cured through liver resection and liver transplanta-tion, but many patients are not eligible for surgery when diag-nosed. Transcatheter arterial chemoembolization (TACE) is a commonly used locoregional therapy for unresectable HCC in patients with preserved liver function. TACE is recommended for intermediate-stage HCC with multinodular disease and no vascular invasion or extrahepatic metastasis (2), but post-surgi-cal survival benefits remain controversial (3-6). Nevertheless, evidence suggests that chemoembolization improves survival in patients with unresectable HCC (7, 8). TACE with drug-elut-ing beads (DEB) was introduced, in which loaded drugs are de-livered to target lesions by a transcatheter approach, and the beads elute drugs at controlled and sustained doses for a pro-longed time. This approach allows higher and propro-longed intra-tumoral drug retention and low release of drug into systemic circulation (9-11). Previous study by Song et al. (12) reported that DEB-TACE showed better treatment response and delayed
tumor progression compared with conventional lipiodol-based TACE (cTACE). DEB-TACE is associated with decreased liver toxicity and fewer drug-related adverse events such as post-em-bolization syndrome or alopecia, allowing the use of higher dos-es of chemotherapeutic agents. Consequentially, DEB-TACE offers higher rates of complete response, objective response, and disease control compared to cTACE (12-15).
Multi-detector computed tomography (MDCT) and magnet-ic resonance imaging (MRI) are usually used to evaluate treat-ment response after cTACE or DEB-TACE. Imaging findings on computed tomography (CT) after DEB-TACE have been describ-ed for HCC (16), but MRI findings after DEB-TACE and the rela-tionship between MRI findings and time to progression have not been assessed fully. We evaluated MRI after DEB-TACE to see if there was a relationship between MRI findings and time to progression.
MATERIALS AND METHODS
Subjects
Between December 2009 and May 2012, 216 patients diagnosed Medical Imaging
with HCC according to the American Association for the Study of Liver Diseases practice guidelines were treated with DEB-TA-CE. Among them, patients were enrolled if they had liver MRI within 3 months after DEB-TACE. In total, 48 patients were in-cluded in the study.
DEB-TACE treatment protocol
Doxorubicin and DEB (DC Bead®, Biocompatibles, Surrey, UK)
amounts were chosen based on the extent of tumor burden. In this study, 2 or 4 mL of DEB with bead diameters ranging from 100 to 300 μm or 300 to 500 μm were loaded with doxorubicin according to manufacturer’s guidelines. The endpoint for em-bolization was stasis of blood flow in the arterial feeders to the tumor.
First follow-up MRI protocol
MRI examination was performed using two 3.0-T MR systems [(n = 42, Magnetom Tim Trio, Siemens Healthcare, Erlangen, Germany; n = 6, Achieva, Philips Medical Systems, Best, Neth-erlands)]. The imaging protocol for the Magnetom Tim Trio sys-tem included T1-weighted in-phase and out-of-phase images (TR, 150 ms; TE (in-phase/out-of-phase), 2.46 ms/ 1.23 ms; slice thickness, 6 mm; flip angle, 65°; ETL,1; matrix, 256×192; FOV, 370 mm; band width, 1,628 Hz/Px), a breath-hold T2-weighted spin echo sequence (T2WI) (TR, 1,600 ms; TE, 81 ms; slice thick-ness, 4 mm; flip angle, 140°; ETL, 11; matrix, 256×192; FOV, 370 mm; band width, 260 Hz/Px), and diffusion-weighted images (DWI) with b values of 50, 400, and 800 sec/mm2 (TR, 5,400 ms;
TE, 69 ms; slice thickness, 5 mm; flip angle, 90°; ETL, 1; matrix, 192×108; FOV, 370 mm; band width, 1,736 Hz/Px). Precontrast images were acquired with three-dimensional T1-weighted fat-suppressed gradient-echo images (T1WI) (TR, 2.54 ms; TE, 0.95 ms; slice thickness, 2 mm; flip angle, 13°; ETL, 1; matrix, 256×192; FOV, 370 mm; band width, 814 Hz/Px).
The imaging protocol for the Achieva MR system was similar: 3 Echo T1-weighted fast field-echo (TR, 218.97 ms; TE, 2.30 ms; slice thickness, 5 mm; flip angle, 20°; ETL, 3; matrix, 160×199; FOV, 370 mm; band width, 2,701 Hz/Px), a breath-hold fat-sup-pressed T2WI (TR, 1,000 ms; TE, 80 ms; slice thickness, 5 mm; flip angle, 90°; ETL, 75; matrix, 272×270; FOV, 370 mm; band width, 530 Hz/Px), DWI with b values of 50, 400, and 800 sec/ mm2 (TR, 1,612.8 ms; TE, 57.44 ms; slice thickness, 5 mm; flip
angle, 90°; ETL, 29; matrix, 112×108; FOV, 360 mm; band width, 2,157 Hz/Px), and precontrast images with three-dimensional T1-weighted fat-suppressed ultra-fast gradient-echo images (TR, 3.04 ms; TE, 1.44 ms; slice thickness, 4 mm; flip angle, 10°; ETL, 46; matrix, 256×258; FOV, 370 mm; band width, 723 Hz/ Px). The apparent diffusion coefficient (ADC) map from the DWI with three b values acquired from each magnet was made au-tomatically using commercially available software with a mo-no-exponential model.
Contrast agent was injected intravenously through a 20-gauge intravenous catheter placed into a peripheral vein, followed by a 20-mL saline flush at a rate of 2 mL/sec. Gadodiamide (n = 30; Omniscan; GE Healthcare, Oslo, Norway; 0.1 mM/kg) was used as the contrast material. After contrast injection, dynamic im-ages were obtained in four phases (arterial, portal, hepatic, and equilibrium) using the same sequence used for precontrast im-ages with 18-20 sec for acquisition time and 30 sec time inter-vals for each scan. The delay time for arterial phase imaging was determined using the MR fluoroscopic test bolus detection techni que. Subtraction images were acquired through post-im-aging processing that subtracted the precontrast image from the arterial phase image.
Last follow-up CT protocol
The last follow-up CT was defined as the last CT examination obtained before death or the first CT examination to find pro-gressive disease in this study. For follow-up CT examination, images were obtained with a 16-MDCT (Somatom Sensation 16, Siemens Healthcare, Forchheim, Germany) and a 64-MDCT scanner (Somatom Sensation 64, Siemens Healthcare, Erlan-gen, Germany and LightSpeed VCT, GE Health care, Milwau-kee, Wis). An unenhanced scan was obtained before adminis-tration of contrast media. All patients received a 2 mL/kg dose (total volume, < 150 mL) of nonionic contrast material (iopro-mide; Ultravist 300, Bayer Schering Pharma, Wayne, NJ). A late arterial phase scan was obtained with a delay of 18 sec after at-tenuation of the abdominal aorta reached 100 HU. Portal ve-nous and delayed phase imaging were obtained with a delay of 30 and 150 sec, respectively, after the end of the previous phase. Scanning parameters were as follows: 0.5-sec rotation time; 100-120 kV; 200-250 mAs; 0.6-mm beam collimation; beam pitch, 1; and 3-mm slice thickness.
Image analysis on first follow-up MRI and treatment response
Follow-up images were reviewed in consensus by two radiolo-gists with 6 and 5 yr of experience in abdominal imaging who did not perform the DEB-TACE and who were blinded to all clin-ical information except that all patients had undergone DEB-TACE. MRI images were reviewed in two sessions. Each image set (T2WI, precontrast T1WI, dynamic images involving arteri-al, portarteri-al, hepatic, and equilibrium phases, subtraction image, HBP and DWI images) was evaluated and the following docu-mented: (a) the pattern of arterial enhancement of treated tu-mor [no enhancement, peripheral rim enhancement, periph-eral nodular enhancement and solid enhancement (with en-hancement in whole or mainly tumor)]; (b) the presence of wash-out on late dynamic images involving portal, hepatic, and equi-librium phases; (c) the presence of an arterioportal (AP) shunt; (d) tumor signal intensity on T2WI using a three-grade scale:
hyperintense, isointense, and hypointense compared with sig-nal integrity of adjacent liver parenchyma; (e) the presence of intratumoral septa in the cystic or necrotic portion of the tumor (no septa, fine septa < 2 mm, or thick septa ≥ 2 mm); (f) ADC value of each tumor; (g) the presence of enhancing tissue on the subtraction image; and (h) treatment response according to the modified Response Evaluation Criteria in Solid Tumors (mRECIST). Treatment response of the target lesion according to mRECIST was evaluated as follows: complete response (CR), disappearance of any intratumoral arterial enhancement; par-tial response (PR), at least a 30% decrease in the sum of diame-ters of the viable (enhancement in the arterial phase) target le-sion, taking as reference the baseline sum of the diameters of the target lesion; stable disease (SD), any cases not meeting the definition for partial response; and progressive disease (PD), an increase of at least 20% in the sum of the diameters of the viable (enhancing) target lesion, taking as reference the smallest sum of the diameters of the viable (enhancing) target lesion record-ed since the start of treatment. Tumor treatment response was evaluated on the last follow-up CT according to mRECIST. Re-currence of the treated tumor after DEB-TACE was defined as arterial enhancement that was newly developed in the non-en-hancing portion of the treated tumor. Tumor recurrence was regarded as progressive disease.
Statistical analysis
The relationship between imaging findings on first follow-up MRI and detection of viable tumor on last follow-up CT was as-sessed using Pearson’s chi-squared test or Fisher’s exact test. A
P value less than 0.05 was considered to indicate a statistically
significant difference. A cut-off ADC value was calculated to differentiate treated lesions with or without viable tumor by ROC curve and the diagnostic performance of the ADC value to predict the presence of viable tumor tissue using this threshold was assessed. For the calculation of TTP, disease progression as defined by mRECIST was used as an end point. The time to progression was defined as the time between DEB-TACE data and the date of the imaging study that identified disease pro-gression among the follow-up imaging studies. Cox repro-gression univariate analysis was used to identify independent factors to predict TTP among age, gender, American Joint Committee on Cancer (AJCC) staging classification, Barcelona Clinic Liver Cancer (BCLC) staging classification, and MRI findings. Hazard ratio and 95% confidence intervals were calculated for each factor. Each factor that was statistically significant on univariate analysis was tested in multivariate models. TTP for significant factor on multivariate model was calculated using the Kaplan-Meier method and compared using the log-rank test. Statistical analyses were performed using SAS software version 9.2 (SAS. Cary, NC, USA).
Ethics statement
The study protocol was approved by the institutional review board of Severance Hospital (IRB No. 4-2014-0203). Informed consent was waived by the board.
RESULTS
Patient characteristics are summarized in Table 1. In total, the study included 36 men and 12 women with a mean age of 58 yr (age range, 35-77 yr) and 60 tumor nodules: 40 had one tumor lesion; 5 had two lesions; 2 had three lesions; and one had four lesions (36 nodules ≥ 3 cm and 24 nodules < 3 cm; mean size, 3.2 cm; range 1.0-14.5 cm). DEBs were 100-300 μm in 24 lesions, 300-500 μm in 31 lesions, and both 100-300 μm and 300-500 μm in 5 lesions. All patients had liver cirrhosis. The Child-Pugh class for liver function was class A in 43 patients (89.6%) and class B in 5 patients (8.3%). The most common etiology of liver cirrhosis was viral hepatitis B (36 patients, 75%). The AJCC stag-es were stage I in 13 (27.1%), stage II in 26 (54.2%), stage III in 6 (12.5%), and stage IV in 3 (6.2%) patients. The BCLC stages were stage 0 in 11 (22.9%), stage A in 17 (35.4%), stage B in 13 (27.1%), and stage C in 7 patients (14.6%). The mean interval between DEB-TACE treatment and follow-up MRI examination was 33.2 days (range, 21-61 days). The mean interval from the first DEB-TACE to the last follow-up CT was 16.1 months (range, 1-33.3 months). Twelve of the patients died during the follow-up peri-od. The causes of death were multi-organ failure in 1 patient and disease progression in 11 patients. Based on the first fol-Table 1. Baseline patient characteristics
Characteristics No. of patients (n = 48) Age (yr), mean (range) 58 (35-77) Sex Men Women 3612 Child-pugh class A B C 43 5 0 Risk factor of liver cirrhosis
HBV HCV Alcoholics 36 5 7 AJCC stage I II III A III B IV A 13 26 4 2 3 BCLC stage 0 A B C 11 17 13 7
HBV, hepatitis B virus; HCV, hepatitis C virus; AJCC, American Joint Committee on Cancer; BCLC, Barcelona Clinic Liver Cancer.
low-up MRI for each patient (n = 48), CR was achieved in 20 (41.7%), PR in 21 (43.8%), and SD in 7 (14.6%) patients. Table 2 shows a summary of the treatment responses per lesion accord-ing to mRECIST as evaluated on the first follow-up MRI and last follow-up CT. Based on the first follow-up MRI, CR was achieved in 30 (50.0%) lesions. Residual tumors were detected in 30 le-sions (50.0%), with PR in 22 (36.7%) and SD in 8 (13.3%) lele-sions. There was no case of progressive disease. In the assessment of treatment response for each lesion at last follow-up CT (n = 60), CR was achieved in 16 (26.7%), PR in 6 (10%), SD in 2 (3.3%) and PD in 36 lesions (60.0%) (Table 2).
Table 2. Treatment response per lesion on first MRI after DEB-TACE and last CT ac-cording to mRECIST
Treatment response First follow-up MRI Last follow-up CT
Complete response 30 16
Partial response 22 6
Stable disease 8 2
Progressive disease 0 36
mRECIST, modified Response Evaluation Criteria in Solid Tumors; DEB, drug-eluting bead; TACE, transarterial chemoembolization; HCC hepatocellular carcinoma.
Table 3. Imaging findings on first MRI after DEB-TACE and viable tumor per-lesion evaluated on last CT
Images No viable tumor Viable tumor P value Arterial enhancement None/rim shape Peripheral nodular/solid 4/11 1/0 3/1220/9 < 0.001* Washout Yes No 016 2420 < 0.001* AP shunt Yes No 9 7 2420 0.437 Signal intensity on T2 Hyper Iso/Hypo 13/1 2 35/4 5 0.999 Intratumoral septa None < 2 mm/ ≥ 2 mm 2/014 3/734 0.486 Enhancing tissue on subtraction image
Yes
No 016 3410
< 0.001*
Total 16 44
*P value is statistically significant. DEB, drug-eluting bead; TACE, transarterial che-moembolization; HCC hepatocellular carcinoma; AP, arterioportal; T2WI, T2-weighted image. A D B E C
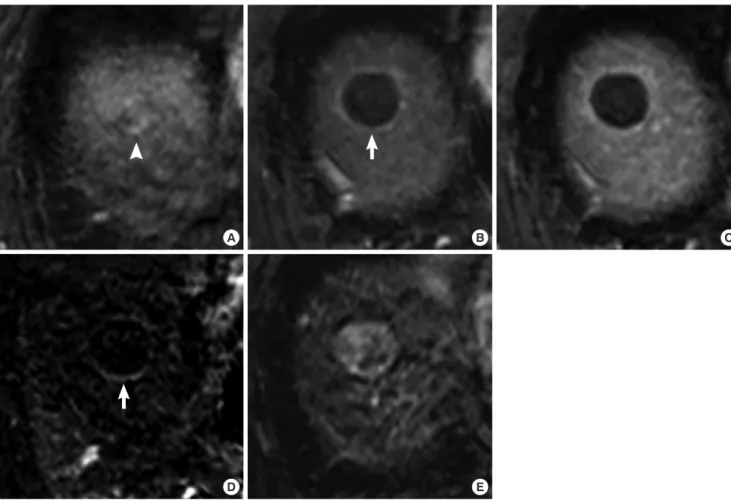
Fig. 1. A 61-yr-old man treated with DEB-TACE for HCC. (A) An arterial enhancing mass (white arrowhead) is noted on the MRI obtained before DEB-TACE. (B, C) The treated le-sion shows peripheral rim enhancement on arterial phase (white arrow) (B), and equilibrium phase (C) of axial fat-suppressed T1-weighted 3D GRE images in the follow-up MRI acquired 36 days after DEB-TACE. (D) Rim enhancement (white arrow) is identified as being more prominent on the subtraction image between the precontrast image and the arterial phase image. (E) The treated lesion shows high-signal intensity on T2-weighted image. Tumor response was determined as complete response on the first follow-up MRI.
Imaging findings on first follow-up MRI and viable tumor on last follow-up CT
Based on MRI image analysis of arterial enhancement patterns, seven target lesions were not enhanced on arterial phase and 23 lesions showed rim enhancement on arterial phase (Fig. 1) (Table 3). Peripheral nodular enhancement was depicted in 21 lesions (Fig. 2) and solid enhancement was observed in 9 le-sions. The last follow-up CT detected viable tumor tissue in three of 7 lesions with no arterial enhancement (42.9%) and 12 of 23 lesions with rim enhancement (52.2%). Viable tumor was iden-tified in 20 of 21 lesions with peripheral nodular enhancement (95.2%), and in all 9 target lesions with solid enhancement (100%). In other words, 29 among thirty target lesions with pe-ripheral nodular or solid enhancement pattern on arterial phase of first follow-up MRI also showed viable tumor tissue on the last follow-up CT. The presence of viable tumor was statistically different according to arterial enhancement pattern (no or rim shape enhancement vs. peripheral nodular or solid enhance-ment) (P < 0.001). Washout on portal or equilibrium phases
was found in 24 out of 60 target lesions, and viable tumor was detected on CT in all 24 lesions that showed washout on the late dynamic phase (100%) compared to 20 (55.6%) of the 36 le-sions without washout (P < 0.001). All 34 lele-sions with enhanc-ing tissue on subtraction images showed viable tumor tissue on the last follow-up CT (100%) (Fig. 3), compared to 10 (38.5%) of the 26 lesions with no enhancing tissue on subtraction images (P < 0.001). An AP shunt was found in 33 lesions. On T2WI, 7 lesions had high-signal, 48 had iso-signal, and 5 had low-signal intensity. Intratumoral septa were detected in 12 lesions (20%), 5 with thin and 7 with relatively thick septa. All 7 lesions with relatively thick septa and 3 of the 5 lesions with thin septa show-ed residual viable tumor. There was no difference in the pres-ence of viable tumor according to the prespres-ence of an AP shunt, signal intensity on T2WI, or intratumoral septa. The mean ADC value on the first follow-up MRI of target lesions with viable tu-mor tissue on the last follow-up CT (n = 44) was 1.607 ×10⁻³
mm2/sec, which was higher than that of lesions without viable
tumor tissue (1.576×10⁻³ mm2/sec) (n = 16). The cut-off value
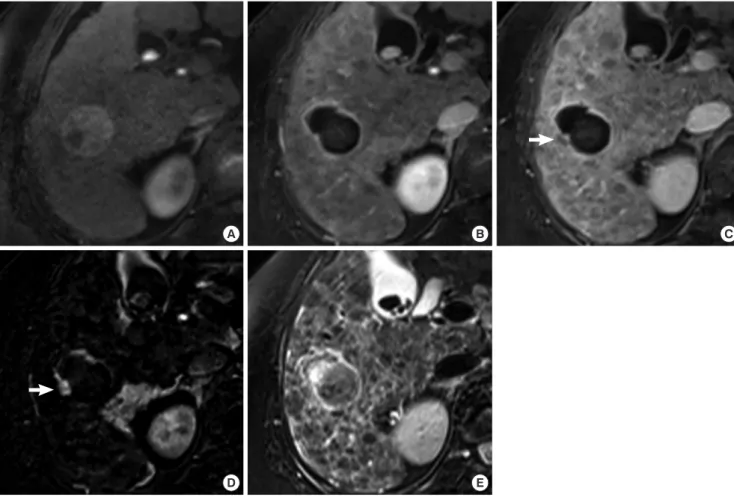
A D B E C F Fig. 2. A 68-yr-old man treated with DEB-TACE for HCC. (A) A large HCC with heterogeneous enhancement in the right lobe of the liver is noted on the arterial phase image of the CT obtained before DEB-TACE. (B-C) After DEB-TACE, near total necrosis is achieved in the tumor, but a small nodular portion with enhancement (white arrow) on arterial phase (B) and late washout on equilibrium phase (C) of axial fat-suppressed T1-weighted 3D GRE images remains in the periphery of the tumor on the follow-up MRI taken 30 days after TACE. (D) Arterial enhancement of the residual tumor (white arrow) is accentuated on the subtraction image. (E) The residual viable portion of tumor on T2-weighted image shows low signal intensity with peripheral dark rim (white arrow). (F) Treatment response of HCC after DEB-TACE was determined to be a partial response. Residual tu-mor with arterial enhancement increased on a follow-up CT taken 66 days after DEB-TACE.
calculated by ROC curve to differentiate treated lesions with or without tumor progression was 1.779 × 10⁻³ mm2/sec and the
diagnostic performance of the ADC value to predict tumor
pro-gression using this threshold showed a sensitivity of 79.6%, spec-ificity of 50%, and AUC of 0.583.
Time to progression
Univariate analysis using the Cox-regression test revealed that arterial enhancement (HR = 2.693, P = 0.004), presence of wash-out (HR = 3.168, P = 0.001) and enhancing tissue on subtrac-tion images (HR = 3.789, P = 0.001) were significant predictors of TTP (Table 4). Gender, age, tumor stages and other MRI find-ings such as the presence of an AP shunt, the presence of intra-tumoral septa, and signal intensity on T2WI were not significant Table 4. Univariate Cox-regression analysis of TTP after DEB-TACE according to
im-aging findings on the first MRI Factors Time to progression HR 95% CI Log-rank P value Gender 0.770 0.347-1.708 0.520 Age 1.012 0.973-1.053 0.539 AJCC 0.967 0.436-2.141 0.933 BCLC 1.204 0.612-2.37 0.591 Tumor size 1.044 0.936-1.164 0.441 Arterial enhancement 2.693 1.352-5.362 0.004* Washout 3.168 1.58-6.351 0.001* AP shunt 0.983 0.505-1.913 0.959 Intratumoral septa 1.672 0.776-3.602 0.190 Signal intensity on T2WI 0.774 0.189-3.159 0.308 Enhancing tissue on subtraction image 3.789 1.789-8.023 0.001* *P value is statistically significant. TTP, time to progression; DEB, doxorubicin-eluting bead; TACE, transarterial chemoembolization; CI, confidence interval; HR, hazard ra-tio; AJCC, American Joint Committee on Cancer; BCLC, Barcelona Clinic Liver Can-cer; AP, arterioportal; T2WI, T2-weighted image.
Table 5. Multivariate Cox-regression analysis of TTP after DEB-TACE according to imaging findings on the first MRI
Factors Time to progression HR 95% CI Log-rank P value Arterial enhancement 0.559 0.145-2.145 0.396 Washout 2.046 0.668-6.264 0.210
Enhancing tissue on subtraction image 3.953 1.271-12.291 0.018* *P value is statistically significant. TTP, time to progression; DEB, drug-eluting bead; TACE, transarterial chemoembolization; CI, confidence interval; HR, hazard ratio. Fig. 3. A 67-yr-old woman treated with DEB-TACE for HCC. (A) HCC is noted on the arterial phase image of the liver MRI acquired prior to treatment. (B) After DEB-TACE, an enhancing portion within the treated tumor is not detected on the arterial phase. (C) Meanwhile, subtle washout is suspected on the equilibrium phase of a follow-up MRI taken 30 days after DEB-TACE. (D) A small arterial enhancing portion is noted on the subtraction image. (E) Detecting residual tumor on axial T2-weighted image is difficult.
A
D
B
E
predictors of TTP. Based on the subsequent multivariate analy-sis, however, only enhancing tissue on subtraction images (HR = 3.953, P = 0.018) was a significant predictor for shorter TTP (Table 5). TTP was statistically longer without enhancing tissue on the subtraction image (601 days without vs. 287 days with,
P < 0.001). DISCUSSION
MDCT and MRI are useful imaging modalities for evaluating treatment response and predicting prognosis after TACE (17-22). In particular, evaluation of prognosis in diverse aspects have been investigated among diverse aspects beyond size criteria. Recently, radiologic CR achieved after first TACE on CT, EASL and mRECIST reponses, and ADC change relative to baseline on MRI have been reported as independent predictors for prog-nosis after TACE (17, 20, 21). Our study showed that imaging findings detected on the first follow-up MRI obtained after DEB-TACE for HCC can be used to predict TTP and the presence of viable tumor tissue on follow-up CT. Arterial enhancement, late washout, and enhancing tissue detected on subtraction images were significant imaging predictors for viable tumor on follow-up MRI and only enhancing tissue detected on subtraction im-ages was significant imaging predictor for TTP. Our findings are in agreement with other reports on imaging of target lesions af-ter cTACE that residual enhancement and washout of target le-sions are related to tumor recurrence, time to progression, and overall survival (5, 23). Chung et al. (16) found that progression of treated HCC was different according to arterial enhancement pattern on CT after DEB-TACE. This study also found that the presence of residual and recurrent tumor tissue on the last CT examination differed according to arterial enhancement pat-terns on the first follow-up MRI. The likelihood that viable tu-mor tissue will be detected during follow-up increases when the target lesion shows a peripheral nodular or solid enhance-ment pattern on the arterial phase of the first follow-up MRI. These imaging findings show directly viable tumor. Therefore, if these findings are detected on first follow-up MRI, immediate additional treatment and close follow-up are strongly recom-mended. Tumor recurrence was rare in treated lesions showing rim enhancement on arterial phase. The arterial enhancement pattern of rim enhancement may be associated with hyperemia or fibrosis rather than viable tumor or high possibility of tumor recurrence. It was impossible to classify signal intensities of DWI into a single group due to marked heterogeneity of DWI signal intensity for most lesions in this study although DWI has been reported a significant prognostic predictor after TACE. The di-agnostic performance of the ADC value for predicting tumor progression using calculated threshold was also not excellent. In this study, MRI subtraction images were the most helpful for predicting the presence of viable tumor on follow-up CT and
time to progression, more so than arterial phase images. The small arterial enhancing portion of an image, representing the residual viable tumor, can be accentuated on subtraction imag-es, allowing the subtraction image to facilitate the detection of small viable tumors that are difficult to distinguish. Subtraction images can help identify residual viable tumor tissue in mark-edly heterogenous masses or adjacent liver parenchyma dis-playing various signal intensity changes after DEB-TACE involv-ing necrosis, infarction, and hemorrhage, among others. When gadoxetic acid is used for MRI contrast, subtraction images may be helpful in detecting small residual tumors in some degraded images, due to the deleterious effect of gadoxetic acid on arteri-al phase image quarteri-ality (24).
Follow-up study after TACE is usually performed by CT. Lipi-odol accumulation within the tumor after cTACE with lipiLipi-odol can be seen as high attenuation on CT, which can make it diffi-cult to evaluate lipiodol uptake on MRI due to variable signal intensities of the lipiodol (25). In contrast, particles used in DEB-TACE do not affect attenuation or cause signal changes. Accor-dingly, MRI offers better contrast for soft tissues and higher spa-tial resolution with sensitivity than CT for the evaluation of tu-mor response after DEB-TACE (25).
Residual tumors that are nodular in shape with a smooth mar-gin at the inner surface of the treated tumor and nearly complete necrotic change (as shown in Fig. 2) are difficult to detect after cTACE with lipiodol, but are often detected after DEB-TACE, possibly due to the different characteristics of the embolic ma-terials in DEB-TACE. Gelfoam is prepared manually and arteri-al obstruction is heterogeneous and lasts less than 72 hr (15). Accordingly, cTACE with lipiodol enables more chemoperfu-sion than a real chemoembolization because the material can-not occlude the arterial tumor vessels completely or perma-nently (6). In addition, rapid separation of doxorubicin and lipi-odol, due to differences in hydrophilic properties, and coales-cence inside the infusion catheter or the blood vessel increases the droplet size in cTACE with lipiodol, compared to the con-trolled and sustained drug elution with DEB-TACE (26). In this study, we sometimes observed that residual arterial enhancing portions within the treated tumor, corresponding to viable tu-mor tissue, decreased during the initial few months of first and second imaging follow-up after DEB-TACE without additional treatment. We attributed these changes to sustained drug elu-tion after DEB-TACE. The smaller bead diameters of DEB-TACE also achieve a more distal embolization than in cTACE with lip-iodol, further obstructing collateral channels and necessitating superselective embolization (27). When small beads are used, extensive liquefactive and coagulative necrosis radiates out-wards from the centers of the DC bead clusters (27). A stronger anticancer effect in the area exposed to the drug with DEB-TACE could increase the extent of necrotic changes within the tumor, resulting in a clearer margin between the necrotic and viable
portions.
There were several limitations in this study. First, the study population was small. Second, we could not use histopatholog-ic evaluation as the gold standard for the viable tumor portion. Instead, we considered local recurrence of target lesions on fol-low-up imaging to indicate the presence of residual viable tu-mor after DEB-TACE. There is the possibility of tu-more false-neg-ative cases due to an insufficient follow-up period. Third, the windows of follow-up imaging after treatment were relatively wide, each within 3 months. A fixed and more precise scan time after treatment would have made the study more homogenous and comparable.
In conclusion, enhancing tissue on subtraction images from MRI after DEB-TACE was predictive for longer TTP.
DISCLOSURE
The authors declare there is no conflict of interest.
AUTHOR CONTRIBUTION
Conceived and designed the experiments: Kim KA, Park MS. Performed the experiments: Park MS, Choi SY. Analyzed the data: Kim KA, Lee S. Wrote the paper: Kim KA, Lee S. Agree with man-uscript results and conclusions: all authors.
ORCID
Seungsoo Lee http://orcid.org/0000-0002-6268-575X Kyung Ah Kim http://orcid.org/0000-0002-8982-5433 Mi-Suk Park http://orcid.org/0000-0001-5817-2444 Sun Young Choi http://orcid.org/0000-0003-2488-1183
REFERENCES
1. Kim KA, Kim MJ, Choi JY, Chung YE. Development of hepatocellular carcinomas in patients with absence of tumors on a prior ultrasound ex-amination. Eur J Radiol 2012; 81: 1450-4.
2. Lencioni R. Chemoembolization for hepatocellular carcinoma. Semin Oncol 2012; 39: 503-9.
3. Pelletier G, Roche A, Ink O, Anciaux ML, Derhy S, Rougier P, Lenoir C, Attali P, Etienne JP. A randomized trial of hepatic arterial chemoemboli-zation in patients with unresectable hepatocellular carcinoma. J Hepa-tol 1990; 11: 181-4.
4. Lin DY, Liaw YF, Lee TY, Lai CM. Hepatic arterial embolization in pa-tients with unresectable hepatocellular carcinoma--a randomized con-trolled trial. Gastroenterology 1988; 94: 453-6.
5. Llovet JM, Real MI, Montaña X, Planas R, Coll S, Aponte J, Ayuso C, Sala M, Muchart J, Solà R, et al. Arterial embolisation or chemoembolisation versus symptomatic treatment in patients with unresectable hepatocel-lular carcinoma: a randomised controlled trial. Lancet 2002; 359: 1734-9. 6. Marelli L, Stigliano R, Triantos C, Senzolo M, Cholongitas E, Davies N,
Tibballs J, Meyer T, Patch DW, Burroughs AK. Transarterial therapy for hepatocellular carcinoma: which technique is more effective? A system-atic review of cohort and randomized studies. Cardiovasc Intervent Ra-diol 2007; 30: 6-25.
7. Llovet JM, Bruix J. Systematic review of randomized trials for unresect-able hepatocellular carcinoma: Chemoembolization improves survival. Hepatology 2003; 37: 429-42.
8. Lo CM, Ngan H, Tso WK, Liu CL, Lam CM, Poon RT, Fan ST, Wong J. Randomized controlled trial of transarterial lipiodol chemoemboliza-tion for unresectable hepatocellular carcinoma. Hepatology 2002; 35: 1164-71.
9. Sottani C, Poggi G, Quaretti P, Regazzi M, Montagna B, Quaquarini E, Imbriani M, Leoni E, Di Cesare P, Riccardi A, et al. Serum pharmacoki-netics in patients treated with transarterial chemoembolization (TACE) using two types of epirubicin-loaded microspheres. Anticancer Res 2012; 32: 1769-74.
10. Jordan O, Denys A, De Baere T, Boulens N, Doelker E. Comparative study of chemoembolization loadable beads: in vitro drug release and physi-cal properties of DC bead and hepasphere loaded with doxorubicin and irinotecan. J Vasc Interv Radiol 2010; 21: 1084-90.
11. Lee KH, Liapi EA, Cornell C, Reb P, Buijs M, Vossen JA, Ventura VP, Ge-schwind JF. Doxorubicin-loaded QuadraSphere microspheres: plasma pharmacokinetics and intratumoral drug concentration in an animal model of liver cancer. Cardiovasc Intervent Radiol 2010; 33: 576-82. 12. Song MJ, Chun HJ, Song do S, Kim HY, Yoo SH, Park CH, Bae SH, Choi
JY, Chang UI, Yang JM, et al. Comparative study between doxorubicin-eluting beads and conventional transarterial chemoembolization for treatment of hepatocellular carcinoma. J Hepatol 2012; 57: 1244-50. 13. Sacco R, Bargellini I, Bertini M, Bozzi E, Romano A, Petruzzi P, Tumino
E, Ginanni B, Federici G, Cioni R, et al. Conventional versus doxorubi-cin-eluting bead transarterial chemoembolization for hepatocellular carcinoma. J Vasc Interv Radiol 2011; 22: 1545-52.
14. Lammer J, Malagari K, Vogl T, Pilleul F, Denys A, Watkinson A, Pitton M, Sergent G, Pfammatter T, Terraz S, et al.; PRECISION V Investigators. Prospective randomized study of doxorubicin-eluting-bead emboliza-tion in the treatment of hepatocellular carcinoma: results of the PRECI-SION V study. Cardiovasc Intervent Radiol 2010; 33: 41-52.
15. Burrel M, Reig M, Forner A, Barrufet M, de Lope CR, Tremosini S, Ayu-so C, Llovet JM, Real MI, Bruix J. Survival of patients with hepatocellu-lar carcinoma treated by transarterial chemoembolisation (TACE) using Drug Eluting Beads. Implications for clinical practice and trial design. J Hepatol 2012; 56: 1330-5.
16. Chung WS, Lee KH, Park MS, Lee YJ, Kwon J, Baek SE, Kim MJ. Enhance-ment patterns of hepatocellular carcinoma after transarterial chemoem-bolization using drug-eluting beads on arterial phase CT images: a pilot retrospective study. AJR Am J Roentgenol 2012; 199: 349-59.
17. Kim BK, Kim SU, Kim KA, Chung YE, Kim MJ, Park MS, Park JY, Kim DY, Ahn SH, Kim MD, et al. Complete response at first chemoemboliza-tion is still the most robust predictor for favorable outcome in hepatocel-lular carcinoma. J Hepatol 2015.
18. Kamel IR, Bluemke DA. Magnetic resonance imaging of the liver: assess-ing response to treatment. Top Magn Reson Imagassess-ing 2002; 13: 191-200. 19. Chapiro J, Wood LD, Lin M, Duran R, Cornish T, Lesage D, Charu V,
Sch-ernthaner R, Wang Z, Tacher V, et al. Radiologic-pathologic analysis of contrast-enhanced and diffusion-weighted MR imaging in patients with
HCC after TACE: diagnostic accuracy of 3D quantitative image analysis. Radiology 2014; 273: 746-58.
20. Vandecaveye V, Michielsen K, De Keyzer F, Laleman W, Komuta M, Op de beeck K, Roskams T, Nevens F, Verslype C, Maleux G. Chemoemboli-zation for hepatocellular carcinoma: 1-month response determined with apparent diffusion coefficient is an independent predictor of outcome. Radiology 2014; 270: 747-57.
21. Gillmore R, Stuart S, Kirkwood A, Hameeduddin A, Woodward N, Bur-roughs AK, Meyer T. EASL and mRECIST responses are independent prognostic factors for survival in hepatocellular cancer patients treated with transarterial embolization. J Hepatol 2011; 55: 1309-16.
22. Kim BK, Kim KA, An C, Yoo EJ, Park JY, Kim do Y, Ahn SH, Han KH, Kim SU, Kim MJ. Prognostic role of magnetic resonance imaging vs. comput-ed tomography for hepatocellular carcinoma undergoing chemoemboli-zation. Liver Int 2015; 35: 1722-30.
23. Katyal S, Oliver JH, Peterson MS, Chang PJ, Baron RL, Carr BI. Prognos-tic significance of arterial phase CT for prediction of response to trans-catheter arterial chemoembolization in unresectable hepatocellular
car-cinoma: a retrospective analysis. AJR Am J Roentgenol 2000; 175: 1665-72.
24. Davenport MS, Viglianti BL, Al-Hawary MM, Caoili EM, Kaza RK, Liu PS, Maturen KE, Chenevert TL, Hussain HK. Comparison of acute tran-sient dyspnea after intravenous administration of gadoxetate disodium and gadobenate dimeglumine: effect on arterial phase image quality. Radiology 2013; 266: 452-61.
25. Minami Y, Kudo M. Therapeutic response assessment of transcatheter arterial chemoembolization for hepatocellular carcinoma: ultrasonog-raphy, CT and MR imaging. Oncology 2013; 84: 58-63.
26. Ippolito D, Fior D, Bonaffini PA, Capraro C, Leni D, Corso R, Sironi S. Quantitative evaluation of CT-perfusion map as indicator of tumor re-sponse to transarterial chemoembolization and radiofrequency abla-tion in HCC patients. Eur J Radiol 2014; 83: 1665-71.
27. Malagari K. Drug-eluting particles in the treatment of HCC: chemoem-bolization with doxorubicin-loaded DC Bead. Expert Rev Anticancer Ther 2008; 8: 1643-50.