한수지 54(2), 208-217, 2021
208
Copyright © 2021 The Korean Society of Fisheries and Aquatic Science pISSN:0374-8111, eISSN:2287-8815
Korean J Fish Aquat Sci 54(2),208-217,2021
Original Article
서 론
우리나라해역에서식하는청어(Clupea pallasii)는북태평양
에널리분포하고있으며, 자원이풍부하여여러나라에서상
업적으로많이이용되어지고있는소형부어류이다(Hay et al.,
2008; Okouchi et al., 2008; Sugaya et al., 2008; Moon et al.,
2019). 20세기에들어청어어획량은여러나라에서급감하였
다(Parson, 1993; Li et al., 2020; Trochta et al., 2020). 예를들
면, 일본에서청어는 1900년대초반에약 600,000톤이상어획
되다가, 중반이후 30,000톤이하로어획되었고(Sugaya et al.,
2008), 캐나다의브리티시컬럼비아에서청어어획량은 1963
년약 260,000톤을정점으로 1967년에 60,000톤이하로급감
하였다(Parson, 1993). 이와같은어획량급감은북대서양청어
(Clupea harengus)에서도보여졌고(Bjørndal, 2003), 전세계
적인청어어업의붕괴원인에대해서어획노력량증가에따른
자원남획과해양환경변화가제시되어왔다(Kobayashi, 2002;
Lorentzen and Hannesson, 2004).
청어 자원의 남획으로 인한 어획량 급감은 주로 북대서양
청어(Clupea harengus)에서 언급되었는데(Bjørndal, 2003;
Dickey-Collas et al., 2010), 청어자원의회복을위해북유럽 여러나라에서는장기간공동으로어획관리를수행하여왔다 (Kvamsdal et al., 2016). 특히노르웨이의경우, 청어어획량이 1966년 2백만톤을정점으로 1970년에 0톤까지떨어졌고, 이후 모라토리움선언등자원회복을위한강력한어획관리를통해
50년간 우리나라 청어(
Clupea pallasii)의 어획 특성 및 어획량과 수온과의
관계
유준택*·김중진
1 국립수산과학원 고래연구센터, 1국립수산과학원 연근해자원과Fishing Characteristics of Pacific Herring Clupea pallasii and
Relation-ship between Its Catch and Sea Temperature during the Past 50 Years in
Korean Waters
Joon-Taek Yoo* and Jung Jin Kim
1Cetacean Research Institute, NIFS, Ulsan 44780, Korea
1Fisheries Resources Management Division, NIFS, Busan 46083, Korea
This study described the fishing characteristics of Pacific herring
Clupea pallasii
and examined the relationship be-tween its catch and sea temperature in Korean waters from 1970 to 2019. Although the herring catch in Korean waters stayed below 1,000 tons per year from the mid-1970s to mid-1980s, the catch in the winters in the East Sea of Korea started to increase markedly after 1987-1988, when the sea surface temperature (SST) seemed to shift to a warmer regime. Since the mid-2000s, overall, herring was caught throughout the year in the East Sea and eastern South Sea of Korea, and its catch significantly increased by around 30,000 tons per year. The main fishing grounds of herring in the poor fishing years until the mid-1980s were possibly formed in the western offshore of Korea, and subsequently the fishing grounds were distributed in the eastern coast of Korea. While the standardized catch per unit effort (CPUE) for two main fisheries of herring catch was significantly correlated with the herring catch since the 2000s, there was a gradual decline since the 2010s. The herring catch in the East Sea had significant positive correlations with SSTs, but that in the West Sea had a significant negative correlation.Keywords: Pacific herring, Fishing characteristics, CPUE, Sea temperature, Korean waters
*Corresponding author: Tel: +82. 52. 270. 0920 Fax: +82. 52. 270. 0913
E-mail address: [email protected]
This is an Open Access article distributed under the terms of the Creative Commons Attribution Non-Commercial Licens (http://creativecommons.org/licenses/by-nc/3.0/) which permits unrestricted non-commercial use, distribution, and reproduction in any medium, provided the original work is properly cited.
Received 4 December 2020; Revised 18 January 2021; Accepted 18 March 2021
저자 직위: 유준택(연구관), 김중진(연구사)
https://doi.org/10.5657/KFAS.2021.0208
청어 어획 특성 및 어획량과 수온과의 관계
209
20년이지난후에야자원이회복되어어획량은 1960년대수준
으로증가하였다(Bjørndal, 2003; Lorentzen and Hannesson,
2004; Sigurdsson, 2006). 이는적절한어획관리가수행되어져 야만수산자원회복이가능하다는것과수산자원이풍부하더 라도지속적이용을위한어획관리가이루어지지않는다면언 제든지자원붕괴로이어질수있다는것을시사하는대표적인 사례라고할수있을것이다. 하지만, 우리나라의경우청어자 원의지속적이용을위한제도화된어획관리는거의전무한실 정이며, 관리방안마련에근거가될수있는자원상태등에대 한연구도매우적다. 한편, 일본, 캐나다등에서다수의연구들은청어어획량변 동과 수온과의 관계에 대해서보고하였다(McFariane et al.,
2001; Nagasawa, 2001; Tanaka, 2002). Nagasawa (2001)에
의하면, 일본북해도주변해역에서표면수온이낮은기간에북 해도-사할린(Hokkaido-Sakhalin) 청어자원의강한연급군이 출현하여청어가많이어획된반면, 표면수온이높은기간동 안에는어획량은매우적었다. 또한, McFariane et al. (2001)은 1970-1990년대캐나다밴쿠버아일랜드(Vancouver Island)의 서쪽연안에서수온이상승할수록청어어획량은감소하는경 향이있음을보였다. 청어자원의효율적이용을위한어획관리방안마련을위해 서는우선적으로어획실태를파악한후, 이를통해현재의자원 상태에대해판단하고, 어획량변동에미치는해양환경요인에 대해이해하는것이필수적이다. 따라서, 본연구의목적은지 난 50년간우리나라청어의어획실태변화를파악하고, 이를통 해최근의자원상태를판단하는것과어획량변동과수온변화 와의관계에대해살펴보는것이다.
재료 및 방법
지난 50년간(1970-2019년) 청어의 월별·행정구역별·어업 별어획량자료는해양수산부의해양수산통계연보(구수산통 계연보, 농림수산통계연보)에서인용하였다. 기간 중 1983년 과 2001년연보에는각각청어의월별어획량과어업별어획 량은기재되지않았다. 청어의월별어획량자료는다시겨울 (1-3월), 봄(4-6월), 여름(7-9월), 가을(10-12월)로나누어서계 절별로정리하였다. 행정구역별로는편의상강원도를동해북 부(EN), 경상북도와울산광역시를동해남부(ES), 부산광역시 와경상남도를남해동부(SE), 인천광역시와경기도를서해북 부(WN), 이들외는나머지(others)로묶어서지역별로정리하 였다. 또한, 청어의남획여부등자원상태를판단하기위해청어의 주어획대상어업의어획노력량자료를사용하여상대자원량지수로사용되는단위노력당어획량(catch per unit effort, CPUE)
를구했다(Zhang and Lee, 2002). 2000년대이후의어선세력
자료는해양수산부의해양수산통계연보에서인용하였다. 연보 에는어업별척수, 톤수, 마력수가기재되어있으나, 척수와톤 수는정부의감척사업, 법적제한등으로마력수를어획노력량 변화를대표할수있는자료라고판단하여사용하였다. 주어 획대상어업으로는어업별청어어획량비율중상위 2개어업 (소형선망, 연안자망)을선정하였고, 이들어업에서청어를어 획하는데투입되는어획노력량은그단위가같지않기때문에
각어업별어획노력량을일반선형모델(general linear model)
을사용하여하나의노력단위로표준화하였다(Zhang and Lee,
2002). 주어진자료에는독립변수에분류형변수(연도, 어업)가
포함되어있으므로, 더미변수가포함된회귀모형을사용하여
표준화하였다(Quinn and Deriso, 1999; Zhang and Lee, 2002).
우리나라청어의장기어획량변동에서어획저수준기, 어획 수준이저수준에서고수준으로전환기, 어획고수준기간에청 어의어장분포를비교하였다. 청어의어장분포는국립수산과 학원어황표본조사데이터베이스에들어있는수협중앙회어선 안전조업본부의연도별·해구별(0.5°×0.5°) 어획량자료를사 용하여분석하였다. 청어를어획하는주어업중 1980-2010년 대까지어장분포에관한정보를얻을수있는어업은저인망류 뿐이였고, 2000년대이후에는대형선망이더해졌다. 지난약 50년간청어어획량변동과수온변화와의관계를살
펴보기 위해어장 주변의표면수온(sea surface temperature,
SST) 자료를국립수산과학원한국해양자료센터에서입수하였
Fig. 1. Map of South Korea. EN (green), ES (red), SE (blue), WN (grey) and Others (white) indicate the northern East Sea (Gang-won-do), southern East Sea (Gyeongsangbuk-do+Ulsan), east-ern South Sea (Busan+Gyeongsangnam-do), northeast-ern West Sea (Gyeonggi-do+Incheon) and other regions except for those in the Korean peninsula, respectively. The open and solid circles indicate the locations of sea surface temperature observation in the coastal region and western offshore region of Korea, respectively.
123 124 125 126 127 128 129 130 131 132 123 38 37 36 35 34 33 32 31 38 37 36 35 34 33 32 31 38 37 36 35 34 33 32 31 38 37 36 35 34 33 32 31 124 125 126 127 128 129 130 131 132 EN ES SE W N Latitude (degree) Longitude (degree) Sokcho Jumunjin Jukbyeon Ulgi Pohang Gampo Gadeok-do Gangwon-do Homigot Ulsan Busan Gyeongsangnam-do Sochung -do Incheon Gyeonggi-do Gyeongsangbuk-do 38 36 34 124 126 128 130 132
유준택
ㆍ
김중진210
다(KODC, 2020). 동해남·북부와남해동부연안역수온으로 는연안정지관측자료사용하였고, 서해외해역수온으로는정 선해양관측자료를사용하였다(Fig. 1). 연안역수온관측자료중 3개월이상월별자료가없는해는 분석에서제외시켰다. 간간이한개의월자료가생성이안될 경우에는인근관측소자료와의선형회귀식을통해선형보간 하였다. 각지역별로지난 50년간월별수온이비교적꾸준히관 측된곳 (분석에사용된자료의연도)은동해북부에서는속초 와주문지(1970-2010년, 2012-2013년, 2015-2018년), 동해남 부에서는감포, 울기, 죽변, 포항, 호미곶(1970-2010년, 2012-2015년), 남해 동부에서는 가덕도(1970-2000년, 2002-2008 년, 2010-2016년)였다. 격월로생산된정선해양관측자료중결 측된 1989-1992년서해외해역의 12월자료는서해의소청도 (1970-2011년)의표면수온자료와정선해양관측자료간에선 형회귀식을만들었고, 이식을통해선형보간하였다. 이둘간 의선형회귀식은 95% 신뢰수준에서통계적으로유의하였고, 기여율인결정계수(R2)는 0.9516이였다. 또한, Kim et al. (2014)은 1971-2013년간동해연안역수온 의연안정지관측자료를가지고 3년이동평균하여장기간추세 변화를살펴보았고, 본연구도 Kim et al. (2014)의분석방법과 동일하게자료를분석하였다.결 과
연도별·계절별·지역별·어업별 어획량 변동
지난 50년간(1970-2019) 우리나라청어의연도별·계절별·지 역별어획량변동을살펴보면, 1970년대초반주로여름-가을 철(7-12월)을중심으로 5,000톤내외에서어획되다가, 중반들 어 1,000톤미만으로어획되었다. 이후, 특히 1987-1988년부터 뚜렷한증가를보이는청어어획량은겨울철(1-3월)에크게늘 어나면서 1999년에 20,000톤까지증가하였으나, 이후 2002년 에 2,000톤미만까지급감하였다. 2000년대중반들어청어는 모든계절에걸쳐어획되면서어획량은다시큰폭으로증가하 여 2008년과 2013년에약 45,000톤까지어획되었다(Fig. 2). 따 라서, 1970년대중반-1980년대중반을어획저수준기, 1980년 대후반-2000년대초반을어획수준이저수준에서고수준으로 전환기, 2000년대중반-2019년을어획고수준기였다. 최근 10 년간평균어획량은 28,000톤으로, 계절별로는봄철어획량이Fig. 2. Time series of the catch of herring Clupea pallasii by season and region in Korean waters, 1970-2019.
0 10 20 30 40 50 Catch (×10 3 tons)
Winter Spring Summer Autumn
High Low Transition 0 10 20 30 40 50 1970 1973 1976 1979 1982 1985 1988 1991 1994 1997 2000 2003 2006 2009 2012 2015 2018 Catch (×10 3 tons) EN ES SE WN Others Year Year Large powered purse seine (11%) Small powered purse seine (74%) Coastal purse seine (14%) Others (1%) Others (0.1%)
Small gill net (93.7%)
Large gill net (6.2%) 0 10 20 30 40 50 60 2005 2007 2009 2011 2013 2015 2017 2019 0 50 100 150 200 Catch (×10 3 tons) CPUE (tons/10 4 HP) CPUE Catch r = 0.665, p < 0.05 -2.5 -1.5 -0.5 0.5 1.5 2.5 1970 1973 1976 1979 1982 1985 1988 1991 1994 1997 2000 2003 2006 2009 2012 2015 2018 SST anomaly 3-year moving average -3.5 -2.5 -1.5 -0.5 0.5 1.5 2.5 3.5 1970 1973 1976 1979 1982 1985 1988 1991 1994 1997 2000 2003 2006 2009 2012 2015 2018 SST anomaly 3-year moving average
-2.5 -1.5 -0.5 0.5 1.5 2.5 1970 1973 1976 1979 1982 1985 1988 1991 1994 1997 2000 2003 2006 2009 2012 2015 SST anomaly 3-year moving average
-2.5 -1.5 -0.5 0.5 1.5 2.5 1970 1973 1976 1979 1982 1985 1988 1991 1994 1997 2000 2003 2006 2009 2012 2015 SST anomaly 3-year moving average
0 2 4 6 8 10 12 14 15 16 17 18 19 Lo g (Ca tch) SST (C°) P > 0.05 SE 0 2 4 6 8 10 12 12 13 14 15 16 17 Lo g (Catc h) SST (C°) r = -0.490, P < 0.05 Western Offshore 0 2 4 6 8 10 12 10 11 12 13 14 15 16 17 18 Lo g (Ca tch) SST (C°) r = 0.425, P < 0.05 EN 0 2 4 6 8 10 12 12 13 14 15 16 17 18 Lo g (Ca tch) SST (C°) r = 0.588, P < 0.05 ES
Annual mean SST (°C) Annual mean SST (°C)
Annual mean SST (°C)
청어 어획 특성 및 어획량과 수온과의 관계
211
전체의 39.2%를가장많았고, 다음으로가을철 29.0%, 겨울철 27.6%, 여름철 17.7%순이였다. 지역별로 보면, 1970년대에는 남해동부(SE)와 서해북부 (WN) 어획량이전체의대부분을차지하였으나, 1980년대들 어급감하였다. 특히 1990년이후서해북부의연평균어획량은 1톤에불과하였다. 1980년대부터 1990년대중반까지동해북 부(EN) 어획량이전체의반이상을차지하다가, 이후동해남부 (ES) 어획량이대신에크게증가하였고, 뒤이어남해동부어획 량도증가하였다(Fig. 2). 최근 10년간동해남부와남해동부지 역의연평균어획량은약 18,000톤과 8,000톤으로각각 64.1% 와 29.8%를차지하였다. 또한, 1970년대청어는주로저인망류(drag nets)에의해어획 되었다. 이후청어의전체어획량중저인망류에의한어획량비 율은급감하여 1980년대후반부터는약 2% 내외에서변화하다 가 2010년대들어다시조금씩증가하기시작하였다(Fig. 3). 최 근 10년간저인망류의어획량비율은전체의 11.3%였다. 자망 류(gill nets)에의한어획량비율은 1980년대초반부터증가하 여 1989년에 80.5%을정점으로감소하기시작하였고, 2000년 대들어서는크게감소하여최근 10년간비율은 15% 내외에서 변화하였다. 반면, 선망류(purse seines)의어획량비율은 1990 년대중반부터증가하기시작하여최근 10년동안전체어획량 의약 50%를차지하였다. 정치망류(set nets)의어획량비율은 1982년에 50%를차지한적도있으나, 1980년대부터 15%내외 였다(Fig. 3). 전체적으로어업별청어어획량비율은선망류가 44.8%로가장높았고, 다음으로자망류 22.0%순이였다, 또한, 선망류와자망류중에서청어는각각소형선망(small poweredpurse seine)과연안자망(small gill net)에의해주로어획되었
다(Fig. 4).
Fig. 3. Long-term fluctuations in the proportions of herring Clupea pallasii caught by fishery, 1970-2019.
0 10 20 30 40 50 Catch (×10 3 tons)
Winter Spring Summer Autumn
High Low Transition 0 10 20 30 40 50 1970 1973 1976 1979 1982 1985 1988 1991 1994 1997 2000 2003 2006 2009 2012 2015 2018 Catch (×10 3 tons) EN ES SE WN Others Year Year Large powered purse seine (11%) Small powered purse seine (74%) Coastal purse seine (14%) Others (1%) Others (0.1%)
Small gill net (93.7%)
Large gill net (6.2%) 0 10 20 30 40 50 60 2005 2007 2009 2011 2013 2015 2017 2019 0 50 100 150 200 Catch (×10 3 tons) CPUE (tons/10 4 HP) CPUE Catch r = 0.665, p < 0.05 -2.5 -1.5 -0.5 0.5 1.5 2.5 1970 1973 1976 1979 1982 1985 1988 1991 1994 1997 2000 2003 2006 2009 2012 2015 2018 SST anomaly 3-year moving average -3.5 -2.5 -1.5 -0.5 0.5 1.5 2.5 3.5 1970 1973 1976 1979 1982 1985 1988 1991 1994 1997 2000 2003 2006 2009 2012 2015 2018 SST anomaly 3-year moving average
-2.5 -1.5 -0.5 0.5 1.5 2.5 1970 1973 1976 1979 1982 1985 1988 1991 1994 1997 2000 2003 2006 2009 2012 2015 SST anomaly 3-year moving average
-2.5 -1.5 -0.5 0.5 1.5 2.5 1970 1973 1976 1979 1982 1985 1988 1991 1994 1997 2000 2003 2006 2009 2012 2015 SST anomaly 3-year moving average
0 2 4 6 8 10 12 14 15 16 17 18 19 Lo g (Ca tch) SST (C°) P > 0.05 SE 0 2 4 6 8 10 12 12 13 14 15 16 17 Lo g (Catc h) SST (C°) r = -0.490, P < 0.05 Western Offshore 0 2 4 6 8 10 12 10 11 12 13 14 15 16 17 18 Lo g (Ca tch) SST (C°) r = 0.425, P < 0.05 EN 0 2 4 6 8 10 12 12 13 14 15 16 17 18 Lo g (Ca tch) SST (C°) r = 0.588, P < 0.05 ES
Annual mean SST (°C) Annual mean SST (°C)
Annual mean SST (°C)
Annual mean SST (°C)
Fig. 4. Catch rates of herring taken by fishing gear in purse seine and set net fisheries from 1970 to 2019.
0 10 20 30 40 50 Catch (×10 3 tons)
Winter Spring Summer Autumn
High Low Transition 0 10 20 30 40 50 1970 1973 1976 1979 1982 1985 1988 1991 1994 1997 2000 2003 2006 2009 2012 2015 2018 Catch (×10 3 tons) EN ES SE WN Others Year Year Large powered purse seine (11%) Small powered purse seine (74%) Coastal purse seine (14%) Others (1%) Others (0.1%)
Small gill net (93.7%)
Large gill net (6.2%) 0 10 20 30 40 50 60 2005 2007 2009 2011 2013 2015 2017 2019 0 50 100 150 200 Catch (×10 3 tons) CPUE (tons/10 4 HP) CPUE Catch r = 0.665, p < 0.05 -2.5 -1.5 -0.5 0.5 1.5 2.5 1970 1973 1976 1979 1982 1985 1988 1991 1994 1997 2000 2003 2006 2009 2012 2015 2018 SST anomaly 3-year moving average -3.5 -2.5 -1.5 -0.5 0.5 1.5 2.5 3.5 1970 1973 1976 1979 1982 1985 1988 1991 1994 1997 2000 2003 2006 2009 2012 2015 2018 SST anomaly 3-year moving average
-2.5 -1.5 -0.5 0.5 1.5 2.5 1970 1973 1976 1979 1982 1985 1988 1991 1994 1997 2000 2003 2006 2009 2012 2015 SST anomaly 3-year moving average
-2.5 -1.5 -0.5 0.5 1.5 2.5 1970 1973 1976 1979 1982 1985 1988 1991 1994 1997 2000 2003 2006 2009 2012 2015 SST anomaly 3-year moving average
0 2 4 6 8 10 12 14 15 16 17 18 19 Lo g (Ca tch) SST (C°) P > 0.05 SE 0 2 4 6 8 10 12 12 13 14 15 16 17 Lo g (Catc h) SST (C°) r = -0.490, P < 0.05 Western Offshore 0 2 4 6 8 10 12 10 11 12 13 14 15 16 17 18 Lo g (Ca tch) SST (C°) r = 0.425, P < 0.05 EN 0 2 4 6 8 10 12 12 13 14 15 16 17 18 Lo g (Ca tch) SST (C°) r = 0.588, P < 0.05 ES
Annual mean SST (°C) Annual mean SST (°C)
Annual mean SST (°C)
유준택
ㆍ
김중진212
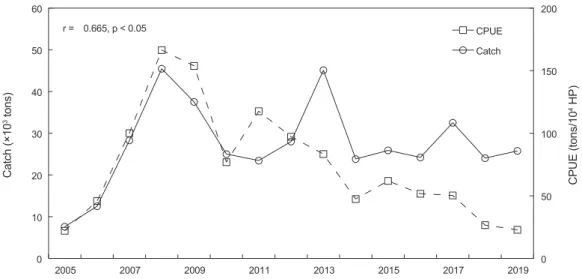
가있었다(r=0.665, P<0.05). 하지만, 2010년대들어청어어획
량은뚜렷한증가·감소경향을보이지않았으나, CPUE는명확
히감소하는경향을보였다(Fig. 7).
Table 1. Estimates of regression coefficients and related statistics in the general linear model for horse power data of small powered purse seine and small gill net. The analysis is undertaken only with respect to two factors (year, fishery) with 17 levels (2003-2019) of the year factor and two levels (small powered purse seine and small gill net) of fishery factor
Estimate SE P-value Intercept -0.1961 0.4183 0.645 Fishery 5.3646 0.1919 0.000 Year 2003 0.5451 0.5758 0.357 Year 2004 1.1670 0.5758 0.059 Year 2005 1.9120 0.5758 0.004 Year 2006 1.8733 0.5758 0.005 Year 2007 2.8200 0.5758 0.000 Year 2008 2.9583 0.5758 0.001 Year 2009 3.0236 0.5758 0.002 Year 2010 2.4383 0.5758 0.003 Year 2011 2.5030 0.5758 0.004 Year 2012 2.6413 0.5758 0.005 Year 2013 2.9803 0.5758 0.006 Year 2014 2.5561 0.5758 0.007 Year 2015 2.8126 0.5758 0.008 Year 2016 2.6203 0.5758 0.009 Year 2017 2.7513 0.5758 0.010 Year 2018 2.5137 0.5758 0.011 Year 2019 2.6120 0.5758 0.012
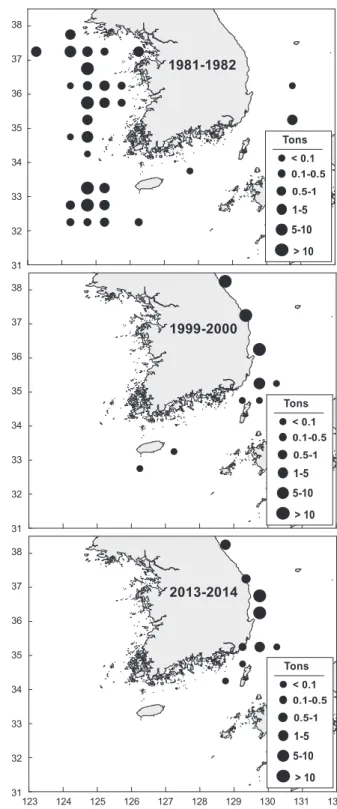
SE, standard error. Fig 5. Spatial distribution of fishing grounds of drag nets for her-ring Clupea pallasii.
123 124 125 126 127 128 129 130 131 132 123 38 37 36 35 34 33 32 31 38 37 36 35 34 33 32 31 38 37 36 35 34 33 32 31 38 37 36 35 34 33 32 31 124 125 126 127 128 129 130 131 132 EN ES SE W N Latitude (degree) Longitude (degree) Sokcho Jumunjin Jukbyeon Ulgi Pohang Gampo Gadeok-do Gangwon-do Homigot Ulsan Busan Gyeongsangnam-do Sochung -do Incheon Gyeonggi-do Gyeongsangbuk-do 38 36 34 124 126 128 130 132
어장분포도 비교
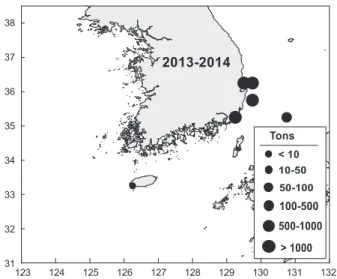
청어어획저수준기중 1981-1982년, 어획고수준으로의전환 기중 1999-2000년, 어획고수준기중 2013-2014년의저인망 류어업의청어어장분포도를보면, 저수준기동안어장은거의 대부분서해와제주서부외해역에서산발적으로형성되었던 반면, 어획수준전환기및고수준기동안청어는주로동해남· 북부와남해동부연안역주변에서어획되었다(Fig. 5). 2013-2014년간대형선망의청어어장역시동해남부연안역가까이 에서형성되었다(Fig. 6).어획량과 자원량 변동
청어어획량이가장많은소형선망과연안자망(Fig. 4)의어 선세력자료를가지고 2000년대이후부터일반선형모델을적 용하여 CPUE (청어어획량/마력수)를표준화하였다. 표준화에 사용된선형회귀식은 95% 신뢰수준에서통계적으로유의하 였고, 변수들의계수들도대부분 95% 신뢰수준에서유의하였 다(Table 1), 유의하지않은변수들을제외한선형회귀식으로 부터표준화된 CPUE와어획량간에는유의한양의상관관계청어 어획 특성 및 어획량과 수온과의 관계
213
어획량과 수온과의 관계
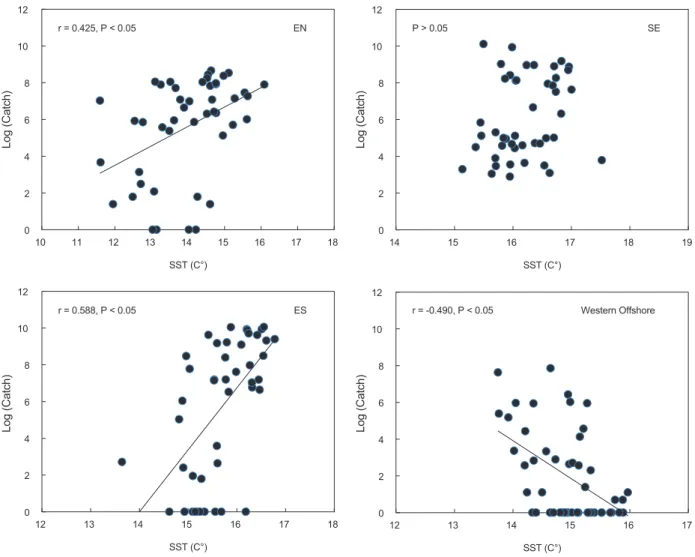
지난약 50년간청어어장주변해역의표면수온(SST) 편차와 3년이동평균한값을보면, 동해남·북부와남해동부연안역및 서해외해역모두에서전반적인증가경향의유의한(P<0.05) 선형회귀식은그려졌다. 또한, 수온은전체적으로동해와남 해동부에서는 1987-1988년을기점으로, 서해 외해역에서는 1989-1991년을기점으로평년수온보다낮은저수온기에서평 년수온보다높은고수준기로변화하였다(Fig. 8). 다음으로지난약 50년간동해남·북부, 남해동부연안역과 서해외해역의표면수온(°C) 변화와청어어획량간의관계를 살펴보면, 남해동부를제외한나머지해역에서표면수온과로 그변환된청어어획량사이에는유의한(P<0.05) 상관관계가 있었다(Fig. 9). 동해에서는이들둘간에양의상관관계가있 었던반면, 서해북부에서는음의상관관계가있었다(Fig. 9).고 찰
수온은청어의어획량변동요인의하나로거론되었고(Mc-Fariane et al., 2001; Nagasawa, 2001; Tanaka, 2002), 본연구
도지난 50년간우리나라의청어어획량변동과수온변화와의 관계에대해서검토하였다. 청어가주로어획되었거나어획되 고있는지역모두에서 50년간표면수온변화는전체적으로유 의하게증가하는경향을보였고, 1980년대말에수온의체제변 환이나타났다. 청어어획량변동과수온변화간의관계에대해 본연구는다음의두가지내용을명확히할수있었다. 1) 청어어획량이뚜렷이증가하기시작하는 1987-1988년에 청어가가장많이어획되는동해연안역에서수온체제가따뜻 하게바뀌었다. 2) 지난 50년간서해의청어어획량은수온이상승할수록감 소하였던반면, 동해의어획량은수온이상승할수록증가하였 다. 위에언급한과거 50년간청어의어획특성및어획량과수온 과의관계를종합해보면, 청어어획량은수온체제가따뜻하게 변환했던 1987-1988년을기점으로겨울철에동해연안역을중 심으로증가하기시작하였고, 2000년대들어어획량증가추세 는전계절에걸쳐남해동부연안역까지확대되었다고판단할 수있다. 반면, 서해에서의청어어장은 1990년대들어거의소 멸된것으로추정된다. 우리나라서해와동해지역에서청어어획량과수온간의관 계는서로정반대의관계를보였다(Fig. 9). 10년이상시간스 케일의해양환경변화는기후의체제변화와관련되어지며, 우 리나라해역에서는기후의체제변화가발생한 1976년과
1987-1989년에동해의수온은상승하였다(Zhang et al., 2000). Kim
et al. (2014)은 1971-2013년간동해연안역수온은 1987-1988 년을기점으로평년수온보다낮은저수온기에서평년수온보 다높은고수준기로변화하였음을보이면서 1987-1988년사이 에서수온의체제변환이일어났다고보고하였다. 이는본연구 결과에서도확인되었다(Fig. 8). 이러한기후의체제변화에따 른해양환경변화는어업자원의시·공간변화를유발시키며 (Zhang et al., 2000), 수온변화는어류의생물·생태학적특성
에직·간접적으로영향을미친다(Laevastu and Hayes, 1981).
또한, 초기감모이론의관점에서수온변화로인한청어의먹
이환경(Chimura et al., 2009), 피포식환경(McFariane et al., 2001), 산란·성육장환경(Yamane et al., 2019), 난·자치어수송 (Stocker et al., 1985) 등의변화는청어자원과어획수준에간 접적으로영향을미칠수있으며, 수온변화는청어의어장형성 과도관련지울수있다(Tanaka, 2002). 이러한수온변화에따 른다양한청어의생물·생태학적특성과서식환경변화가서로 상호관계를가지며서해와동해해역의청어자원과어획수준 에다르게영향을미치고있다고사료된다. 우리나라에서서해북부의청어어획량은 1980년대들어급 감하였는데(Fig. 2), Li et al. (2020) 또한황해에서중국의청 어어획량은 1970년대초반에급격히감소하기시작하여 1990 년대들어서는자원은거의붕괴수준이었다고언급하면서황
해의청어자원은태평양순년진동(Pacific decadal oscillation,
PDO)과음의상관관계에있었다고보고하였다. 해양의표면수 온에근거하는 PDO가양의값을나타내면동부태평양은따뜻 한수온을나타내므로(Kim et al., 2007), 황해의청어자원의 감소는따뜻해진수온과관련지울수있겠다. 우리나라서해에 서청어는주로외해역에서어획되었다(Fig. 5). Li et al. (2020) 에의하면황해에서청어는 2월에산란을위해중국연안역으 로이동하다가 4월들어황해중앙을중심으로형성되는서해 외해역의섭식및월동장으로이동한다. 즉, 서해에서우리나라 청어어장과섭식및월동장의위치는비슷하였고, 1970년대서
Fig. 6. Spatial distribution of fishing grounds of large powered purse seine for herring Clupea pallasii.
123 124 125 126 127 128 129 130 131 132 123 38 37 36 35 34 33 32 31 38 37 36 35 34 33 32 31 38 37 36 35 34 33 32 31 38 37 36 35 34 33 32 31 124 125 126 127 128 129 130 131 132 EN ES SE W N Latitude (degree) Longitude (degree) Sokcho Jumunjin Jukbyeon Ulgi Pohang Gampo Gadeok-do Gangwon-do Homigot Ulsan Busan Gyeongsangnam-do Sochung -do Incheon Gyeonggi-do Gyeongsangbuk-do 38 36 34 124 126 128 130 132
유준택
ㆍ
김중진214
해에서는섭식회유및월동하는청어가주로어획되었던것으 로추정된다. 따라서, 서해외해역에서수온상승으로인해청 어의먹이및월동환경에어떤변화가발생하였고, 이는섭식 회유및월동하는청어의자원량감소로이어졌을가능성이있다. Eisner et al. (2013)는배링해(Bering Sea) 북부와축치해
(Chukchi Sea) 남동부주변해역중에서높은클로로필과영양 염및대형동물플랑크톤으로특징지어지는수온이낮은해역 에청어가더많았음을보였다. 그리고서해와같이수온상승 으로인한청어어획량감소는일본북해도의청어어획량변 화에서도다수보고되어졌다(Nagasawa, 2001; Tanaka, 2002). Nagasawa (2001)는일본북해도주변해역에서표면수온이상 대적으로높았던시기에비해낮았던 20세기초청어의많은어 획량은강한연급군발생에의한것으로보고하였고, Tanaka (2002)는수온상승으로인해어장이다른곳으로이동하여어 획량이감소되었을가능성을제시하였다. 또한, McFariane et al. (2001)은수온상승으로인한청어의포식생물량증가가어
Fig. 7. Annual changes of standarized CPUE (catch per unit effort) and catch of herring Clupea pallasii in Korean waters from 2005 to 2019.
0 10 20 30 40 50 Catch (×10 3 tons)
Winter Spring Summer Autumn
High Low Transition 0 10 20 30 40 50 1970 1973 1976 1979 1982 1985 1988 1991 1994 1997 2000 2003 2006 2009 2012 2015 2018 Catch (×10 3 tons) EN ES SE WN Others Year Year Large powered purse seine (11%) Small powered purse seine (74%) Coastal purse seine (14%) Others (1%) Others (0.1%)
Small gill net (93.7%)
Large gill net (6.2%) 0 10 20 30 40 50 60 2005 2007 2009 2011 2013 2015 2017 2019 0 50 100 150 200 Catch (×10 3 tons) CPUE (tons/10 4 HP) CPUE Catch r = 0.665, p < 0.05 -2.5 -1.5 -0.5 0.5 1.5 2.5 1970 1973 1976 1979 1982 1985 1988 1991 1994 1997 2000 2003 2006 2009 2012 2015 2018 SST anomaly 3-year moving average -3.5 -2.5 -1.5 -0.5 0.5 1.5 2.5 3.5 1970 1973 1976 1979 1982 1985 1988 1991 1994 1997 2000 2003 2006 2009 2012 2015 2018 SST anomaly 3-year moving average
-2.5 -1.5 -0.5 0.5 1.5 2.5 1970 1973 1976 1979 1982 1985 1988 1991 1994 1997 2000 2003 2006 2009 2012 2015 SST anomaly 3-year moving average
-2.5 -1.5 -0.5 0.5 1.5 2.5 1970 1973 1976 1979 1982 1985 1988 1991 1994 1997 2000 2003 2006 2009 2012 2015 SST anomaly 3-year moving average
0 2 4 6 8 10 12 14 15 16 17 18 19 Lo g (Ca tch) SST (C°) P > 0.05 SE 0 2 4 6 8 10 12 12 13 14 15 16 17 Lo g (Catc h) SST (C°) r = -0.490, P < 0.05 Western Offshore 0 2 4 6 8 10 12 10 11 12 13 14 15 16 17 18 Lo g (Ca tch) SST (C°) r = 0.425, P < 0.05 EN 0 2 4 6 8 10 12 12 13 14 15 16 17 18 Lo g (Ca tch) SST (C°) r = 0.588, P < 0.05 ES
Annual mean SST (°C) Annual mean SST (°C)
Annual mean SST (°C) Annual mean SST (°C) 0 10 20 30 40 50 Catch (×10 3 tons)
Winter Spring Summer Autumn
High Low Transition 0 10 20 30 40 50 1970 1973 1976 1979 1982 1985 1988 1991 1994 1997 2000 2003 2006 2009 2012 2015 2018 Catch (×10 3 tons) EN ES SE WN Others Year Year Large powered purse seine (11%) Small powered purse seine (74%) Coastal purse seine (14%) Others (1%) Others (0.1%)
Small gill net (93.7%)
Large gill net (6.2%) 0 10 20 30 40 50 60 2005 2007 2009 2011 2013 2015 2017 2019 0 50 100 150 200 Catch (×10 3 tons) CPUE (tons/10 4 HP) CPUE Catch r = 0.665, p < 0.05 -2.5 -1.5 -0.5 0.5 1.5 2.5 1970 1973 1976 1979 1982 1985 1988 1991 1994 1997 2000 2003 2006 2009 2012 2015 2018 SST anomaly 3-year moving average -3.5 -2.5 -1.5 -0.5 0.5 1.5 2.5 3.5 1970 1973 1976 1979 1982 1985 1988 1991 1994 1997 2000 2003 2006 2009 2012 2015 2018 SST anomaly 3-year moving average
-2.5 -1.5 -0.5 0.5 1.5 2.5 1970 1973 1976 1979 1982 1985 1988 1991 1994 1997 2000 2003 2006 2009 2012 2015 SST anomaly 3-year moving average
-2.5 -1.5 -0.5 0.5 1.5 2.5 1970 1973 1976 1979 1982 1985 1988 1991 1994 1997 2000 2003 2006 2009 2012 2015 SST anomaly 3-year moving average
0 2 4 6 8 10 12 14 15 16 17 18 19 Lo g (Ca tch) SST (C°) P > 0.05 SE 0 2 4 6 8 10 12 12 13 14 15 16 17 Lo g (Catc h) SST (C°) r = -0.490, P < 0.05 Western Offshore 0 2 4 6 8 10 12 10 11 12 13 14 15 16 17 18 Lo g (Ca tch) SST (C°) r = 0.425, P < 0.05 EN 0 2 4 6 8 10 12 12 13 14 15 16 17 18 Lo g (Ca tch) SST (C°) r = 0.588, P < 0.05 ES
Annual mean SST (°C) Annual mean SST (°C)
Annual mean SST (°C)
Annual mean SST (°C)
Fig. 8. Anomalies of annual mean SST (sea surface temperature) in each region during study period. Blue and red lines indicate 3-year mov-ing average and liner regression line, respectively. All liner regressions were significant (P<0.05).
청어 어획 특성 및 어획량과 수온과의 관계
215
획량감소원인이될수있다고주장하였다.
한편, 수온이상승할수록청어어획량이증가하는경향을보
이는동해에서청어는연안역에서주로어획되는특징을보였
다(Fig. 5). 청어는연안가까운곳에서식하는해산식물에부착
성알을낳는습성을가진어종이다(Haegele and Schweigert,
1985; Hoshikawa et al., 2002; Lee et al., 2017; Moon et al.,
2019). 1980년대말청어어획량증가의시발점이되는계절이
청어산란기인겨울철이었다는것을고려하면(Fig. 2), 산란기
간동안동해연안산란장의수온변화가산란생태(산란회유, 산
란량등)에영향을미쳐어획량증가로이어졌을가능성이있
다. 또한, 모든생물에서성장에가장적절한수온대는존재하
며(Sauer and Wang, 2019), Haist and Stocker (1985)는캐나다
조지아해협(the Strait of Georgia)에서청어치어의성장에최
적인표면수온은 12.2°C라고보고하였다. 청어는냉수성어류 이지만(Lee et al., 2017), 성장에최적인수온대까지의수온상 승은청어성장을촉진시켜가입량증가로이어질수있으나, 우 리나라주변해역에서이에대한정보는없다. 향후과제로서우 리나라주변해역에서청어의산란적수온, 최적성장및서식수 온에대한연구의필요성은제시되어진다. 최근남해안진해만 의청어산란장에서어란부착에선회되는해조류에대해보고
되었고(Lee et al., 2017; Moon et al., 2019), 동해안청어산란
장에서수온변화에따른해조상변화가청어의산란생태에미 치는영향에대해서도향후연구될필요성이있겠다. 우리나라남해동부의어획량은 1970년대서해에서의어획 량급감과함께급감하였고, 이후동해에서의어획량증가에뒤 따라 2000년대이후증가하는경향이었다(Fig. 2). 따라서, 남 해동부해역에서청어어획량의장기변동은주로인근해역의 자원수준에의해영향을받는것처럼보여지며, 이것이어획량 변동과수온변화간에유의한상관관계가없는이유라고여겨 진다. 즉, 동해에서청어자원이증가하면서산란및분포해역 0 10 20 30 40 50 Catch (×10 3 tons)
Winter Spring Summer Autumn
High Low Transition 0 10 20 30 40 50 1970 1973 1976 1979 1982 1985 1988 1991 1994 1997 2000 2003 2006 2009 2012 2015 2018 Catch (×10 3 tons) EN ES SE WN Others Year Year Large powered purse seine (11%) Small powered purse seine (74%) Coastal purse seine (14%) Others (1%) Others (0.1%)
Small gill net (93.7%)
Large gill net (6.2%) 0 10 20 30 40 50 60 2005 2007 2009 2011 2013 2015 2017 2019 0 50 100 150 200 Catch (×10 3 tons) CPUE (tons/10 4 HP) CPUE Catch r = 0.665, p < 0.05 -2.5 -1.5 -0.5 0.5 1.5 2.5 1970 1973 1976 1979 1982 1985 1988 1991 1994 1997 2000 2003 2006 2009 2012 2015 2018 SST anomaly 3-year moving average -3.5 -2.5 -1.5 -0.5 0.5 1.5 2.5 3.5 1970 1973 1976 1979 1982 1985 1988 1991 1994 1997 2000 2003 2006 2009 2012 2015 2018 SST anomaly 3-year moving average
-2.5 -1.5 -0.5 0.5 1.5 2.5 1970 1973 1976 1979 1982 1985 1988 1991 1994 1997 2000 2003 2006 2009 2012 2015 SST anomaly 3-year moving average
-2.5 -1.5 -0.5 0.5 1.5 2.5 1970 1973 1976 1979 1982 1985 1988 1991 1994 1997 2000 2003 2006 2009 2012 2015 SST anomaly 3-year moving average
0 2 4 6 8 10 12 14 15 16 17 18 19 Lo g (Ca tch) SST (C°) P > 0.05 SE 0 2 4 6 8 10 12 12 13 14 15 16 17 Lo g (Catc h) SST (C°) r = -0.490, P < 0.05 Western Offshore 0 2 4 6 8 10 12 10 11 12 13 14 15 16 17 18 Lo g (Ca tch) SST (C°) r = 0.425, P < 0.05 EN 0 2 4 6 8 10 12 12 13 14 15 16 17 18 Lo g (Ca tch) SST (C°) r = 0.588, P < 0.05 ES
Annual mean SST (°C) Annual mean SST (°C)
Annual mean SST (°C)
Annual mean SST (°C)
Fig. 9. Correlations between SST (sea surface temperature,°C) and log-transformed catch (tons) of herring in each region during the study period. The SST and catch were annually averaged.
유준택
ㆍ
김중진216
이남해동부까지확장되어어획량이증가한것으로풀이된다. 1980년대말부터, 적어도 2000년대이후청어어획량증가는 자원량증가에따른것으로추정된다(Fig. 7). 즉, 장기적인시 간스케일에서 1980년대후반따뜻하게체제변화된수온이청 어의자원수준에긍정적인영향을미쳤던것으로사료된다. 하 지만, 2010년대들어청어자원량은뚜렷한감소추세에있으므 로남획의우려가있다. 이로인해비록 2000년대들어청어자 원수준이고수준에있더라도, 어획관리의필요성이제기되어진다. Lorentzen and Hannesson (2004)에의하면, 노르웨이에
서청어어업의붕괴는어린청어의남획때문이다. FAO에서는 특정해역에서미성어어획비율이일정비율을상회할경우어업 을금지하는등의사전예방적(precautionary) 어업관리가제시 되었다(FAO, 1996). 따라서, 우선적으로청어의성장남획방지 를위해서미성숙청어에대한포획금지체장의법적신설은조 속히이루어져야될것으로생각된다. 또한, 동북아시아에서중국황해와일본북해도의청어어획 량은각각 1970년대와 1950년대에급격히감소한이후어획수
준은낮은상태에머물러있다(Li et al., 2020; Tanaka, 2002).
인근국가들과우리나라의청어어획량간에상반되는장기경 년변동은적어도동북아시아정도의공간규모에서해역별자 원상태에따라청어분포역이변화되고있을가능성을의미하 며, 국가별청어어획수준이인근국가의청어어획량변동을예 측할수있는하나의요인으로사용할수있음을시사한다. 이를 명확히하기위해서는각나라청어의계군정의와대규모시· 공간회유특성등에대한조사가선행되어야되며, 이를위한국 제공동연구는향후과제로남겨질것이다.
사 사
본 연구는 2020년도 국립수산과학원 수산과학연구사업 (R2020024)의지원으로수행되었으며, 연구비지원에감사드 립니다.References
Bjørndal T. 2003. Management of a straddling fish stock: The case of the Norwegian spring spawning herring fishery. FAO Fisheries Report 695 (Supplement), Rome, Italy, 68-85. Chimura M, Watanabe Y, Okouchi H, Shirafuji N and
Kawamu-ra T. 2009. Hatch-period-dependent early growth and sur-vival of Pacific herring Clupea pallasii in Miyako Bay, Japan. J Fish Biol 74, 604-620. https://doi.org/10.1111/ j.1095-8649.2008.02151.x.
Dickey-Collas M, Nash RDM, Brunel T, van Damme CJG, Marshall CT, Payne MR, Corten A, Geffen AJ, Peck MA, Hatfield EMC, Hintzen NT, Enberg K, Kell LT and Sim-monds EJ. 2010. Lessons learned from stock collapse and recovery of North Sea herring: a review. ICES J Mar Sci 67,
1875-1886. https://doi.org/10.1093/icesjms/fsq033. Eisner L, Hillgruber N, Martinson E and Maselko J. 2013.
Pe-lagic fish and zooplankton species assemblages in relation to water mass characteristics in the northern Bering and southeast Chukchi seas. Polar Biol 36, 87-113. https://doi. org/10.1007/s00300-012-1241-0.
FAO (Food and Agriculture Organization of the United Na-tions). 1996. Precautionary approach to capture fisheries and species introductions. FAO Technical Guidelines for Responsible Fisheries 2, 1-54.
Haegele CW and Schweigert JF. 1985. Distribution and char-acteristics of herring spawning grounds and description of spawning behavior. Can J Fish Aquat Sci 42, 39-55. https:// doi.org/10.1139/f85-261.
Haist V and Stocker M. 1985. Growth and maturation of Pacific herring (Clupea harengus pallasi) in the Strait of Georgia. Can J Fish Aquat Sci 42, 138-146. https://doi.org/10.1139/ f85-269.
Hay DE, Rose KA, Schweigert J and Megrey BA. 2008. Geo-graphic variation in North Pacific herring populations: Pan-Pacific comparisons and implications for climate change im-pacts. Prog Oceanogr 77, 233-240. https://doi.org/10.1016/j. pocean.2008.03.015.
Hoshikawa H, Tajima K and Kawai T. 2002. Effect of vegeta-tion and topography on the spawning bed selecvegeta-tion of her-ring Clupea pallasii. Sci Rep Hokkaido Fish Exp Stn 62, 105-111.
Kim S, Kang S, Seo H, Kim E and Kang M. 2007. Climate vari-ability and chum salmon production in the north Pacific. J Korean Soc Oceanog 12, 61-72.
Kim SW, Im JW, Yoon BS, Jeong HD and Jang SH. 2014. Long-term variations of the sea surface temperature in the east coast of Korea. J Korean Soc Mar Environ Saf 20, 601-608. https://doi.org/10.7837/kosomes.2014.20.6.601.
Kobayashi T. 2002. History of herring fishery in Hokkaido and the review of population study. Sci Rep Hokkaido Fish Exp Stn 62, 1-8.
KODC (Korea oceanographic data center). 2020. Ocean ob-servation data. Retrieved from http://www.nifs.go.kr/kodc/ index.kodc on Nov 24, 2020.
Kvamsdal SF, Eide A, Ekerhovd N-A, Enberg K, Gudmunds-dottir A, Hoel AH, Mills KE, Mueter FJ, Ravn-Jonsen L, Sandal LK, Stiansen JE and Vestergaard N. 2016. Harvest control rules in modern fisheries management. Elem Sci Anth 4, 000114. https://doi.org/10.12952/journal.elemen-ta.000114.
Laevastu T and Hayes ML. 1981. Fisheries oceanography and ecology. Fishing News Books, Farnham, England, 5-9. Lee YD, Choi JH, Moon SY, Lee SK and Gwak WS. 2017.
Spawning characteristics of Clupea pallasii in the coastal waters off Gyeongnam, Korea, during spawning season. Ocean Sci J 52, 581-586.
https://doi.org/10.1007/s12601-청어 어획 특성 및 어획량과 수온과의 관계
217
017-0046-z.
Li H, Yang S, Tang Q, Zhou X and Sun Y. 2020. Long-term variation in the abundance of Pacific herring Clupea pallasii from the Yellow Sea in the western North Pacific and its re-lation to climate over the past 590 years. Fish Oceanogr 29, 56-65. https://doi.org/10.1111/fog.12449.
Lorentzen T and Hannesson R. 2004. The collapse of the Nor-wegian herring fisheries in the late 1950s and 60s crisis, ad-aptation, and recovery. Centre for fisheries economics dis-cussion paper 2/2004, Bergen, Norway, 2-30.
Nagasawa K. 2001. Long-term variations in abundance of Pacif-ic herring Clupea pallasi in Hokkaido and Sakhalin related to changes in environmental conditions. Prog Oceanogr 49, 551-564. https://doi.org/10.1016/S0079-6611(01)00040-4. McFariane GA, Beamish RJ and Schweigert J. 2001. Common
factors have opposite impacts on Pacific herring in adjacent ecosystems. In: Herring. Expectations for a new millen-nium. Funk F, Blackburn J, Hay D, Paul AJ, Stephenson R, Toresen R and Witherell D, eds. University of Alaska Sea Grant Report AK-SG-01-04, 51-67.
Moon SY, Choi JH, Lee HW, Kim JN, Heo JS, Gwak WS and Lee YD. 2019. Distribution and characteristics of Pa-cific herring Clupea pallasii spawning beds in Jinhae Bay, Korea. Korean J Fish Aquat Sci 52, 534-538. https://doi. org/10.5657/KFAS.2019.0534.
Okouchi H, Yamane S and Aritaki M. 2008. Migration ecology of the herring Clupea pallasii after spawning in Miyako Bay and homing in the following year. Nippon Sui Gak 74, 389-394. https://doi.org/10.2331/suisan.74.389.
Parsons LS. 1993. Management of marine fisheries in Canada. Can Bull Fish Aquat Sci 225, 345-349.
Quinn II TJ and Deriso RB. 1999. Quantitative fish dynamics. Oxford University Press, New York, NY, U.S.A., 18-23. Sauer D and Wang DN. 2019. Predicting the optimal growth
temperatures of prokaryotes using only genome de-rived features. Bioinformatics 35, 3224-3231. https://doi. org/10.1093/bioinformatics/btz059.
Sigurdsson T. 2006. The collapse of the Atlanto-Scandian her-ring fishery: the effects on the Icelandic economy. In: IIFET 2006 proceedings, Portsmouth, U.K., 1-9.
Stocker M, Haist V and Fournier D. 1985. Environmental varia-tion and recruitment of Pacific herring (Clupea harengus pallasi) in the Strait of Georgia. Can J Fish Aquat Sci 42, 174-180. https://doi.org/10.1139/f85-272.
Sugaya T, Sato M, Yokoyama E, Nemoto Y, Fujita T, Okouchi H, Hamasaki K and Kitada S. 2008. Population genetic structure and variability of Pacific herring Clupea pallasii in the stocking area along the Pacific coast of northern Ja-pan. Fish Sci 74, 579-588. https://doi.org/10.1111/j.1444-2906.2008.01561.x.
Tanaka I. 2002. Temporal variation in the 20th century of coastal
sea temperature and annual herring landings off the west
coast of Hokkaido. Sci Rep Hokkaido Fish Exp Stn 62, 41-55.
Trochta JT, Branch TA, Shelton AO and Hay DE. 2020. The highs and lows of herring: a meta-analysis of patterns and factors in herring collapse and recovery. Fish Fish. https:// doi.org/10.1111/faf.12452.
Yamane K, Murase I, Shirafuji N, Hayashi A, Nagakura Y and Watanabe Y. 2019. Nursery habitat use for larval and juve-nile Pacific herring Clupea pallasii in Miyako Bay on the Pacific coast of northern Japan. Fish Sci 85, 407-416. https:// doi.org/10.1007/s12562-019-01301-7.
Zhang CI, Lee JB, Kim S and Oh JH. 2000. Climatic regime shifts and their impacts on marine ecosystem and fisheries resources in Korea waters. Prog Oceanogr 47, 171-190. https://doi.org/10.1016/S0079-6611(00)00035-5.
Zhang CI and Lee SG. 2002. Fisheries management. Sejong Press, Busan, Korea, 101-112.