967 Copyright © 2021 by Animal Bioscience
This is an open-access article distributed under the terms of the Creative Commons Attribution License (http://creativecommons.org/licenses/by/4.0/), which permits unrestricted use, distribution, and reproduction in any medium, provided the original work is properly cited.
www.animbiosci.org Anim Biosci
Vol. 34, No. 6:967-974 June 2021 https://doi.org/10.5713/ajas.20.0261 pISSN 2765-0189 eISSN 2765-0235
Genetic relationship between purebred and synthetic pigs for
growth performance using single step method
Joon Ki Hong1, Kyu Ho Cho1, Young Sin Kim1, Hak Jae Chung1, Sun Young Baek1, Eun Seok Cho1,*, and Soo Jin Sa1,*
Objective: The objective of this study was to estimate the genetic correlation (rpc) of growth performance between purebred (Duroc and Korean native) and synthetic (WooriHeukDon) pigs using a single-step method.
Methods: Phenotypes of 15,902 pigs with genotyped data from 1,792 pigs from a nucleus farm were used for this study. We estimated the rpc of several performance traits between WooriHeukDon and purebred pigs: day of target weight (DAY), backfat thickness (BF), feed conversion rate (FCR), and residual feed intake (RFI). The variances and covariances of the studied traits were estimated by an animal multi-trait model that applied the Bayesian inference.
Results: rpc within traits was lower than 0.1 for DAY and BF, but high for FCR and RFI; in particular, rpc for RFI between Duroc and WooriHeukDon pigs was nearly 1. Comparison between different traits revealed that RFI in Duroc pigs was associated with different traits in WooriHeukDon pigs. However, the most of rpc between different traits were estimated with low or with high standard deviation.
Conclusion: The results indicated that there were substantial differences in rpc of traits in the synthetic WooriHeukDon pigs, which could be caused by these pigs having a more complex origin than other crossbred pigs. RFI was strongly correlated between Duroc and WooriHeukDon pigs, and these breeds might have similar single nucleotide polymorphism effects that control RFI. RFI is more essential for metabolism than other growth traits and these metabolic characteristics in purebred pigs, such as nutrient utilization, could significantly affect those in synthetic pigs. The findings of this study can be used to elucidate the genetic architecture of crossbred pigs and help develop new breeds with target traits.
Keywords: Synthetic Pigs; Genetic Correlation; WooriHeukDon; Residual Feed Intake; Growth
INTRODUCTION
The breeding objective of nucleus swine farms is to improve commercial pig performance. Breeders select purebred pigs because they assume there is a strong relationship between performance of the purebred pigs and their progenies. However, the accuracy of this selec-tion depends on the genetic correlaselec-tion (rpc) between purebred and crossbred performance. The three main components that affect this performance are genotype-by-genotype inter-actions, genotype-by-environment interinter-actions, and the different definitions of traits can reduce the rpc [1]. Synthetic pigs originated from purebred pigs; however, with increasing generations, they may develop genetically different characters, as has been observed in Iberian pigs [2]. Several studies on rpc concentrated on the relationship with crossbred performance [3-6]. This information can be used to verify the genetic influence of pure-* Corresponding Authors:
Eun Seok Cho
Tel: +82-31-580-3457, Fax: +82-31-580-3459, E-mail: [email protected]
Soo Jin Sa
Tel: +82-41-580-3450, Fax: +82-31-580-3459, E-mail: [email protected]
1 National Institute of Animal Science, Rural
Development Administration, Cheonan 31000, Korea ORCID Joon Ki Hong https://orcid.org/0000-0001-8272-1263 Kyu Ho Cho https://orcid.org/0000-0001-5149-9700 Young Sin Kim
https://orcid.org/0000-0001-5466-8813 Hak Jae Chung
https://orcid.org/0000-0002-3127-5192 Sun Young Baek
https://orcid.org/0000-0001-5130-2269 Eun Seok Cho
https://orcid.org/0000-0001-5223-099X Soo Jin Sa
https://orcid.org/0000-0002-2634-5109 Submitted Apr 24, 2020; Revised Jun 24, 2020; Accepted Aug 21, 2020
968 www.animbiosci.org
Hong et al(2021) Anim Biosci 34:967-974
bred pigs on synthetic pigs, which helps elucidate the crossbred genetic architecture underlying complex traits. This verification can also be used to help develop new synthetic populations and improve target traits.
WooriHeukDon pigs are a synthetic breed that was pro-duced by crossing Duroc with Korean native pigs in Korea [7]. The rpc of performances traits between purebred (Duroc or Korean native) and WooriHeukDon pigs may be low be-cause WooriHeukDon pigs are now genetically distinct [7], and the number of common sires was small [1]. However, feed efficiency traits can be more complex than growth traits. Feed efficiency is related to nutrient utilization, and energy digestibility and selection, and improved feed efficiency can improve various functions that use energy and nutrients [8,9]. We assumed that, in the same feeding environment, the genetic characteristics of energy digestibility were similar between purebred and synthetic pigs. Our Duroc, Woori-HeukDon, and Korean native pigs were raised at the same farm under the same feeding system. Therefore, we estimated the rpc of several performance traits between WooriHeukDon and purebred pigs: day of target weight (DAY), backfat thick-ness (BF), feed conversion rate (FCR), and residual feed intake (RFI).
MATERIALS AND METHODS
Dataset
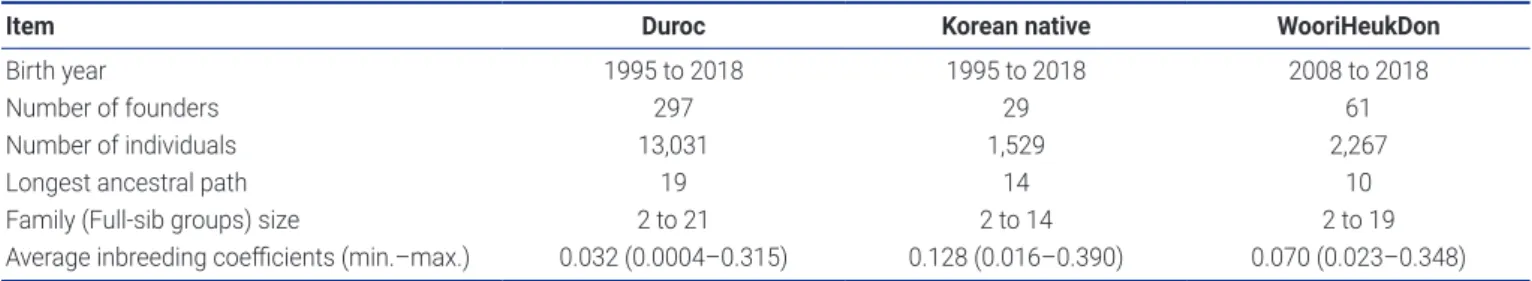
We used data provided by the National Institute of Animal Science in Korea. The pedigree included 13,031 Duroc, 1,529 Korean native, and 2,267 WooriHeukDon pigs (Table 1). The population structures of these breeds were determined using CFC v1.0 [10].
WooriHeukDon pigs are a synthetic breed that was pro-duced by crossing Duroc with Korean native pigs in Korea. A total of 50 pure pigs (42 Duroc and 10 Korean native) were used to produce WooriHeukDon pigs from 2008 to 2010. Ini-tially, pure Korean native boars were crossed with Duroc sows to produce F1 animals. Then, Duroc boars were used to sire the F2 generation and produced 25% Korean native and 75% Duroc pigs, which were further crossed with F1 individuals to finally yield 37.5% Korean native and 62.5% Duroc pigs. Furthermore, WooriHeukDon (37.5% Korean
native and 62.5% Duroc) pigs were selected for about seven generations from 2010 to 2018.
The experimental protocols describing the management and care of the animals were reviewed and approved accord-ing to the Guide for the Care and Use of Laboratory Animals (National Institute of Animal Science, Animal Care Com-mittee of Korea) on 19 August 2019 (approval number: NIAS 2019-1709). All pigs were raised in an experimental farm of NIAS and had a space allowance of at least 1 m2 with solid concrete flooring. Pigs were fed ad libitum and water was constantly accessible through nipple drinkers. We tested all pigs that were raised under the same facilities. The feeding program and measurement of traits were conducted in ac-cordance with the pig testing standards of the Korean Animal Improvement Association (http://www.aiak.or.kr/eng). The performance tests of each trait started soon after each animal reached a live body weight of 30 kg and were continued until a target weight (TW) of 90 kg (70 kg for Korean native) was attained. On average, fewer than 160 days were required to attain this TW. Average daily gain (ADG, g/d) was calculated as TW minus start weight di-vided by the length of the period. BF was measured using an A-mode ultrasound device (Renco Lean-Meter series 12, Renco Corporation, Minneapolis, MN, USA). Average backfat thickness (ABF) was obtained by calculating the average BF of the shoulder (on the 4th thoracic vertebrae), mid-back (on the last thoracic vertebrae), and loin (on the last lumbar vertebrae). Approximately four to six female pigs were kept in a pen. Alternatively, one or two male pigs from the same litter were kept in a pen to calculate feed intake. Feed disappearance from each pen was recorded during performance tests to calculate average daily feed intake (ADFI). FCR was calculated as ADFI divided by ADG. DAY and BF were calculated as follows [11]:
DAY = age at the test
5
4th thoracic vertebrae), mid-back (on the last thoracic vertebrae), and loin (on the last lumbar vertebrae). 105
Approximately four to six female pigs were kept in a pen. Alternatively, one or two male pigs from the 106
same litter were kept in a pen to calculate feed intake. Feed disappearance from each pen was recorded 107
during performance tests to calculate average daily feed intake (ADFI). FCR was calculated as ADFI 108
divided by ADG. DAY and BF were calculated as follows [11]: 109
110
DAY = age at the test + ሺ – ୠ୭ୢ୷ ୵ୣ୧୦୲ ୟ୲ ୲୦ୣ ୲ୣୱ୲ሻ ൈ ሺୟୣ ୟ୲ ୲୦ୣ ୲ୣୱ୲ – ଷ଼ሻ ୠ୭ୢ୷ ୵ୣ୧୦୲ ୟ୲ ୲୦ୣ ୲ୣୱ୲ 111
112
BF = ABF + ሺ ି ୠ୭ୢ୷ ୵ୣ୧୦୲ ୟ୲ ୲୦ୣ ୲ୣୱ୲ሻ ൈ ሺሻ ሺୠ୭ୢ୷ ୵ୣ୧୦୲ ୟ୲ ୲୦ୣ ୲ୣୱ୲ – ଵଵ.ଷସሻ 113
114
BF (Korean native) = ABF + ሺ ି ୠ୭ୢ୷ ୵ୣ୧୦୲ ୟ୲ ୲୦ୣ ୲ୣୱ୲ሻ ൈ ሺሻ ሺୠ୭ୢ୷ ୵ୣ୧୦୲ ୟ୲ ୲୦ୣ ୲ୣୱ୲ ି ସ.ଷሻ 115
116
RFI was obtained as the difference between the observed and predicted ADFI [12]: 117
118
ADFI = μ+b1ADG+b2BF+b3AGEonset +e,
119 120
where AGEonset is the age at which the animal was tested; b1, b2, and b3 are the linear coefficients of the
121
regression for covariates; and e is the RFI. The phenotypic dataset, which included DAY, BF, FCR, and 122
RFI, was obtained from performance tests (Table 2). Korean native pigs had records only for DAY and 123 BF. 124 125 Genotyping of animals 126
The genomic DNA of pigs was extracted from their blood samples from 2010 to 2018 using a standard 127
protocol. A total of 1,792 pigs (881 Duroc, 204 Korean native, and 707 Woori black) were genotyped 128
using the Illumina PorcineSNP60 v2 BeadChip panel, which comprised 61,565 single nucleotide
129 5
4th thoracic vertebrae), mid-back (on the last thoracic vertebrae), and loin (on the last lumbar vertebrae). 105
Approximately four to six female pigs were kept in a pen. Alternatively, one or two male pigs from the 106
same litter were kept in a pen to calculate feed intake. Feed disappearance from each pen was recorded 107
during performance tests to calculate average daily feed intake (ADFI). FCR was calculated as ADFI 108
divided by ADG. DAY and BF were calculated as follows [11]: 109
110
DAY = age at the test + ሺ – ୠ୭ୢ୷ ୵ୣ୧୦୲ ୟ୲ ୲୦ୣ ୲ୣୱ୲ሻ ൈ ሺୟୣ ୟ୲ ୲୦ୣ ୲ୣୱ୲ – ଷ଼ሻ ୠ୭ୢ୷ ୵ୣ୧୦୲ ୟ୲ ୲୦ୣ ୲ୣୱ୲ 111
112
BF = ABF + ሺ ି ୠ୭ୢ୷ ୵ୣ୧୦୲ ୟ୲ ୲୦ୣ ୲ୣୱ୲ሻ ൈ ሺሻ ሺୠ୭ୢ୷ ୵ୣ୧୦୲ ୟ୲ ୲୦ୣ ୲ୣୱ୲ – ଵଵ.ଷସሻ 113
114
BF (Korean native) = ABF + ሺ ି ୠ୭ୢ୷ ୵ୣ୧୦୲ ୟ୲ ୲୦ୣ ୲ୣୱ୲ሻ ൈ ሺሻ ሺୠ୭ୢ୷ ୵ୣ୧୦୲ ୟ୲ ୲୦ୣ ୲ୣୱ୲ ି ସ.ଷሻ 115
116
RFI was obtained as the difference between the observed and predicted ADFI [12]: 117
118
ADFI = μ+b1ADG+b2BF+b3AGEonset +e,
119 120
where AGEonset is the age at which the animal was tested; b1, b2, and b3 are the linear coefficients of the
121
regression for covariates; and e is the RFI. The phenotypic dataset, which included DAY, BF, FCR, and 122
RFI, was obtained from performance tests (Table 2). Korean native pigs had records only for DAY and 123 BF. 124 125 Genotyping of animals 126
The genomic DNA of pigs was extracted from their blood samples from 2010 to 2018 using a standard 127
protocol. A total of 1,792 pigs (881 Duroc, 204 Korean native, and 707 Woori black) were genotyped 128
using the Illumina PorcineSNP60 v2 BeadChip panel, which comprised 61,565 single nucleotide 129
Table 1. Number of animals and pedigree information of each breed
Item Duroc Korean native WooriHeukDon
Birth year 1995 to 2018 1995 to 2018 2008 to 2018
Number of founders 297 29 61
Number of individuals 13,031 1,529 2,267
Longest ancestral path 19 14 10
Family (Full-sib groups) size 2 to 21 2 to 14 2 to 19
www.animbiosci.org 969
Hong et al(2021) Anim Biosci 34:967-974
BF (Korean native)
5
Approximately four to six female pigs were kept in a pen. Alternatively, one or two male pigs from the 106
same litter were kept in a pen to calculate feed intake. Feed disappearance from each pen was recorded 107
during performance tests to calculate average daily feed intake (ADFI). FCR was calculated as ADFI 108
divided by ADG. DAY and BF were calculated as follows [11]: 109
110
DAY = age at the test + ሺ – ୠ୭ୢ୷ ୵ୣ୧୦୲ ୟ୲ ୲୦ୣ ୲ୣୱ୲ሻ ൈ ሺୟୣ ୟ୲ ୲୦ୣ ୲ୣୱ୲ – ଷ଼ሻ ୠ୭ୢ୷ ୵ୣ୧୦୲ ୟ୲ ୲୦ୣ ୲ୣୱ୲ 111
112
BF = ABF + ሺ ି ୠ୭ୢ୷ ୵ୣ୧୦୲ ୟ୲ ୲୦ୣ ୲ୣୱ୲ሻ ൈ ሺሻ ሺୠ୭ୢ୷ ୵ୣ୧୦୲ ୟ୲ ୲୦ୣ ୲ୣୱ୲ – ଵଵ.ଷସሻ 113
114
BF (Korean native) = ABF + ሺ ି ୠ୭ୢ୷ ୵ୣ୧୦୲ ୟ୲ ୲୦ୣ ୲ୣୱ୲ሻ ൈ ሺሻ ሺୠ୭ୢ୷ ୵ୣ୧୦୲ ୟ୲ ୲୦ୣ ୲ୣୱ୲ ି ସ.ଷሻ 115
116
RFI was obtained as the difference between the observed and predicted ADFI [12]: 117
118
ADFI = μ+b1ADG+b2BF+b3AGEonset +e,
119 120
where AGEonset is the age at which the animal was tested; b1, b2, and b3 are the linear coefficients of the
121
regression for covariates; and e is the RFI. The phenotypic dataset, which included DAY, BF, FCR, and 122
RFI, was obtained from performance tests (Table 2). Korean native pigs had records only for DAY and 123 BF. 124 125 Genotyping of animals 126
The genomic DNA of pigs was extracted from their blood samples from 2010 to 2018 using a standard 127
protocol. A total of 1,792 pigs (881 Duroc, 204 Korean native, and 707 Woori black) were genotyped 128
using the Illumina PorcineSNP60 v2 BeadChip panel, which comprised 61,565 single nucleotide 129
RFI was obtained as the difference between the observed and predicted ADFI [12]:
ADFI = μ+b1ADG+b2BF+b3AGEonset+e,
where AGEonset is the age at which the animal was tested; b1, b2, and b3 are the linear coefficients of the regression for co-variates; and e is the RFI. The phenotypic dataset, which included DAY, BF, FCR, and RFI, was obtained from perfor-mance tests (Table 2). Korean native pigs had records only for DAY and BF.
Genotyping of animals
The genomic DNA of pigs was extracted from their blood samples from 2010 to 2018 using a standard protocol. A total of 1,792 pigs (881 Duroc, 204 Korean native, and 707 WooriHeukDon) were genotyped using the Illumina Por-cineSNP60 v2 BeadChip panel, which comprised 61,565 single nucleotide polymorphism (SNP) markers [13]. The quality control of the SNP markers included deletion of in-dividuals with parent–progeny Mendelian conflicts or with a missing rate of >0.90, and removal of monomorphic SNP genotypes, and SNPs located on sex chromosomes, with minor allele frequency (MAF)<0.05, genotype call rates of <0.90, and Hardy–Weinberg equilibrium of 0.15 [14]. After quality control, the final dataset contained genotypes from 1,771 pigs (878 Duroc, 196 Korean native, and 697 Woori-HeukDon pigs). The total number of autosomal SNPs was reduced to 42,486.
Genetic parameter estimation
Genetic correlation (rpc) of performance between purebred
and WooriHeukDon pigs was estimated for corresponding traits (e.g., DAY in Duroc and WooriHeukDon pigs) and different traits (e.g., DAY in Duroc and RFI in WooriHeuk-Don pigs). Genetic (rg) and phenotypic (rp) correlations between different traits were estimated within breeds. The variances and covariances of the studied traits were estimated by an animal multi-trait (10 traits) model that applied the Bayesian inference using GIBBS2F90 [15]. The Gibbs samplers were run as single chains of 220,000 rounds. The first 20,000 rounds were discarded as burn-in, thinning every 20 samples. This resulted in 10,000 samples being used for post-Gibbs analyses, which were completed using POSTGIBBSF90 [15].
The effects of sex (male or female) on both DAY and BF and birth year- month (134 levels) were fitted as fixed effects. The models also included the random effects of birth litter (2,790 levels). Animals were fitted as a random effect in the model. The statistical model for each group of traits was as follows:
y = Xb+Za+Wc+e,
in which y is the vector of observations; X, Z, and W are the corresponding incidence matrices; b is the vector of fixed effects; a is the vector of random additive genetic effects (breeding values),
6
polymorphism (SNP) markers [13]. The quality control of the SNP markers included deletion of 130
individuals with parent–progeny Mendelian conflicts or with a missing rate of >0.90, and removal of 131
monomorphic SNP genotypes, and SNPs located on sex chromosomes, with minor allele frequency 132
(MAF)<0.05, genotype call rates of <0.90, and Hardy–Weinberg equilibrium of 0.15 [14]. After QC
133
(Please write it in full form.), the final dataset contained genotypes from 1,771 pigs (878 Duroc, 196 134
Korean native, and 697 Woori black pigs). The total number of autosomal SNPs was reduced to 42,486. 135
136
Genetic parameter estimation
137
Genetic correlation (rpc) of performance between purebred and Woori black pigs was estimated for 138
corresponding traits (e.g., DAY in Duroc and Woori black pigs) and different traits (e.g., DAY in Duroc 139
and RFI in Woori black pigs). Genetic (rg) and phenotypic (rp) correlations between different traits were 140
estimated within breeds. 141
The variances and covariances of the studied traits were estimated by an animal multi-trait (10 traits) 142
model that applied the Bayesian inference using GIBBS2F90 [15]. The Gibbs samplers were run as 143
single chains of 220,000 rounds. The first 20,000 rounds were discarded as burn-in, thinning every 20 144
samples. This resulted in 10,000 samples being used for post-Gibbs analyses, which were completed 145
using POSTGIBBSF90 [15]. 146
The effects of sex (male or female) on both DAY and BF and birth year- month (134 levels) were 147
fitted as fixed effects. The models also included the random effects of birth litter (2,790 levels). Animals 148
were fitted as a random effect in the model. The statistical model for each group of traits was as follows: 149
150
� � �� � �� � �� � �, 151
152
in which y is the vector of observations; X, Z, and W are the corresponding incidence matrices; b is the
153
vector of fixed effects; a is the vector of random additive genetic effects (breeding values), 154
𝒂𝒂 ~��0, 𝑯𝑯 𝑯 𝑯��; c is the vector of random birth litter, 𝒄𝒄 ~��0, 𝑰𝑰 𝑯 𝑯��; and e is the vector of 155 ; c is the vector of random
birth litter, 6
polymorphism (SNP) markers [13]. The quality control of the SNP markers included deletion of 130
individuals with parent–progeny Mendelian conflicts or with a missing rate of >0.90, and removal of 131
monomorphic SNP genotypes, and SNPs located on sex chromosomes, with minor allele frequency 132
(MAF)<0.05, genotype call rates of <0.90, and Hardy–Weinberg equilibrium of 0.15 [14]. After QC
133
(Please write it in full form.), the final dataset contained genotypes from 1,771 pigs (878 Duroc, 196 134
Korean native, and 697 Woori black pigs). The total number of autosomal SNPs was reduced to 42,486. 135
136
Genetic parameter estimation
137
Genetic correlation (rpc) of performance between purebred and Woori black pigs was estimated for 138
corresponding traits (e.g., DAY in Duroc and Woori black pigs) and different traits (e.g., DAY in Duroc 139
and RFI in Woori black pigs). Genetic (rg) and phenotypic (rp) correlations between different traits were 140
estimated within breeds. 141
The variances and covariances of the studied traits were estimated by an animal multi-trait (10 traits) 142
model that applied the Bayesian inference using GIBBS2F90 [15]. The Gibbs samplers were run as 143
single chains of 220,000 rounds. The first 20,000 rounds were discarded as burn-in, thinning every 20 144
samples. This resulted in 10,000 samples being used for post-Gibbs analyses, which were completed 145
using POSTGIBBSF90 [15]. 146
The effects of sex (male or female) on both DAY and BF and birth year- month (134 levels) were 147
fitted as fixed effects. The models also included the random effects of birth litter (2,790 levels). Animals 148
were fitted as a random effect in the model. The statistical model for each group of traits was as follows: 149
150
� � �� � �� � �� � �, 151
152
in which y is the vector of observations; X, Z, and W are the corresponding incidence matrices; b is the
153
vector of fixed effects; a is the vector of random additive genetic effects (breeding values), 154
𝒂𝒂 ~��0, 𝑯𝑯 𝑯 𝑯��; c is the vector of random birth litter, 𝒄𝒄 ~��0, 𝑰𝑰 𝑯 𝑯��; and e is the vector of
155 ; and e is the vector of residuals,
7
residuals, 𝒆𝒆 ~��0, 𝑰𝑰 𝑰 𝑰��. The H matrix in the single-step method defines the relationship of the 156
genomic and pedigree information. The inverse H matrix is rather simple in structure [16,17] and can
157 be written as: 158 159 H-1 = A-1 + �0 0 0 𝐆𝐆��� � �� ���, 160 161
Where the A22 matrix is only for genotyped animals, A is the relationship matrix among individuals 162
based on pedigree information, and G is the relationship matrix among individuals based on genomic
163
information. The G matrix was built according to PM VanRaden [18]. Both A22 and G were 164
subsequently combined, because the two matrices were similar. I is an identity matrix of appropriate
165
dimensions. Phenotype variance is the sum of random and residual variances. Heritability (h2) was 166
calculated as the additive genetic variance divided by the phenotype variance. 167 168 RESULTS 169 170 Heritability estimation 171
Heritability (h2) obtained from the studied model is presented in Table 2. In Duroc pigs, heritability was 172
high (h2 > 0.5) for RFI, and moderate (h2 = 0.2–0.5) for DAY, BF, and FCR. In Woori black pigs, all 173
traits were moderately heritable. Heritability estimates in Korean native pigs were high for DAY and 174
BF. Across the breeds, heritability estimates for DAY (0.36 ± 0.05) and BF (0.38 ± 0.06) in Woori black 175
pigs were higher than those in Duroc pigs (DAY 0.31 ± 0.03 and BF 0.30 ± 0.03), whereas heritability 176
estimates for FCR (0.48 ± 0.08) and RFI (0.48 ± 0.07) in Woori black pigs were somewhat lower than 177
those in Duroc pigs (FCR 0.49 ± 0.04 and RFI 0.51±0.04). Korean native pigs had nearly twice the 178
estimated heritability compared with the other breeds for both DAY (0.57 ± 0.06) and BF (0.76 ± 0.06). 179
180
. The H matrix in the single-step method defines the relationship of the genomic and pedigree infor-mation. The inverse H matrix is rather simple in structure [16,17] and can be written as:
7
residuals, 𝒆𝒆 ~��0, 𝑰𝑰 𝑰 𝑰��. The H matrix in the single-step method defines the relationship of the
156
genomic and pedigree information. The inverse H matrix is rather simple in structure [16,17] and can
157 be written as: 158 159 H-1 = A-1 + �0 0 0 𝐆𝐆��� � �� ���, 160 161
Where the A22 matrix is only for genotyped animals, A is the relationship matrix among individuals
162
based on pedigree information, and G is the relationship matrix among individuals based on genomic
163
information. The G matrix was built according to PM VanRaden [18]. Both A22 and G were
164
subsequently combined, because the two matrices were similar. I is an identity matrix of appropriate
165
dimensions. Phenotype variance is the sum of random and residual variances. Heritability (h2) was
166
calculated as the additive genetic variance divided by the phenotype variance. 167 168 RESULTS 169 170 Heritability estimation 171
Heritability (h2) obtained from the studied model is presented in Table 2. In Duroc pigs, heritability was
172
high (h2 > 0.5) for RFI, and moderate (h2 = 0.2–0.5) for DAY, BF, and FCR. In Woori black pigs, all
173
traits were moderately heritable. Heritability estimates in Korean native pigs were high for DAY and 174
BF. Across the breeds, heritability estimates for DAY (0.36 ± 0.05) and BF (0.38 ± 0.06) in Woori black 175
pigs were higher than those in Duroc pigs (DAY 0.31 ± 0.03 and BF 0.30 ± 0.03), whereas heritability 176
estimates for FCR (0.48 ± 0.08) and RFI (0.48 ± 0.07) in Woori black pigs were somewhat lower than 177
those in Duroc pigs (FCR 0.49 ± 0.04 and RFI 0.51±0.04). Korean native pigs had nearly twice the 178
estimated heritability compared with the other breeds for both DAY (0.57 ± 0.06) and BF (0.76 ± 0.06). 179
180
,
Where the A22 matrix is only for genotyped animals, A is Table 2. Number of observations (N), mean, standard deviation (SD) for phenotype and heritability
Breed Trait N Phenotype Heritability
Mean SD Mean SD 95% HPD1) Duroc DAY 12,412 138.73 11.92 0.31 0.03 0.26–0.36 BF 12,292 12.48 1.92 0.30 0.03 0.24–0.36 FCR 4,578 2.30 0.30 0.49 0.04 0.42–0.58 RFI 2,307 165.47 152.05 0.51 0.04 0.43–0.59 WooriHeukDon DAY 2,063 148.84 12.68 0.36 0.05 0.25–0.46 BF 2,048 16.60 3.71 0.38 0.06 0.27–0.50 FCR 551 2.36 0.39 0.48 0.08 0.32–0.64 RFI 290 98.41 88.49 0.48 0.07 0.35–0.62
Korean native DAY 1,427 192.42 24.70 0.57 0.06 0.45–0.69
BF 1,414 20.58 4.09 0.76 0.06 0.65–0.87
DAY, day of target weight; BF, backfat thickness; FCR, feed conversion rate; RFI, residual feed intake.
970 www.animbiosci.org
Hong et al(2021) Anim Biosci 34:967-974
the relationship matrix among individuals based on pedigree information, and G is the relationship matrix among indi-viduals based on genomic information. The G matrix was built according to PM VanRaden [18]. Both A22 and G were subsequently combined, because the two matrices were similar. I is an identity matrix of appropriate dimensions. Phenotype variance is the sum of random and residual vari-ances. Heritability (h2) was calculated as the additive genetic variance divided by the phenotype variance.
RESULTS
Heritability estimation
Heritability (h2) obtained from the studied model is present-ed in Table 2. In Duroc pigs, heritability was high (h2>0.5) for RFI, and moderate (h2 = 0.2 to 0.5) for DAY, BF, and FCR. In WooriHeukDon pigs, all traits were moderately herita-ble. Heritability estimates in Korean native pigs were high for DAY and BF. Across the breeds, heritability estimates for DAY (0.36±0.05) and BF (0.38±0.06) in WooriHeukDon pigs were higher than those in Duroc pigs (DAY 0.31±0.03 and BF 0.30±0.03), whereas heritability estimates for FCR (0.48 ±0.08) and RFI (0.48±0.07) in WooriHeukDon pigs were somewhat lower than those in Duroc pigs (FCR 0.49
±0.04 and RFI 0.51±0.04). Korean native pigs had nearly twice the estimated heritability compared with the other breeds for both DAY (0.57±0.06) and BF (0.76±0.06). Genetic correlation between traits within breeds The rg estimates within breeds are given in Table 3. The rg es-timates between traits were typically low to moderate for all breeds, although this was not the case for rg between FCR and RFI. Additionally, the association of RFI with other traits was weaker than with FCR. The rg between DAY and BF was low, and ranged from 0.07 to 0.10. In both Duroc and WooriHeukDon pigs, the rg of DAY was moderately positive (0.25 to 0.38) with FCR but negative (–0.16 to –0.26) with RFI. BF was weakly associated (0.02 to 0.07) with FCR and RFI in Duroc pigs. Alternatively, in WooriHeukDon pigs, BF also had low rg (0.06) with RFI but moderate rg (0.34) with FCR. FCR was strongly positively associated (0.61 to 0.81) with RFI in both Duroc and WooriHeukDon pigs. Purebred–synthetic genetic correlations
The rpc estimates are presented in in Table 4. The rpc estimates within traits were low (less than 0.10) for DAY and BF. In Duroc and WooriHeukDon pigs, there were strong corre-lations for RFI and FCR; the rpc estimates were 0.99 for RFI Table 3. Posterior mean for genetic correlations (upper diagonal) and phenotypic correlations (lower diagonal) between traits
Breed Trait DAY BF FCR RFI
Duroc DAY - 0.08 0.07 0.25 0.07 –0.16 0.08 BF 0.120.01 - 0.07 0.07 0.02 0.07 FCR 0.430.02 0.00 0.00 - 0.87 0.02 RFI –0.010.02 –0.01 0.02 0.84 0.01 -WooriHeukDon DAY - 0.27 0.12 0.38 0.13 –0.26 0.18 BF 0.200.03 - 0.34 0.14 0.06 0.17 FCR 0.460.04 0.25 0.05 - 0.61 0.10 RFI –0.110.06 –0.06 0.06 0.34 0.06
-Korean native DAY - 0.07 0.10 -
-BF 0.100.06 - -
-DAY, day of target weight; BF, backfat thickness; FCR, feed conversion rate; RFI, residual feed intake. Posterior standard deviations are given as subscripts.
Table 4. Posterior mean for genetic correlations (rpc) between purebred and WooriHeukDon traits
Breed Trait WooriHeukDon
DAY BF FCR RFI
Duroc DAY 0.050.19 –0.080.17 –0.110.14 –0.160.08
BF –0.100.14 0.020.14 –0.020.11 0.020.07
FCR –0.210.20 0.030.17 0.530.12 0.860.02
RFI –0.260.18 0.060.17 0.610.10 0.990.00
Korean native DAY 0.070.12 0.010.12 0.040.10 –0.010.08
BF 0.030.08 0.010.08 0.020.07 0.000.05
DAY, day of target weight; BF, backfat thickness; FCR, feed conversion rate; RFI, residual feed intake. Posterior standard deviations are given as subscripts. The rpc within traits are given as bold.
www.animbiosci.org 971 and 0.64 for FCR. For rpc estimates between different traits,
DAY in WooriHeukDon pigs was more correlated with both FCR and RFI than DAY in Duroc pigs. The rpc estimates for DAY in WooriHeukDon pigs were –0.21 for FCR and –0.26 for RFI of Duroc pigs.
DISCUSSION
Heritability and genetic correlation within breeds The heritability of growth and BF have been reported in many studies. In general, growth traits have moderate heri-tability, whereas BF has moderate to high heritability [11,19-22]. In this study, DAY and BF also had moderate heritability in Duroc and WooriHeukDon pigs (Table 2). The higher heritability estimates for DAY and BF in Korean native pigs was consistent with previously published estimates [23,24]. Estimated heritabilities for feed efficiency (FCR, RFI) were close to 0.5 in both breeds and somewhat higher than those (0.30 to 0.42) of previous studies [25-28].
Our low to moderate genetic correlations between DAY and BF in all breeds (Table 3) coincided with those of previ-ous studies [11,22,29]. In Duroc and WooriHeukDon pigs, FCR was favorably genetically correlated with DAY and BF. This result is consistent with previous reports of FCR being negatively related to growth and positively related to BF [8,30]. However, because ratio traits such as FCR are not ideal for elucidating feed efficiency [31], RFI is a commonly used to measure feed efficiency. In this study, the genetic correlation between FCR and RFI was very high in Duroc pigs, which indicated that this correlation was greater in the sire than other lines [30]. RFI is more independent of production than FCR in Duroc and WooriHeukDon pigs. Additionally, the genetic correlations of RFI were low with BF but some-what moderate with DAY in Duroc and WooriHeukDon pigs. Generally, RFI has a neutral relationship with other traits [8]. In particular, superior breeds for growth and lean meat, such as Pietrain pigs, had a more neutral relationship between RFI and other growth traits [30,32]. However, RFI can also have a slightly unfavorable relationship with growth [12,33-35]. RFI in WooriHeukDon pigs has a more unfavor-able relationship with growth compared with that in Duroc pigs; this means that the faster WooriHeukDon pigs grow, the more they consume to maintain energy. WooriHeuk-Don pigs have slower growth and more backfat than Duroc pigs (Table 2) because were developed by the genetic char-acteristics of both Duroc and Korean native pigs. Therefore, there might be differences in the genetic relationship be-tween RFI and growth based on breed characteristics. Genetic correlation between purebred and synthetic performance
The rpc for DAY and BF were lower than 0.1 (Table 4), and
these values were substantially different from those produced by other studies that estimated rpc between purebred and crossbred performance for growth traits. Wientjes and Calus [1] reviewed existing literature that report rpc estimates in pigs, and noted that the average rpc was 0.66 for growth traits and 0.69 for backfat. A low rpc may occur because of bio-logical differences, genotype-by-environment interactions, and the different definition of the considered trait [1,35,36]. In this study, there should be no genotype-by-environment interactions for rpc because all pigs were tested in the same environmental facility. The weighting criterion of Korean native pigs (70 kg) differed from that of WooriHeukDon pigs (90 kg), which might be one factor that contributed to the very low rpc between the two breeds. Additionally, un-like most crossbred pigs, WooriHeukDon pigs are a product of a more complex combination of crosses and have their own generations, which could have resulted in biological differences from purebreds. Duroc and WooriHeukDon pigs are selected based on the same traits, DAY and BF. How-ever, crossbreed genomic information is made up of a mosaic of genomic regions inherited from different breeds, and there might be different allele effects for the same trait [37]. Unlike WooriHeukDon pigs, Korean native pigs have only been selected for their genetic diversity, which could also result in different selection signals between Korean native and WooriHeukDon pigs [7].
However, the rpc for RFI between Duroc and WooriHeu-kDon pigs was very strong and close to 1 (Table 4). This indicated that there could be substantial differences in rpc of traits in synthetic pigs, unlike in other crossbred pigs. Feed efficiency is complex and includes two or more traits, and it is more essential for metabolism than other growth traits. High of rpc values for feed efficiency have also been obtained in previous studies [5,6,35,38,39]. RFI is related to nutrient utilization and energy digestibility, and selec-tion based on RFI could improve various funcselec-tions that use energy and nutrients [8,9]. There are various reports about the potential importance of low RFI in pigs, such as high anti-oxidant defenses in the mitochondria of body [40], superior ability to cope with stress-related behavioral reactivity [41], and low levels of viremia when infected with porcine reproductive and respiratory syndrome virus [42]. These biologically important characteristics in Duroc pigs, such as nutrient utilization and disease resistance, might also be found in WooriHeukDon pigs. Because the number of similar SNP regions was related to rpc of the trait [37], Duroc and WooriHeukDon pigs might have many common regions for RFI. The impact of breed-specific SNP effects in purebred and synthetic pigs needs further study, because our study did not estimate SNP effects for each breed. To the best of our knowledge, this is the first report of rpc between different traits in pigs. However, there was some
972 www.animbiosci.org
Hong et al(2021) Anim Biosci 34:967-974
limitations of our study with small data sets in both local breeds (Korean native and WooriHeukDon). Especially, the most of rpc were estimated with high standard deviation. Therefore, our results also indicated the value of further analysis with a greater population to obtain a more robust estimation of rpc between purebred and synthetic pigs.
CONCLUSION
The objective of this study was to estimate rpc of growth per-formance (DAY, BF, FCR, and RFI) between synthetic (WooriHeukDon) and purebred (Duroc and Korean native) pigs. The rpc was lower than 0.1 for DAY and BF but high for FCR and RFI. In particular, rpc of RFI was close to 1. The results indicated that there were substantial differences in rpc of traits in the synthetic WooriHeukDon pigs, which could be caused by these pigs having a more complex origin than other crossbred pigs. We conclude that the RFI of Duroc pigs was strongly correlated with that of WooriHeukDon pigs, and these breeds might have a lot of common regions related to RFI. RFI is more essential for metabolism than other growth traits and these metabolic characteristics in purebred pigs, such as nutrient utilization, could signifi-cantly affect those in synthetic pigs. The findings of this study can be used to elucidate crossbred genetic architec-ture and help develop new breeds with particular target traits.
CONFLICT OF INTEREST
We certify that there is no conflict of interest with any financial organization regarding the material discussed in the manu-script.
ACKNOWLEDGMENTS
This work was supported by the National Institute of Animal Science, Rural Development Administration in Korea, and formed part of an internal project (PJ01263601). We thank Mallory Eckstut, PhD, from Edanz Group (https://en-author -services.edanzgroup.com/) for editing a draft of this manu-script.
REFERENCES
1. Wientjes YCJ, Calus MPL. Board invited review: the purebred-crossbred correlation in pigs: a review of theory, estimates, and implications. J Anim Sci 2017;95:3467-78. https://doi. org/10.2527/jas.2017.1669
2. Juarez M, Clemente I, Polvillo O, Molina A. Meat quality of tenderloin from Iberian pigs as affected by breed strain and crossbreeding. Meat Sci 2009;81:573-9. https://doi.org/10.
1016/j.meatsci.2008.10.016
3. Wei M, van der Werf JHJ. Maximizing genetic response in crossbreds using both purebred and crossbred information. Anim Sci 1994;59:401-13. https://doi.org/10.1017/S000335 6100007923
4. Bijma P, van Arendonk JAM. Maximizing genetic gain for the sire line of a crossbreeding scheme utilizing both purebred and crossbred information. Anim Sci 1998;66:529-42. https:// doi.org/10.1017/S135772980000970X
5. Tusell L, Gilbert H, Riquet J, Mercat MJ, Legarra A, Larzul C. Pedigree and genomic evaluation of pigs using a terminal-cross model. Genet Sel Evol 2016;48:32. https://doi.org/10. 1186/s12711-016-0211-3
6. Habier D, Götz KU, Dempfle L. Estimation of genetic para-meters on test stations using purebred and crossbred progeny of sires of the Bavarian Piétrain. Livest Sci 2007;107:142-51. https://doi.org/10.1016/j.livsci.2006.09.012
7. Edea Z, Hong JK, Jung JH, et al. Detecting selection signatures between Duroc and Duroc synthetic pig populations using high‐density SNP chip. Anim Genet 2017;48:473-7. https:// doi.org/10.1111/age.12559
8. Gilbert H, Billon Y, Brossard L, et al. Review: divergent selec-tion for residual feed intake in the growing pig. Animal 2017;11:1427-39. https://doi.org/10.1017/S175173111600 286X
9. Harris AJ, Patience JF, Lonergan SM, Dekkers CJM, Gabler NK. Improved nutrient digestibility and retention partially explains feed efficiency gains in pigs selected for low residual feed intake. J Anim Sci 2012;90(Suppl 4):164-6. https://doi. org/10.2527/jas.53855
10. Sargolzaei M, Iwaisaki H, Colleau JJ. CFC: a tool for monitoring genetic diversity. In: 8th World Congress on Genetics Applied to Livestock Production; 2006 Aug 13-18: Belo Horizonte, MG, Brasil.
11. Choi JG, Cho CI, Choi IS, et al. Genetic parameter estimation in seedstock Swine population for growth performances. Asian-Australas J Anim Sci 2013;26:470-5. https://doi.org/ 10.5713/ajas.2012.12454
12. Cai W, Casey DS, Dekkers JCM. Selection response and gene tic parameters for residual feed intake in Yorkshire swine. J Anim Sci 2008;86:287-98. https://doi.org/10.2527/ jas.2007-0396
13. Ramos AM, Crooijmans RPMA, Affara NA, et al. Design of a high density SNP genotyping assay in the pig using snps identified and characterized by next generation sequencing technology. PLoS One 2009;4:e6524. https://doi.org/10.1371/ journal.pone.0006524
14. Wiggans GR, Sonstegard TS, VanRaden PM, et al. Selection of single-nucleotide polymorphisms and quality of genotypes used in genomic evaluation of dairy cattle in the United States and Canada. J Dairy Sci 2009;92:3431-6. https://doi. org/10.3168/jds.2008-1758
www.animbiosci.org 973 15. Misztal I, Tsuruta S, Strabel T, Auvray B, Druet T, Lee DH.
BLUPF90 and related programs (BGF90). In: Proceedings of the 7th world congress on genetics applied to livestock production. 2002. pp. 743-4.
16. Christensen OF, Lund MS. Genomic prediction when some animals are not genotyped. Genet Sel Evol 2010;42:2. https:// doi.org/10.1186/1297-9686-42-2
17. Aguilar I, Misztal I, Johnson DL, Legarra A, Tsuruta S, Lawlor TJ. Hot topic: a unified approach to utilize phenotypic, full pedigree, and genomic information for genetic evaluation of Holstein final score. J Dairy Sci 2010;93:743-52. https://doi. org/10.3168/jds.2009-2730
18. VanRaden PM. Efficient methods to compute genomic pre-dictions. J Dairy Sci 2008;91:4414-23. https://doi.org/10. 3168/jds.2007-0980
19. Choy YH, Mahboob A, Cho CI, et al. Genetic parameters of pre-adjusted body weight growth and ultrasound measures of body tissue development in three seedstock pig breed populations in Korea. Asian-Australas J Anim Sci 2015;28: 1696-702. https://doi.org/10.5713/ajas.14.0971
20. Noguera JL, Varona L, Babot D, Estany J. Multivariate analysis of litter size for multiple parities with production traits in pigs: I. Bayesian variance component estimation. J Anim Sci 2002;80:2540-7. https://doi.org/10.1093/ansci/80.10.2540 21. Arango J, Misztal I, Tsuruta S, Culbertson M, Herring W.
Threshold-linear estimation of genetic parameters for farrow-ing mortality, litter size, and test performance of Large White sows. J Anim Sci 2005;83:499-506. https://doi.org/10.2527/ 2005.833499x
22. Chen P, Baas TJ, Mabry JW, Dekkers JCM, Koehler KJ. Genetic parameters and trends for lean growth rate and its compo-nents in U.S. Yorkshire, Duroc, Hampshire, and Landrace pigs. J Anim Sci 2002;80:2062-70. https://doi.org/10.1093/ ansci/80.8.2062
23. Suzuki K, Ishida M, Kadowaki H, Shibata T, Uchida H, Nishida A. Genetic correlations among fatty acid compositions in different sites of fat tissues, meat production, and meat quality traits in Duroc pigs. J Anim Sci 2006;84:2026-34. https://doi. org/10.2527/jas.2005-660
24. Hicks C, Satoh M, Ishii K, Kuroki S, Fujiwara T, Furukawa T. Effect of sex on estimates of genetic parameters for daily gain and ultrasonic backfat thickness in swine. Asian-Australas J Anim Sci 1999;12:677-81. https://doi.org/10.5713/ajas.1999. 677
25. Hoque MA, Kadowaki H, Shibata T, Oikawa T, Suzuki K. Genetic parameters for measures of residual feed intake and growth traits in seven generations of Duroc pigs. Livest Sci 2009;121:45-9. https://doi.org/10.1016/j.livsci.2008.05.016 26. Mrode RA, Kennedy BW. Genetic variation in measures of
food efficiency in pigs and their genetic relationships with growth rate and backfat. Anim Sci 1993;56:225-32. https:// doi.org/10.1017/S0003356100021309
27. Kadarmideen HN, Schwörer D, Ilahi H, Malek M, Hofer A. Genetics of osteochondral disease and its relationship with meat quality and quantity, growth, and feed conversion traits in pigs. J Anim Sci 2004;82:3118-27. https://doi.org/10.2527/ 2004.82113118x
28. Do DN, Strathe AB, Jensen J, Mark T, Kadarmideen HN. Genetic parameters for different measures of feed efficiency and related traits in boars of three pig breeds. J Anim Sci 2013; 91:4069-79. https://doi.org/10.2527/jas.2012-6197
29. Li X, Kennedy BW. Genetic parameters for growth rate and backfat in Canadian Yorkshire, Landrace, Duroc, and Hamp-shire pigs. J Anim Sci 1994;72:1450-4. https://doi.org/10. 2527/1994.7261450x
30. Saintilan R, Mérour I, Brossard L, et al. Genetics of residual feed intake in growing pigs: relationships with production traits, and nitrogen and phosphorus excretion traits. J Anim Sci 2013;91:2542-54. https://doi.org/10.2527/jas.2012-5687 31. Gunsett FC. Linear index selection to improve traits defined
as ratios. J Anim Sci 1984;59:1185-93. https://doi.org/10. 2527/jas1984.5951185x
32. Saintilan R, Mérour I, Schwob S, Sellier P, Bidanel J, Gilbert H. Genetic parameters and halothane genotype effect for residual feed intake in Piétrain growing pigs. Livest Sci 2011; 142:203-9. https://doi.org/10.1016/j.livsci.2011.07.013 33. Boddicker N, Gabler NK, Spurlock ME, Nettleton D, Dekkers
JCM. Effects of ad libitum and restricted feed intake on growth performance and body composition of Yorkshire pigs selected for reduced residual feed intake. J Anim Sci 2011;89:40-51. https://doi.org/10.2527/jas.2010-3106 34. Kennedy BW, van der Werf JH, Meuwissen TH. Genetic and
statistical properties of residual feed intake. J Anim Sci 1993; 71:3239-50. https://doi.org/10.2527/1993.71123239x 35. Godinho RM, Bergsma R, Silva FF, et al. Genetic correlations
between feed efficiency traits, and growth performance and carcass traits in purebred and crossbred pigs. J Anim Sci 2018;96:817-29. https://doi.org/10.1093/jas/skx011
36. Robertson A. The sampling variance of the genetic correl-ation coefficient. Biometrics 1959;15:469-85. https://doi. org/10.2307/2527750
37. Sevillano CA, ten Napel J, Guimarães SEF, Silva FF, Calus MPL. Effects of alleles in crossbred pigs estimated for genomic prediction depend on their breed-of-origin. BMC Genomics 2018;19:740. https://doi.org/10.1186/s12864-018-5126-7 38. Nakavisut S, Crump R, Suarez M, Graser HU. Genetic
correl-ations between the performance of purebred and crossbred pigs. In: Proceedings of the Association for the Advancement of Animal Breeding and Genetics. 2005. pp. 99-102. 39. Godinho RM, Bergsma R, Silva FF, et al. Genetic correlations
between feed efficiency traits, and growth performance and carcass traits in purebred and crossbred pigs. J Anim Sci 2018; 96:817-29. https://doi.org/10.1093/jas/skx011
974 www.animbiosci.org
Hong et al(2021) Anim Biosci 34:967-974
Gabler NK, Lonergan SM. Divergent genetic selection for residual feed intake impacts mitochondria reactive oxygen species production in pigs. J Anim Sci 2013;91:2133-40. https://doi.org/10.2527/jas.2012-5894
41. Colpoys JD, Abell CE, Young JM, et al. Effects of genetic selection for residual feed intake on behavioral reactivity of castrated male pigs to novel stimuli tests. Appl Anim Behav
Sci 2014;159:34-40. https://doi.org/10.1016/j.applanim.2014. 06.013
42. Dunkelberger JR, Boddicker NJ, Serao NVL, Young JM, Rowland RRR, Dekkers JCM. Response of pigs divergently selected for residual feed intake to experimental infection with the PRRS virus. Livest Sci 2015;177:132-41. https://doi. org/10.1016/j.livsci.2015.04.014