A Hybrid Mod K-Means Clustering with Mod SVM Algorithm to Enhance the
Cancer Prediction
Rethina Kumar * 1, Gopinath Ganapathy ** 2, Jeong-Jin Kang *** 3
1
* Assistant Professor, Dept of Information and Communication, Dong Seoul University, Korea.
Research Scholar, Bharathidasan University, India.
2
** Professor, Registrar, Bharathidasan University, India.
3
*** Professor, Dept. of Information and Communication, Dong Seoul University, Seongnam,
Korea.
E-mail: [email protected]*
1, [email protected]**
2, [email protected]***
3Abstract
In Recent years the way we analyze the breast cancer has changed dramatically. Breast cancer is the most common and complex disease diagnosed among women. There are several subtypes of breast cancer and many options are there for the treatment. The most important is to educate the patients. As the research continues to expand, the understanding of the disease and its current treatments types, the researchers are constantly being updated with new researching techniques. Breast cancer survival rates have been increased with the use of new advanced treatments, largely due to the factors such as earlier detection, a new personalized approach to treatment and a better understanding of the disease. Many machine learning classification models have been adopted and modified to diagnose the breast cancer disease. In order to enhance the performance of classification model, our research proposes a model using A Hybrid Modified K-Means Clustering with Modified SVM (Support Vector Machine) Machine learning algorithm to create a new method which can highly improve the performance and prediction. The proposed Machine Learning model is to improve the performance of machine learning classifier. The Proposed Model rectifies the irregularity in the dataset and they can create a new high quality dataset with high accuracy performance and prediction. The recognized datasets Wisconsin Diagnostic Breast Cancer (WDBC) Dataset have been used to perform our research. Using the Wisconsin Diagnostic Breast Cancer (WDBC) Dataset, We have created our Model that can help to diagnose the patients and predict the probability of the breast cancer. A few machine learning classifiers will be explored in this research and compared with our Proposed Model “A Hybrid Modified K-Means with Modified SVM Machine Learning Algorithm to Enhance the Cancer Prediction” to implement and evaluated. Our research results show that our Proposed Model has a significant performance compared to other previous research and with high accuracy level of 99% which will enhance the Cancer Prediction.
Keywords: Machine learning algorithm, classifiers, K-Means, Support Vector Machine, Breast cancer.
1. Introduction
It’s difficult for a person to believe something as serious as cancer. The initial shock can leave the person feeling confused and unsure to proceed. But once they get the medical information they needed to make
IJIBC 21-2-29
Manuscript Received: April. 24, 2021 / Revised: April. 28, 2021 / Accepted: May. 2, 2021 Corresponding Author: [email protected]
Tel: +82-31-720-2080, Fax: +82-31-720-2286.
decisions, things get better. It takes some time to make a rational, informed decision about what treatment will be best for them both physically and emotionally. In recent research, the diagnosis of cancer is becoming one of the important issues and big challenges for the researchers. Predicting the breast cancer at an early stage can increase the survival rates. This can be achieved through new era of machine learning techniques. The prediction of breast cancer is also considered as a classification problem which can perform through different data’s or attributes of the breast tumors instead of traditional diagnosis lab tests. Various research models based on machine learning techniques have been used to help the early diagnosis of breast cancer such as support vector machines (SVM) [1,2], the research are still in progress to find the best way to achieve the high performance in cancer prediction. So the predicting models must provide proper reliable information about the
treatment and safety. K-means Clustering is used to Cluster the dataset into similar groups in the diagnosis of
breast cancer. This Cluster group will have the same characteristics of tumor data then the other group will have different characteristics of tumor data. In the machine learning classifier, most commonly used classifier to predict cancer are Classification and Regression Trees (CART), Naive Bayes Classifier (NB), K-Nearest Neighbors (KNN) and Support Vector Machines (SVM). Support Vector Machine performs well in prediction of breast cancer in terms of prediction of Benign (B) and Malignant (M) breast tumors. Other researches in [3] have developed models with combined methods, based on K-means Clustering and other techniques to build models to classify the breast cancer tumors. Machine learning algorithm gives better accuracy and efficiency as compared to detection of breast cancer using traditional methods. But we need proper implementation and validation [4].In 2018 [5] Support Vector Machines (SVM) have proved that it can predict with higher accuracy in recent researches. In this research we have developed a machine learning hybrid Modified K-means Clustering with Modified Support Vector Machines (SVM) classifier that can predict breast cancer with high accuracy than the other models. The Modified K-means Clustering is to preprocess the dataset that is used for training and testing the breast cancer dataset (WDBC). The modification of K-means Clustering is to propose a new method for selecting the initial centroids of Clusters which represent different information and also to select the centroids of Clusters depending on a distance threshold. Our P-Model modified K-Mean Clustering combine with modified SVM to analyze and predict the Benign (B) tumor from Malignant (M) tumor from the newly formed training dataset. Our model first preprocess, the training dataset (WDBC) and classifies into two categories – Benign (B) and Malignant (M). Then, the modified K-means Clustering performs minimizing the number of samples for each category without losing any related information and originality of the data. The resultant newly formed training dataset is then given to train the modified SVM classifier with shortest training time, compared to when trained with full data in addition of getting good results.
2. Related Research
AlFayez Et al. [6] the implementation of binary masking and K-means algorithm were completed to
segmentation ROI. Therefore, they used signature boundary for extraction of features. Finally, two classifiers were adopted and evaluated; these are Multilayer Perceptron (MLP) and Extreme Learning Machine (ELM).
Omondiagbe Et al. [7] examined artificial neural networks, support vector machine (utilizing a radial basis
kernel), and Naïve Bayes based on the Wisconsin Diagnostic Breast Cancer data base. They concluded that a hybrid approach which reduced the high dimensionality of features by adopting discriminant analysis of linear type (LDA), and thereafter adopting the developed reduced feature dataset to support vector machine (SVM) had the ability to diagnosis breast cancer more precisely. Their proposed was able to achieve 98.82% accuracy.
Tapak Et al. [8] To diagnosing breast cancer accurately at early stages in addition to investigate in how to treat
patients with metastases. They also tested the goodness of the two standard methods with the six algorithms related to machine learning. Using the SVM method with accuracy level of 93%.
of clinic nature in order to expect the metastasis of breast cancer. In so doing, several machine learning techniques have been used such as SVM, random forest, Bayesian classification algorithms, and the statistical logistic regression method. .
Bichen Zheng Et al. [10]Breast cancer diagnosis based on feature extraction using a hybrid of K-means and
support vector machine algorithms Bichen Zheng, Sang Won Yoon , Sarah S. Lam -Expert Systems with Applications ,Volume 41, Issue 4, Part 1, March 2014, Pages 1476-1482
Bennett Et al. [11] SVM has been widely used in the diagnosis of diseases be-190 cause of the high accuracy
of prediction. SVM generated a more 191 accurate result (97.2%) than decision tree based on the Breast Cancer Wisconsin (Original) Dataset.
Akay Et al. [12] In the research for diagnosing breast cancer developed by Akay (2009),194 SVM provided
98.53%, 99.02%, and 99.51% for 50–50% of training test partition, 70–30% of training-test partition, and 80– 20% of training-test partition respectively based on the same previous data set which contained five features after feature selection by a genetic algorithm. In this research, the features were selected based on the rank of feature discrimination and the testing accuracy on different combinations of feature subsets using grid search and SVM, the SVM trained the input iteratively until the optimal accuracy was obtained. The feature selection algorithm not only reduced the dimension of features but also eliminated the noisy information for prediction.
3. Proposed Model
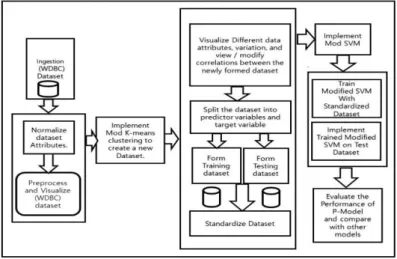
Our Proposed Model (P-Model) is “A Hybrid Mod K-Means Clustering with Mod SVM Algorithm to Enhance the Cancer Prediction” which combines modified K-means with modified SVM. The methodology of our P-Model is demonstrated as shown in Frame Work Figure 1.
Figure 1. Proposed Model Architecture Frame Work.
Our P-Model prepares (WDBC) datasets ingestion. Then the dataset attributes are normalized and then preprocessed and visualize the (WDBC) dataset. Next implement the Modified K-Means Clustering to create a new Dataset. The main function of Modified K-Means Clustering is, if the distance between a sample and the centroid of the Cluster is less than the threshold then the sample belongs to the Cluster; if the Cluster centroid exceeds the threshold value then the method creates a new Cluster with this sample. This process is applied to all samples of dataset (WDBC). The first centroid is chosen as the first sample of the dataset (WDBC).So this modified K-Mean Clustering identifies the number of Clusters dynamically, that can create a new training dataset from the Cluster centroids. The modified K-means differs from other K-means-based methods in that it does not require the computation of the number of Clusters 𝑘 because this will be achieved
dynamically. The modified K-means is typically conducted on each single category with the purpose of minimizing the number of samples by categorizing them into Clusters and then determining the mean for each Cluster as a new sample. If we apply modified K-means in the Benign (B) category, for example, the result would be a group of Clusters having same samples. The new Benign (B) category samples, as a consequence, are quantified by finding the mean of each Cluster and consider it as a new sample. The quality of the resultant samples should reflect the characteristics of the samples in the original training dataset. After that we used python functions to know the different data attributes and variation in the newly formed dataset. Then the newly formed Dataset is pre-processed and visualized to get proper information about the data distribution. We visualize the dataset (WDBC) using density plots to get a sense of the data distribution using a general Gaussian distribution then we check the correlations between the attributes that the attributes are correlated with each other or they have some moderate correlation or negative correlations. To prepare a dataset-frame, we'll split the dataset into predictor variables and target variables. We have used 80% of total dataset (WDBC) as training set and remaining 20% as testing set in our P-Model. In Standardized Dataset, the performance of the few machine learning algorithm could be improved if a standardized dataset is being used. In our model we have utilized pipelines to standardize the dataset and build the model for each fold in the cross-validation.
3.1 Preprocess and Visualize the (WDBC) Dataset.
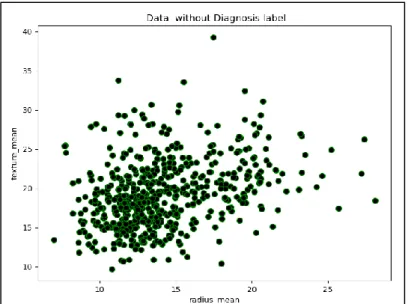
The WDBC Dataset have been visuliazed as group without diagnosis label using scatter plot in python in the
Figure 2. The WDBC Dataset do not need labels for Clustering. Because we will identify the labels.
Figure 2. Visualize Dataset without Diagnosis label.
In Figure 3 The WDBC Dataset have visuliazed as a group using the data attributes radius_mean ,
Figure 3. Visualize Data Attributes with Diagnosis (M / B).
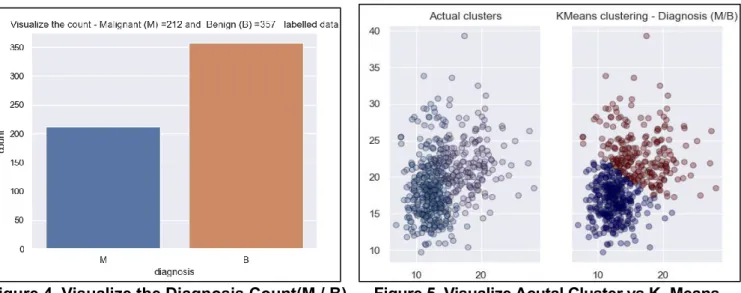
Figure 4. The WDBC Dataset have visuliazed as a diagnosed group Malignant(M) and Benign (B) with the
total number of counts using countplot.
Figure 4. Visualize the Diagnosis Count(M / B). Figure 5. Visualize Acutal Cluster vs K- Means. Figure 5. Uses Clustering to visuliazed The WDBC Dataset as Actual Clustering and by using K-Means
Clustering with diagnosed as Malignant(M) and Benign (B).
Figure 6. Represent Within-Cluster-Sum of Squared Errors (WCSS) to findthe optimal number of Clusters.
Calculate the Within-Cluster-Sum of Squared Errors (WSS) for different values of k, and choose the k for which WCSS becomes first starts to diminish. In the plot of WCSS-versus-k, this is visible as an elbow. Figure
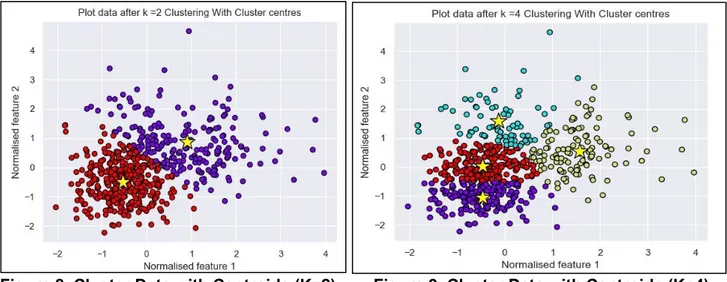
Figure 6. WCSS for Kvalue Selection. Figure 7. Visualize Cluster Data(K=2 Cluster). Figure 8. Visualize modified K-Means-Clustering WDBC Dataset as a group of Clusters with number of
Cluster k=2 with the Cluster centroids. Figure 9. Visualize modified K-Means-Clustering WDBC Dataset with
numberof Cluster k=4 with the Cluster centroids.
Figure 8. Cluster Data with Centroids (K=2). Figure 9. Cluster Data with Centroids (K=4). Figure 10. Represents the average distance to closest Cluster centroid for the given number of Clusters.
Table 1. Mod K-Means Clusters with each Cluster Centroids.
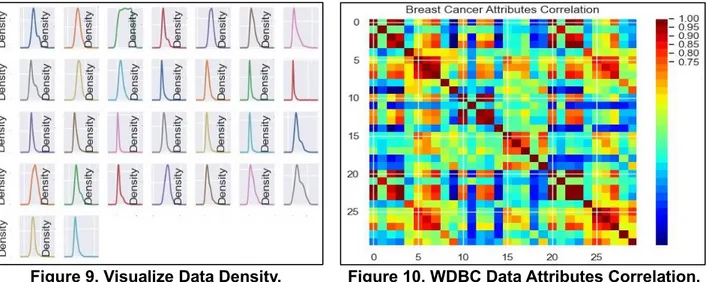
Table 1 shows the number of mod Means Clusters with its related information’s Number of Modified K-Means Clusters, label, diagnosis data Benign (B) Malignant (M) with the Cluster centroids for each Clusters. Figure 11. Visualize the data using density plots to get a sense of the data distribution using general Gaussian distribution. From the Figure 12. We can visualize the WDBC Data Attributes Correlation check the correlations between the attributes. The red around the diagonal suggests that attributes are correlated with each other. The yellow and green patches suggest some moderate correlation, then the blue boxes visualize negative correlations.
Figure 9. Visualize Data Density. Figure 10. WDBC Data Attributes Correlation.
Next stage is to implement Modified SVM (Support Vector Machine) First we modify SVM, We can modify the two key parameter of the SVM algorithm - the value of C and the type of kernel. The default C for SVM is 1.0 and the kernel is Radial Basis Function (RBF). We will use the grid search method using 10-fold
cross-validation with a standardized copy of the sample training dataset. We will try over a combination of C
values and the following kernel types. Linear Kernel: It can be used as a normal dot product of any two given observations. The product between
two vectors is the sum of the multiplication of each pair of input values. • Linear: (𝑥𝑖, 𝑥𝑗) =𝒙𝒊𝑻.
. 𝑥𝑗 .
Polynomial Kernel: It is more generalized form of the linear kernel and candifferentiate curved or nonlinear
input space. • Poly: (𝑥𝑖, 𝑥𝑗) = (𝛾𝒙𝒊𝑻. 𝑥𝑗 +𝑟) d, 𝛾 > 0. Radial Basis Function Kernel: It is a popular kernel function commonly used in support vector machine classification. It can map feature space in infinite dimensional space. • rbf : 𝑘(𝑥𝑖, 𝑥𝑗) = exp (−𝛾‖𝑥𝑖 − 𝑥𝑗‖2), 𝛾 > 0. Sigmoid Kernel: It is derived from the
Number of Mod K-Means Clusters label Diagnosis Cluster Centroids Benign(B) Malignant(M) 2 0 341 35 [ 0.90631193 0.86049824] 1 16 177 [-0.53015461 -0.50335552] 4 0 30 36 [-0.49319526 -0.99881177] 1 4 118 [ 1.56190055 0.56451193] 2 323 19 [-0.19206335 1.66221634] 3 0 39 [-0.41637062 0.10628518]
Neural Networks, in which the bipolar sigmoid functions is used as an activation function for artificial
neurons. It is popular in support vector machines. • Sigmoid: (𝑥𝑖, 𝑥𝑗) = tanh (𝛾𝒙𝒊𝑻. 𝑥𝑗 + 𝑟). Where k(xi, xj) is the kernel function γ, r and d are kernel parameters. After this step, we got value of C and
type of kernel which gives best performance in case of SVM. Using this we have built our P-Model. Value of C: The C parameter is also known as regularization parameter. It basically trades off correct classification of training examples against maximization of the decision function’s margin. For larger values of C, a smaller margin will be accepted if the decision function is better at classifying all training points correctly.
4. Experimental Evaluation
Our proposed system A Hybrid Mod K-Means Clustering with Mod SVM Algorithm to Enhance the Cancer
Prediction is implemented in Python with necessary functions and (WDBC) dataset.
4.1 Experiment Environment
We experimented our Proposed Model with Python 3.8.2 /Python 3.8.2 shell. P.C Intel Core i7 [email protected] with 12GB Ram, OS- Window 10 32bit.
4.2 Dataset
Dataset (csv Database file) - Wisconsin Diagnostic Breast Cancer (WDBC) data set. To implement our Proposed Model for this research, Wisconsin Diagnostic Breast Cancer (WDBC) Dataset from the University of California – Irvine repository has been used. The Wisconsin Diagnostic Breast Cancer (WDBC) consists of 569 from that they are diagnosed as 357 Malignant (M) cases and 212 Benign (B) cases (approximately 62.7% B and 37.3% M) in addition to 32 key patient attributes. These attributes are patients ID, 30 tumor distinguishing features, and one class indicator. The distinguishing features of patients tumors were gathered based on 10 different aspects: radius, texture, perimeter, area, smoothness, compactness, concavity, concave points, fractal symmetry and dimension .These features were obtained using digitized image of a fine needle aspirate (FNA) of a breast mass. Key identifying statistics for each image such as mean, standard error, and
smallest or largest values of these features were determined and hence leading to a set of 30 features. [26] For
each category, three indicators are measured: mean value, standard error, and maximum value as shown in
Table 2.
Table 2. WDBC Data Attributes.
Those different measurements are treated as different features in the dataset. Since different features are measured in different scales, the error function will be dominated by the variables in large scale. Thus, to remove the effect of different scales, normalization is required before training. Totally, instances have been
4.3 Evaluation of P-Model on Standardized Data
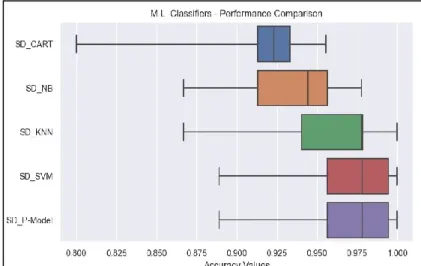
In Figure 13. In the evaluation process we will compare the performance of modified SVM with other machine learning algorithms CART, NB, KNN, SVM on Standardized Dataset (WDBC) in 20% Testing Dataset without Tuning we got the best accurate configuration of modified SVM with RBF kernel and C=1.3, with Accuracy: 0.96 %. And in Figure 14. We will compare the performance of modified SVM with other machine learning algorithms CART, NB, KNN, SVM on Standardized Dataset (WDBC) in 50% Testing Dataset without Tuning we got the best accurate configuration of modified SVM with linear kernel and C=0.1, with Accuracy: 0.97%.In the testing phase, the modified Trained SVM with high quality training dataset is used to classify the testing dataset into Benign (B) and Malignant (M) categories.
Figure 13.Proposed Model Performance Comparison on Standardized Data(80%+20%)
4.4 Measure for Performance Evaluation / Experimental Results
As stated in the previous discussion, the K-SVM is tested on the WDBC data set using 10-fold cross validation. The diagnosis accuracy is maintained at 97.38%, which is calculated by the equation (1):
𝐴𝑐𝑐𝑢𝑟𝑎𝑐𝑦 =
𝐓𝐏 + 𝐓𝐍𝐓𝐏+𝐓𝐍+𝐅𝐏+𝐅𝐍
(1) Where TP: True Positive, TN: True Negative, FP: False Positive, and FN: False Negative.
Table 3. Confusion Matrix.
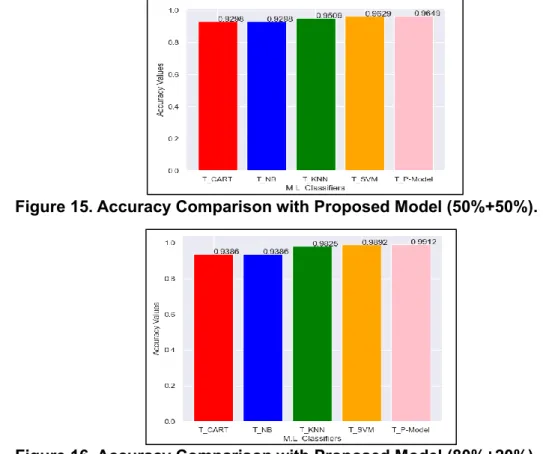
Table 3. Illustrates how predicted and actual classes (cases) are compared with each other to yield four distinguishing metrics. Where True Positives (TP) – indicate positive cases that are correctly diagnosed aspositive cases. False Positives (FP) – indicate negative cases that are incorrectly diagnosed as positive cases. True Negatives (TN) – indicate negative cases that are correctly diagnosed as negative cases. False negatives (FN) – indicate positive cases that are incorrectly diagnosed as negative cases. Based on the confusion matrix, other related performances can be derived. The Accuracy of few machine learning classifiers and our Proposed Model based on 10-fold cross-validation are shown in Figure 15.With 50 % of Testing Dataset, we have achieved 96.49% of accuracy and the Figure 16 shows the accuracy of our Proposed Model with 20 % of Testing Dataset we have achieved 99.12% of accuracy. This shows that our Proposed Model with stable good performance with high accuracy in prediction is maintained.
Figure 15. Accuracy Comparison with Proposed Model (50%+50%).
The performance quality for the classification models is the confusion matrix. In the confusion matrix, the examined breast cancer cases are divided into two distinct classes: positive (Benign (B)) and negative (Malignant (M)). Our Proposed Model (T_P-Model) the final accuracy after tuning is compared with T_CART, T_NB, T_ KNN and T_SVM as shown in the Table 4 for 50% of Testing and in Table 5 for 20% of Testing WDBC Dataset respectively. Accuracy of our proposed (T_P-Model) is better than the Other Models in both the cases.
Table 4. Evaluation Comparison of P-Model with other methods based on 50% of Testing WDBC Dataset.
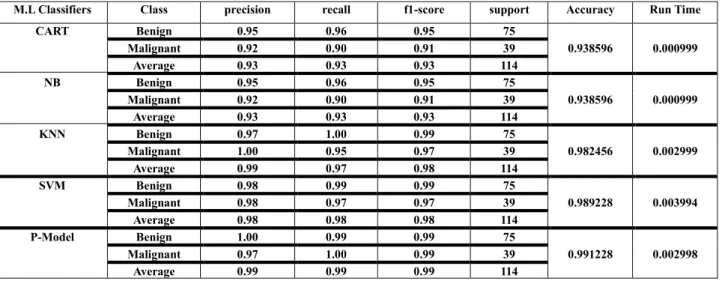
Table 5. Evaluation Comparison of P-Model with other methods based on 20% of Testing WDBC Dataset.
M.L Classifiers Class precision recall f1-score support Accuracy Run Time
CART Benign 0.94 0.94 0.94 181 Malignant 0.90 0.90 0.90 104 0.929825 0.001999 Average 0.92 0.92 0.92 285 NB Benign 0.94 0.94 0.94 181 Malignant 0.90 0.90 0.90 104 0.929825 0.000999 Average 0.92 0.92 0.92 285 KNN Benign 0.94 0.98 0.96 181 Malignant 0.97 0.89 0.93 104 0.950877 0.001999 Average 0.96 0.94 0.95 285 SVM Benign 0.97 0.98 0.97 181 Malignant 0.96 0.94 0.95 104 0.962912 0.001999 Average 0.96 0.96 0.96 285 P-Model Benign 0.97 0.98 0.97 181 Malignant 0.96 0.94 0.95 104 0.964912 0.001999 Average 0.96 0.96 0.96 285
M.L Classifiers Class precision recall f1-score support Accuracy Run Time
CART Benign 0.95 0.96 0.95 75 Malignant 0.92 0.90 0.91 39 0.938596 0.000999 Average 0.93 0.93 0.93 114 NB Benign 0.95 0.96 0.95 75 Malignant 0.92 0.90 0.91 39 0.938596 0.000999 Average 0.93 0.93 0.93 114 KNN Benign 0.97 1.00 0.99 75 Malignant 1.00 0.95 0.97 39 0.982456 0.002999 Average 0.99 0.97 0.98 114 SVM Benign 0.98 0.99 0.99 75 Malignant 0.98 0.97 0.97 39 0.989228 0.003994 Average 0.98 0.98 0.98 114 P-Model Benign 1.00 0.99 0.99 75 Malignant 0.97 1.00 0.99 39 0.991228 0.002998 Average 0.99 0.99 0.99 114
5. Conclusion and Future Work
In our research, we have created A Hybrid Mod K-Means Clustering with Mod SVM Algorithm to Enhance the Cancer Prediction model that combines the features of Modified K-means Clustering and modified support vector machine algorithm. Our Proposed Model has high accuracy classification performance than the other machine learning models. Our modified K-means has been considered as a means to attain high-quality training datasets where they can effectively improve the entire performance of the cancer prediction combining with modified support vector machine (SVM). The implementation results obtained from the (WDBC) training datasets our model has attained 99% degrees of accuracy when used 10-cross validation method with 20% of testing dataset. The major achievement of our Proposed Model is the developing of a prediction model with better performance than those models reported in recent researches. This is because our Proposed Model can present a balanced performance among categories Benign (B) and Malignant (M). Based on the findings obtained, it is recommended to develop more robust model based on the crowd information with highly competent classifier to accurately classify the Breast Cancer.
References
[1] L. Yang and Z. Xu, “Feature extraction by PCA and diagnosis of breast tumors using SVM with DE-based parameter tuning”, International Journal of Machine Learning and Cybernetics, Vol. 10, No. 3, pp. 591-601, 2019.
[2] R. Vijayarajeswari, P. Parthasarathy, S. Vivekanandan, “Classification of mammogram for early detection of breast cancer using SVM classifier and Houghtransform”, Measurement, Vol. 146, pp. 800-805, 2019.
[3] P. Filipczuk, M. Kowal, “Automatic breast cancer diagnosis based on k-means Clustering and adaptive thresholding hybrid segmentation”, Image processing and communications challenges, Springer, pp. 295-302, 2011.
[4] Youness Khourdifi, Mohamed Bahaj,”Applying Best Machine Learning Algorithms for Breast Cancer Prediction and Classification”, International Conference on Electronics, Control, Optimization and Computer Science (ICECOCS), 2018. [5] A. K. Dubey, U. Gupta, and S. Jain,“Comparative study of K-means and fuzzy C-means algorithms on the breast cancer data”, International Journal on Advanced Science, Engineering and Information Technology, Vol.8, No. 1, pp. 18-29, 2018.
[6] F. AlFayez, M. W. A. El-Soud, and T. Gaber, “Thermogram Breast Cancer Detection: a comparative study of two machine learning techniques”, Applied Sciences, Vol. 10, No. 551, pp. 1-20, 2020.
[7] D. A. Omondiagbe, S. Veeramani, and A. S. Sidhu, “Machine Learning Classification Techniques for Breast Cancer Diagnosis”, In: Proc. of IOP Conf. Series: Materials Science and Engineering, Vol. 495, pp. 1-16, 2019.
[8] L. Tapak, N. Shirmohammadi-Khorram, P. Amini, B. Alafchi, O. Hamidi, and J. Poorolajal, “Prediction of survival and metastasis in breast cancer patients using machine learning classifiers”, Clinical Epidemiology and Global Health, Vol. 7, No. 3, pp. 293-299, 2019.
[9] Y. J. Tseng, C. E. Huang, C. N. Wen, P. Y. Lai, M. H. Wu, Y. C. Sun, H. Y. Wang, and J. J. Lu, “Predicting breast cancer metastasis by using serum biomarkers and clinicopathological data with machine learning technologies”, International Journal of Medical Informatics, Vol. 128, pp. 79-86, 2019.
[10]Breast cancer diagnosis based on feature extraction using a hybrid of K-means and support vector machine algorithms Bichen Zheng, Sang Won Yoon , Sarah S. Lam -Expert Systems with Applications ,Volume 41, Issue 4, Part 1, March 2014, Pages 1476-1482.
[11] Bennett, K. P., & Blue, J. A. (1998). A support vector machine approach to decision trees. In Proceedings of IEEE world congress on computational intelligence (pp. 2396–2401). Anchorage, AK: IEE.
[12] Akay, M. F. (2009). Support vector machines combined with feature selection for breast cancer diagnosis. Expert Systems with Applications, 36, 3240–3247.
[13] F. Liu and M. Brown, “Breast Cancer Recognition by Support Vector Machine Combined with Daubechies Wavelet Transform and Principal Component Analysis”, In: Proc. of the International Conf. on ISMAC in Computational Vision and Bio-Engineering, Springer, pp. 1921-1930, 2018.
[14] P. Exarchos a, Michalis V. Karamouzis “Machine learning applications in cancer prognosis and prediction” Computational and Structural Biotechnology Journal 13 (2015) 8–17.
[15] L. Yang and Z. Xu, “Feature extraction by PCA and diagnosis of breast tumors using SVM with DE-based parameter tuning”, International Journal of Machine Learning and Cybernetics, Vol. 10, No. 3, pp. 591-601, 2019.
[16] V. Chaurasia, S. Pal, and B. Tiwari, “Prediction of benign and malignant breast cancer using data mining techniques”, Journal of Algorithms and Computational Technology, Vol. 12, No. 2, pp.119-126, 2018.
[17] H. M. Moftah, A. T. Azar, E. T. Al-Shammari, N. I., “Adaptive k-means Clustering algorithm for MR breast image segmentation”, Neural Computing and Applications, Vol. 24, No. 7-8, pp. 1917-1928, 2014.
[18] A. K. Dubey, U. Gupta, and S. Jain, “Analysis of k-means Clustering approach on the breast cancer Wisconsin dataset”, International Journal of Computer Assisted Radiology and Surgery, Vol. 11, No. 11, pp. 2033-2047, 2016. [19] W. L. Al-Yaseen, Z. A. Othman. “Multi-level hybrid support vector machine and extreme learning machine based on modified K-means for intrusion detection system”, Expert Systems with Applications, Vol.67, pp. 296-303, 2017. [20] M. Kumar, A. J. Kulkarni, and S. C. Satapathy, “A Hybridized Data Clustering for Breast Cancer Prognosis and Risk Exposure Using Fuzzy C-means and Cohort Intelligence”, Optimization in Machine Learning and Applications, Springer, pp. 113-126, 2020.
[21] G. F. Stark, G. R. Hart, B. J. Nartowt, and J. Deng, “Predicting breast cancer risk using personal health data and machine learning models”, Plos One, Vol. 14, No. 12, pp. 1-17, 2019.
[22] P. Ferroni, F. M. Zanzotto, S. Riondino, N. Scarpato, F. Guadagni, and M. Roselli, “Breast cancer prognosis using a machine learning approach”, Cancers, Vol. 11, No. 328, pp. 1-9, 2019.
[23] C.-W. Hsu, C.-C. Chang, and C.-J. Lin, “A practical guide to support vector classification”, Computer Science, pp. 1-16, 2008.
[24] Abien Fred M. Agarap,”On Breast Cancer Detection: An Application of Machine Learning Algorithms on the Wisconsin Diagnostic Dataset”, ICMLSC , February 2–4, 2018, Phu Quoc Island, Viet Nam, 2018.
[25] Dana Bazazeh and Raed Shubair ,”Comparative Study of Machine Learning Algorithms for Breast Cancer Detection and Diagnosis”, 5th International Conference on Electronic Devices, Systems and Applications (ICEDSA), 2016. [26] Hui-Ling Chen , Bo Yang, Jie Liu , Da-You Liu,”A support vector machine classifier with rough set-based feature selection for breast cancer diagnosis,H.-L. Chen et al. - Expert Systems with Applications 38 9014–9022, 2015
[27] Muhammad Hussain, Summrina Kanwal Wajid, Ali Elzaar, Mohammed Berbar,”A Comparison of SVM Kernel Functions for Breast Cancer Detection”, Eighth International Conference Computer Graphics, Imaging and Visualization, 2014.