CASE STUDY ON SEVERELY-DAMAGED REINFORCED EARTH WALL
WITH GEO-TEXTILE IN HYOGO, JAPAN
Part I: Site Investigation into the cause of damage
MINSU JUNGi)
, S
HUNZO KAWAJIRIii), JINSUK HURii)and S
ATORU SHIBUYAiii)ABSTRACT
Case study was carried out on the interpretation of the mechanical behavior of a severely damaged reinforced earth wall comprising geotextile with the concrete panel facing. In this part I, the outline of the damaged reinforced earth wall is in detail described. The background and cause of the damage are discussed based on the results of site investigation. The engineering properties of the fill were examined by performing various in-situ and laboratory tests, including the surface wave survey (SWS), PS-logging, RI-logging, soaking test, the direct shear box (DSB) test, bender element (BE) test, etc. The background as well as the cause for the damage of the wall may be described such that i) a considerable amount of settlement took place over a 3m thick weak soil layer in the lower part of the reinforced earth due to seepage of rainfall water, ii) the weight of the upper fill was partially supported by the geo-textile hooked on the concrete panels (n.b., named conveniently “hammock state” in this paper), and iii) the concrete panels to form the hammock were severely damaged by the unexpectedly large downwards compression force triggered by the tension force of the geotextile. The numerical simulation for the hammock state of the wall, together with counter-measures to re- stabilize the wall is subsequently described in Part II.
Key Words : Reinforced earth, In-situ survey, laboratory test, geo-synthetics, Hammock state
1 INTRODUCTION
In Japan, reinforced earth wall is popular for the construction of roads in mountain area. The use of reinforced earth comprising the vertical wall is advantageous in saving the construction cost when compared to bridges, for example. In the case of reinforced earth wall comprising geotextile with the concrete panel facing, however, it involves a great difficulty in compacting properly the portion of the fill adjacent to the wall facing. As a result of loose compaction near the wall, the wall facing may be damaged by compressive force and/or could be completely destroyed due to the active failure of the fill (for example, refer to Tatsuoka,F., Tateyama, M., Uchimura, T. and Koseki, J., 1997).
Figure 1 shows typical of damages for reinforced earth in general. In case of flexible reinforced earth without any concrete facing, a local failure involving with excessive compressive deformation would take place at the bottom portion, which in turn may trigger the overall active slip failure in a progressive manner (refer to Tatsuoka,F., Tateyama, M., Tamura, Y. and Yamauchi. H., 2000). Conversely, when the reinforced earth with concrete panels comprises a poorly compacted (or soft soil) layer at the time of construction, a connection between the concrete panel
and reinforcement member (i.e., the metal strip or geotextile) would be destroyed owing to the downward tension force at the connection, which eventually may bring about complete failure of the wall. Furthermore, when the wall is located in a valley, the reinforced earth is likely to suffer from the attack of the seepage flow in the event of heavy rainfall, resulting in a catastrophic failure in the worst case (refer to Shibuya, Chae and Kawaguchi, 2007).
In this paper, case study into the interpretation of the mechanical behavior of a severely damaged reinforced earth wall near Kobe is in detail described. In this part I, the background of the damaged reinforced earth wall, together with the possible cause of damage is discussed based on the results of site investigation. In the i)Research Associate, Graduate School of Civil Engineering, Kobe University, Japan. ([email protected])
ii)Doctoral student, Graduate school of Civil Engineering, Kobe University, Japan.
iii) Professor, Graduate School of Civil Engineering, Kobe University, Japan ([email protected])
subsequent Part II, the numerical simulations to clarify the scenario of the wall damage postulated in Part I, and also to examine efficient counter-measures against the damage are described.
2 OUTLINE OF CASE STUDY
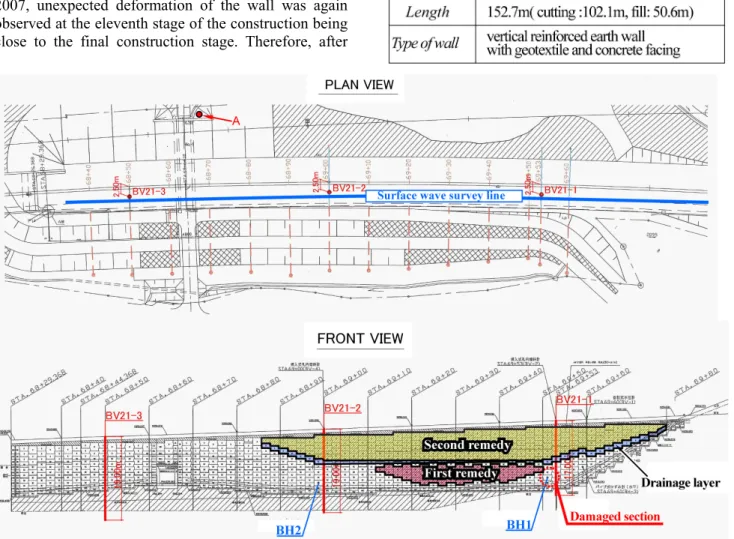
As seen in Figure 2, the severely-damaged reinforced earth wall is situated at the end of the main line of the Tottori expressway. It is bounded by valleys in the mountain area in Hyogo Prefecture, Japan. The wall is a reinforced earth wall with geo-textile constructed using the local soils. The wall was originally designed using a method to install a series of anchors, but later the method of construction was re-examined according to the change of the design aspect for the horizontal seismic intensity from 0.12g to 0.16g. As a consequence, the method to use geotextile with concrete facing was employed. Table 1 shows some aspects of the wall.
In November of 2006, irregular deformation of the wall was observed at the sixth stage of the construction. Accordingly, a partial reconstruction involved with cement stabilization of the fill was carried out after removing some parts of the reinforced earth wall, which is called “the first remedy” in this paper. In April of 2007, unexpected deformation of the wall was again observed at the eleventh stage of the construction being close to the final construction stage. Therefore, after
demolishing some parts of the wall, the wall was reconstructed with cement stabilization of the upper part of the fill. Furthermore, a horizontal drainage layer was installed in the middle part of the wall. In this paper, this reconstruction of the wall is called “the second remedy”.
The construction of the wall was finally completed in November, 2007. However, the filed observation
Figure 3. Front and plan views of the site.
Figure 2. Location of the site.
clearly indicated that the deformation of the wall showed no tendency to stabilize with time. Case study was hence commissioned in order to manifest the cause(s) of the wall damage, and also to examine effective counter-measures to re-stabilize the wall.
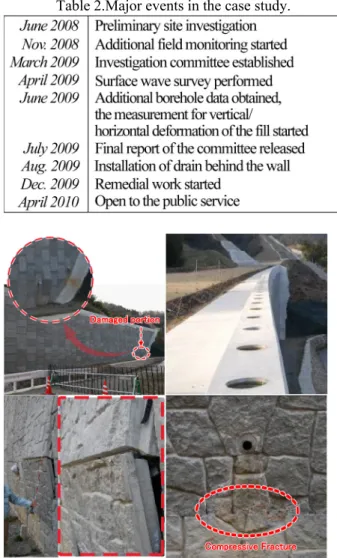
Table 2 shows the sequence of major events associated with this case study. In an attempt to properly understand the current conditions of the damaged wall, the engineering properties of fill material such as the profile of shear wave velocity, Vs,
natural water content wn, the wet density ρt and the SPT
N-value were examined by performing surface wave survey (SWS), PS-logging, RI-logging, and the standard penetration test (SPT), respectively. The physical properties as well as the compaction characteristics were manifested in the laboratory by using disturbed samples. Bender element (BE) test, direct shear box (DSB) test and the soaking test were carried out by using samples prepared close to in-situ conditions in terms of the density and the water content. The in-situ stress conditions were estimated by comparing the shear wave velocity, Vs, between in-situ
Vs,f from PS-logging and Vs,lab from BE test using the
sample having the same density and water content in the field. The soaking test was performed in order to manifest the settlement characteristics of the fill material when wetting.
Views of the site are shown in Figure 3, in which the locations for the SWS, PS-logging, RI-logging, boring and the SPT are indicated. The wall height at the severely damaged portion was approximately 15m. As described earlier, the parts of the fill for the first and second remedies had been improved by cement
Table 2.Major events in the case study.
Figure 4. Severely damaged portion.
injection using the dry weight of Portland cement of 50kg/m3. The drainage layer was sandwiched between these two cement-mixed layers. Note that the severely damaged portion of the wall is surrounded by the improved soil with a low-permeability and the bedrock. In addition, there is a small valley behind it.
Figure 4 shows some pictures of the reinforced earth wall cited, including the severely damaged portion. The outwards deformation at the damaged portion on the wall was on-going by showing the horizontal displacement to reach the value as large as 166mm. Local protrusion on the wall face, together with the compressive failure was also observed. The concrete panel wall had been constructed by using a high-density polythene geo-textile sheet. At this stage, a type of wall damage due to the existence of a poorly compacted soil layer was strongly suspected (refer to Figure 1).
3 IN-SITU TEST
3.1 Surface wave survey (SWS)
Prior to PS-logging, boring and the SPT, the surface wave survey (SWS) was carried out to Figure out the two-dimensional (2D) profile of the elastic wave velocities, i.e., S-wave and P-wave velocities (Vs and
Vp) of the fill and the foundation. In the SES, waves
were generated using a hammer. Three survey lines, L1, L2 and L3, are shown in Figure 5. In this paper, the results of the line L1 with 160m long are shown in Figure 5, in which the 2D variations of the Vs and Vp
with depth are plotted. In general, the Vs increases with
depth involved with increase in in-situ stresses. However, a low-velocity layer was observed for Vs near
the severely damaged section at BV21-1 (n.b., elevation: approximately 240m, distance: 110~115m). The decrease in Vs strongly suggests some reduction of
the magnitude of stresses at the deformed section. On the other hand, the dashed curve in the profile of Vp
represents the boundary associated with Vp = 1500m/s,
noting that the specific condition of Vp = 1500m/s is
applicable to saturated soil. It may be surmised that the state of soil behind the damaged panels is close to saturation.
3.2 Results of PS-logging, RI-logging and SPT
The decrease in Vs near the deformed section was
strongly suggested by the SWS. Therefore, a down-hole PS-logging was carried out to directly measure the profile of Vs with depth. Similarly, RI-logging using the
Gamma Ray attenuation technique was performed for profiling the variations of wet density, ρt, and the
natural water content, wn, with depth. Figure 6 shows
the profiles of Vs, N-value, ρt, ρd and wn. at three
locations of BV21-1, BV21-2 and BV21-3, respectively (see Figure 3). As seen in Figure 6, the horizontal layer over the depths roughly from 10m to 13m for the length between BV21-1 and BV21-2 is seemingly soft by
showing higher water content with the relatively low values of Vs, N-value, and ρd. The supposed soft soil
layer corresponds to the portion characterized by the low-velocity from surface wave survey. Meanwhile, both of Vs and N-value appear large for the soil layer
improved by cement-mixing (i.e., the portions for the first and second remedies, see Figure 3).
3.3 Results of laboratory tests
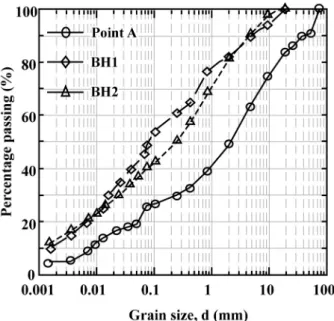
3.3.1 Grain size distribution and compaction characteristics
The physical properties, together with the compaction characteristics were measured using disturbed soil samples retrieved at three locations; i.e., the two samples at BH1, BH2 and the other sample at point A on the slope (see Figure 3). It should be mentioned that the soil at BH1 corresponds to the severely damage portion. Similarly, the soil at BH2 represents the fill material on the same level as the soil at BH1. On the other hand, the soil at point A on the slope may be regarded as sourcing for the filling.
Figure 7 shows the grain size distribution of these three samples. It is obvious in this Figure that the soils from BH1 and BH2 are much finer in grain size by showing the fines content, Fc = 49.0% and 40.2% for
BH1 and BH2, respectively, whereas Fc = 25.2% at
point A.
Figure 8 shows the compaction curves of two samples at point A and BH2. The maximum dry density, ρdmax, of the BH2 sample was far smaller than the other
sample (n.b., ρd max=1.572 g/cm3 for the BH2 sample
and ρd max=1.832 g/cm3 for the other), whereas the
optimum water content was higher (n.b., wopt=23.6 %
for the BH2 sample and wopt=15.6 % for the other. It
should be mentioned that the entire fill was constructed by using the same method. In addition, the controlled value for the density was set to 0.9ρdmax based on the
compaction curve similar to that of the sample at point A. It is now almost certain that the soft soil layer with larger amount of fines, and having lower values of Vs,
N-value and ρd is responsible for the damage of the
wall as shown in Figure 1.
3.3.2 Shear wave velocity and shear strength
In general, the Vs is governed by ρt, wn and the
vertical stress, σv, for the soft soil sample subjected to
1D compression. In an attempt to estimate the in-situ stress conditions at the severely damaged portion, 1D consolidation test with the measurement of Vs was
carried out on the sample retrieved at BH1 (n.b., for he details of the consolidometer test, refer to Shibuya, Koseki and Kawaguchi, 2005). In this test, the sample was prepared to have the values of ρd and wn similar to
those in-situ, respectively. It was then subjected to incremental loading of the vertical stress, σv, whilst the
Vs was continuously measured by a pair of BEs.
The profile of Vs,f with depth is shown in Figure 9,
Figure 7. Grain-size distribution.
Figure 8. Compaction curves.
Figure 9. Results of PS-logging and BE test.
Figure 10. τ-Δh relationships in constant pressure DSB test.
in which the result of the BE test is also shown for comparison. The Vs,lab from the BE test almost
coincided with Vs,f at the relevant depth when the
sustained σv of the laboratory sample was 22.5 kPa
Note that the σv of 22.5 kPa accounts for approximately
one-tenth of in-situ overburden pressure at the prescribed depth.
In an attempt to obtain the shear strength at the damaged section, the constant-pressure DSB test (for the details, see Shibuya, Koseki and Kawaguchi, 2005) was performed. The specimen was initially prepared with w = 25%, and ρt=1.50 g/cm3 after the observed
values from RI-logging at the damaged portion. It was saturated by soaking the box, and it was compressed to the vertical stress of 22.5 kPa in match with in-situ σv.
The sample was subjected to shear by using the rate of horizontal displacement of 0.05mm/min while keeping an fixed opening of 0.2mm between the upper and lower shear boxes.
The relationship between the shear stress and the horizontal displacement is shown in Figure 10, in which similar result of the sample from point A is also shown for comparison. The maximum shear stress, τmax, of 17
kPa was very small for the sample at the damaged section, bearing the overburden height of the embankment of about 10m in mind. The stress-displacement curve exhibited no peak for the sample, whereas it showed a higher strength involved with a distinct peak for the other sample comprising less fines.
3.3.3 Deformation behavior at soaking
According to the results of site investigations performed, the soil at the damaged section is currently saturated (see Figs.5 and 6). This means that the initially unsaturated soil at compaction is soaked gradually possibly due to seepage flow into the fill. Soaking test was, therefore, carried out in an attempt to examine the deformation behavior during the process of soaking.
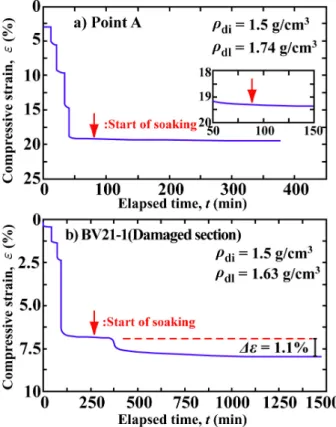
Figure 11 shows the setup for the soaking test. The test was performed in a manner that the specimen having the dimension of 60mm in diameter and 20mm in height was allowed to absorb water under the condition of constant σv. Two samples, one from the
damaged section (i.e., BV21-1 sample) and the other from point A, were each prepared with the initial water content equal to wopt (see Figure 8). The initial dry
density was 1.50g/cm3, which was equal to the current dry density of soil at the damaged section (see Figure 6). The σv. was increased in steps. On reaching the
prescribed vertical stress of 200 kPa equal to the σv at
the damaged section, the distilled water was supplied with the differential head of 1m, and the change of vertical displacement with time was observed.
The results of soaking test are shown in Figure 12.
As seen in Figure 12, the amount of accumulated compressive strain during the incremental loading to 200 kPa was significantly larger for the sample from point A having less fines. This may be attributed to the fact that the degree of compaction against the initial ρd
of 1.50g/cm3 was much lower for the sample (see Figure 8). In the event of soaking, however, the sample at the deformed section exhibited a considerable amount of settlement with time to reach the compressive strain of 1.1 % over a period of one day (see Figure 12b). Conversely, no volume change was observed for the other sample (see Figure 12a).
Figure 11. Soaking test apparatus employed.
4 ESTIMATING DEFORMATION
MECHANISM OF THE REINFORCED EARTH WALL
The results of in-situ and laboratory tests have revealed the fact that a 3m-thick weak soil layer extends behind the damaged section of the wall. The in-situ state for the weak soil layer may be characterized with unrealistically low values of Vs, ρd
and the SPT N-value. In addition, the soil properties can be characterized by the occurrence of a considerable amount of settlement on soaking. On the other hand, the soil at this section was almost saturated.
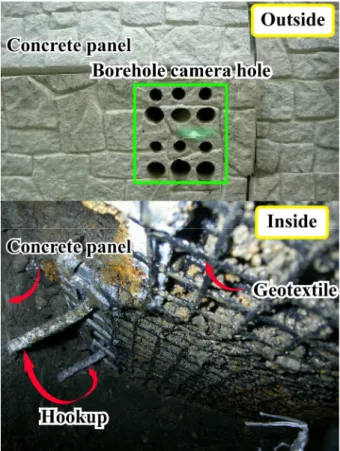
Figure 13 shows the picture inside the wall at the deformed section. A space was found underneath the geotextile, suggesting that the weight of the fill above the geotextile was partially supported by the geotextile. In this paper, the new wording of “hammock state” is conveniently used for describing it.
Based on this observation, the background as well as the mechanical interpretation for the damage of the wall can be postulated as an image shown in Figure14. it may be described such that i) a considerable amount of subsidence took place over the 3m-thick weak soil layer in the lower part of the reinforced earth due to seepage of rainfall water, ii) the weight of the upper fill was partially supported by the geo-textile hooked on the concrete panels, and iii) the concrete panels associated with the hammock state were severely damaged by the unexpectedly large downwards compression force triggered by the tension force of the geotextile.
Once the hammock state was reached inside the wall, the overburden stress corresponding to the hammock state in the fill will be dramatically reduced, which in turn would bring about decrease of the shear resistance between the geo-textile and the surrounding soil. The notion is strongly supported by the results of laboratory tests that the estimated σv at the deformed section was
as small as one-tenth of the supposed σv (see Figure 9)
and that the shear strength was far smaller than the supposed value (see Figure 10).
On the basis of the interpretation described in this part I, a remedial measure was urgently installed in August 2009 to prevent the valley water from infiltrating into the fill. In April 2010, the wall was successfully open to the public service after the major remedial work by the cement grouting into the weak layer, together with a series of anchoring.
5 CONCLUSIONS
In this paper, case study was carried out into the background and causes for a severely damaged reinforced earth wall in Hyogo Prefecture, Japan. In this part I, these aspects were carefully examined based on various in-situ and laboratory tests. The conclusions are described in the following.
Figure 13. Pictures inside reinforced earth wall.
Figure 14. Mechanical behaviour of a largely-deformed reinforced earth wall with geo-textile.
(1) The results of in-situ and laboratory tests have revealed the fact that a 3m-thick weak soil layer extends behind the damaged section of the wall. The in-situ state for the weak soil layer may be characterized with unrealistically low values of Vs,
ρd and the SPT N-value. The soil in this layer was
near saturation. The soil exhibited a considerable amount of settlement on soaking.
(2) The soil in the damaged portion comprises a great amount of fines, and hence it was hard to compact by showing a lower value of the maximum dry density as compared to the rest.
(3) The mechanical interpretation for the damage of the wall can be described such that i) a considerable amount of subsidence took place over the weak soil layer due to seepage of rainfall water, ii) the weight of the upper fill was partially supported by the geo-textile hooked on the concrete panels, and iii) the concrete panels associated with the hammock state were severely damaged by the unexpectedly large downwards compression force triggered by the tension force of the geotextile. The hammock state was seemingly enhanced by a loss of the shear resistance between the geo-textile and the surrounding soil involved with the decrease of
the overburden stress .
REFERENCES
1) Design Codes for Concrete Structures of Japan Railway, (1992): Japan Ministry of Transportation, ISBN
4-621-03760-9 C3051, Maruzen Print Co. Ltd.,.79-107 (in
Japanese).
2) Shibuya, S., Koseki, J. and Kawaguchi, T. (2005): “Recent developments in deformation and strength testing of geomaterials”, Keynote Lecture, Deformation Characteristics of Geomaterials -Recent Investigations and Prospects (Di Benedetto H. et al edns), Taylor Francis Group London, pp.3-28.
3) Shibuya, S. , Kawaguchi, T. and Chae, J-G. (2007): “Failure of Reinforced Earth wall as attacked by Typhoon No. 23 in 2004”, Soils and Foundations, Vol.46, No.2, pp.153-160. 4) Tatsuoka,F., Tateyama, M., Tamura, Y. and Yamauchi. H.
(1997): “Geosynthetic-reinforced soil retaining walls as important permanent structures”, 1996-1997 Mercer Lecture,
Geosynthetic International, Vol.4, No.2, pp.21-136.
5) Tatsuoka,F., Tateyama, M., Tamura, Y. and Yamauchi. H. (2000): “Lessons from the failure of full-scale models and recent geosynthetic-reinforced soil retaining wall”, Proc. the
second Asian Geosynthetics Conference, GeoAsia 2000,