CT
검사 시 관전류 자동조절기법이 선량에 미치는 영향
문일봉1· 동경래1,* · 김광철2,31광주보건대학교 방사선과, 2전라남도청 사회재난과, 3조선대학교 원자력공학과
The Impact of the AEC Mode of Tube Current on the Dose
at CT Scans
Il-Bong Moon
1, Kyung-Rae Dong
1,* and Kwang-Cheol Kim
2,31Department of Radiological Technology, Gwangju Health University, 683-3 Shinchang-dong,
Gwangsan-gu, Gwangju 62287, Republic of Korea
2Social Disaster Management Division, Jeollanam-do Provincial Government, Oryong-gil
Samhyang-eup, Muan-gun, Jeollanam-do 58564, Republic of Korea
3Department of Nuclear Engineering, Chosun University, 375, Seosuk-dong, Dong-gu,
Gwangju 61452, Republic of Korea
Abstract - In this study, the automatic exposure control(AEC) modes of tube current (SIEMENS-Care Dose 4D and GE AEC mode) that CT manufacturers are using was applied to neck, chest and abdomen in order to determine the difference in the respective dose parameters(CTDIvol, DLP and mSv) resulting from the dose reduction. Equipment in use at C university adopted Care Dose 4D of Siemens and AEC mode of General Electric(GE), and the x-ray exposure conditions were adjusted to be as identical as possible between the experiments. For the assessment of the dose reduction, the differences between the doses with and without the use of the tube current AEC mode by the respective manufacturer were measured for each body part including neck, chest and abdomen of a human phantom, Rando Phantom(Art-200x, Fluke Biomedical, USA). First, the assessment of SIEMENS-Care Dose 4D yielded the following results. At the neck, the automatic exposure control resulted in a 3.3% reduction in CTDIvol and DLP, and a 3% reduction in the effective dose, mSv, compared to manual exposure control. The automatic exposure control at the chest displayed the reduction in CTDIvol and DLP by 25.5%, and in the effective dose, mSv, by 25.4% compared to the manual exposure control. In case of abdomen, CTDIvol and DLP were shown to be reduced by 16%, and the effective dose(mSv) by 16.3% under the automatic exposure control compared to the manual exposure. Second, the assessment results of GE AEC mode are as follows. The automatic exposure control at the neck resulted in a 45.1% reduction in CTDIvol and DLP, and a 44.7% reduction in the effective dose(mSv) in comparison to the manual exposure control. At the chest, the automatic exposure control displayed a 47.6% reduction in CTDIvol and DLP, and a 47.5% reduction in the effective dose, mSv, compared to the manual exposure control. At the abdomen, it was shown that CTDIvol and DLP were reduced by 26.9%, and the effective dose(mSv) by 26.8% under the automatic exposure control compared to the manual exposure. The assessment results of the two automatic exposure control modes of tube current at
─ 49 ─
* Corresponding author: Kyung-Rae Dong, Tel. +82-62-958-7668, Fax. +82-62-958-7669, E-mail. [email protected]
서도 방사선을 이용하여 반복적인 검사를 통해 질 좋은 영 상을 획득하는 데 있어 신뢰성이 향상되고 검사 범위의 확 대와 의료보험 급여의 적용으로 인한 환자의 경제적 부담 이 경감됨으로써 질병을 진단하는 데 있어 전산화단층촬영 검사(Computed Tomography, CT)에 더욱 초점을 맞추어 신 경을 쓰게 되었다(Kim and Seoung 2012). 특히, 전산화단
층검사 시 적절한 X선 노출 검사 조건의 선량은 낮은 방사
선량으로 더 좋은 영상정보 획득이 중요하다. 최근 추세인 진단을 위해 촬영 시 선량감소의 중요성에 발맞추어 선량
증가를 극복하기 위해 X선 조사 시 환자의 크기와 모양 등
을 고려하여 방사선량을 자동적으로 조절할 수 있는 자동 노출제어(Auto Exposure Control, AEC)장치가 등장하였다 (Kaneko et al. 1996; Hara et al. 1997; Diederich et al. 1999; Seo 2008). 자동노출제어장치는 제조사별로 특징이 다른데 GE사의 AEC(Auto-mA 3D)는 적용 시 몇 가지 사항을 선택할 수 있으며, 선량변조(Dose modulation)를 사용할 것인지 그리 고 관전류의 범위 즉 최소류 값과 최대 관전류 값을 설정할 수 있으며 영상 재구성 알고리즘을 어떤 모드로 사용할지를 사용자가 선택할 수 있다. Siemens사의 AEC 시스템(Care Dose 4D)의 경우 관전류량에 기초한 방식이며, 환자의 체형 이나 관심 부위 크기에 따라서 약함(Week), 보통(Average),
강함(Strong)의 세기로 강약을 조절할 수 있게 설계되었다
(Kim and Seoung 2012).
CT의 중요성이 커지고 선량에 관심이 커진 이때 AEC 장 치 등장은 매우 효율적인 시스템으로 알려졌고 여러 회사별 로도 AEC 장치를 다르게 명칭하고 있다. 최근 논문에서는 AEC mode에 대해 논문으로 다양한 연구가 나오고 있는 실 정이다. 이에 본 연구는 AEC 시스템과 수동 설정 시 환자가 받게 되는 선량값을 비교 평가하기 위해 실제 병원에 있는 두 회사의 CT 촬영 장비를 통해 관전류 자동조절 기법이 선 량에 미치는 영향에 대해 알아보고자 하였다.
tom(Art-20x fluke biomedical, USA)을 SIEMENS의 Care Dose-4D와 General Electric(GE)의 AEC mode를 이용하여 각 부위별(Neck, Chest, Abdoman)과 각 회사별 관전류 자 동 조절기법의 사용 유무에 따라 인체모형인 Rando phan-tom을 이용하여 선량 변화를 조사하였다(Fig. 1).
2. 검사조건
각 장비(S사, G사)별 검사를 위한 파라미터는 Table 1 과 같다. S사의 경우 mAs는 Auto mode에서 Neck, Chest, Abdoman 모두 Care-dose 4D를, Manual mode에서 Neck 200, Chest 100, Abdoman 200를 사용하였다. G사의 mAs는 Auto mode에서 Neck은 mA range 100-600, Noise index 15, Chest는 mA range 100-600, Noise index 18.8, Abdoman은 mA range 100-600, Noise index 21를 사용하였다.
S사, G사 모두 kVp 120, Pitch 1를 사용하였고, Slice thick-ness는 S사 4mm, G사 3.75mm를 사용하였다. Rotation time은 S사, G사 모두 0.5sec를, Field of view(FOV)는 S사, G사 모두 Neck 200mm, Chest 300mm, Abdoman 350mm 를 사용하였다.
Scan length는 S사의 경우 Neck 250mm, Chest 350mm, Abdoman 460mm를 G사의 경우 Neck 250mm, Chest 348.8 mm, Abdoman 461.25mm를 사용하였다. Dose length pro-duct(DLP)는 Equation 1과 같다.
3. 측정방법
관전류 자동 조절기법의 사용 유무에 따라 단위 스캔 부피 내의 평균 방사선량을 나타내는 지표 CTDIvol(Computed tomography dose index volume) 값과 피사체에 조사된 모든
영상에 대한 총 선량 값 DLP, 각각의 장기들에 피폭된 방사
선량에 가중치가 적용된 값인 유효선량(Effective Dose)을 측정하였다(Klingenbeck-Regn et al. 1999; Huh et al. 2008). CTDIvol은 조직의 평균 조사선량을 측정할 수 있도록 하
도록 한다. 방사선에 노출된 체적의 길이(scan length)와 CTDIvol을 알 수 있다면, Equation 1을 이용해 DLP를 계산 할 수 있다(Lee et al. 2005).
DLP=CTDIvol * Scan length (1)
유효선량(Effective dose)은 mSv로 나타내며 방사선에 의
한 확률적인 위험요소를 나타내고 DLP와 컴퓨터 시뮬레이
션이나 실제 측정에서 얻어진 가중치(Conversion Factor, f) 를 곱함으로써 예측할 수 있다(Eq. 2). European Commission 에 보고된 가중치 값은 아래와 같다(Table 2)(Giesler et al. 2002; Kalra et al. 2004; Lee et al. 2005).
Effective Dose=DLP * f (2)
결 과
각 장비별로 모두 관전류 자동조절기법을 사용하였을
때, 단위 스캔 부피 내의 평균 방사선량을 나타내는 지표
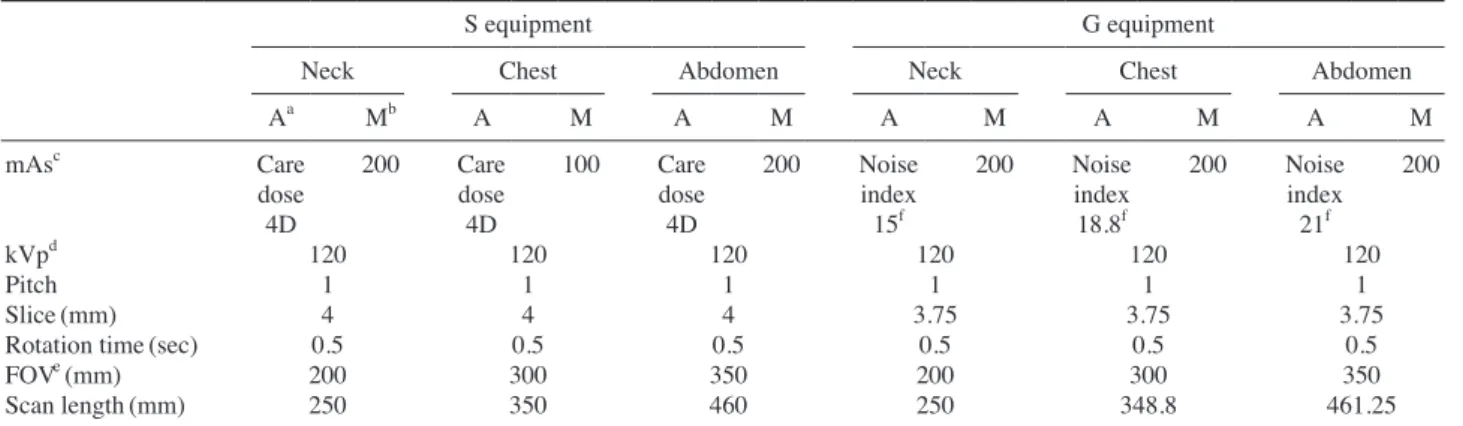
CTDIvol 값과 피사체에 조사된 모든 영상에 대한 총 선량 값 DLP는 S사의 경우 Neck 3.3%, Chest 25.5%, Abdomen 16% 감소하였고, G사의 경우 Neck 45.1%, Chest 47.6%, Abdomen 26.9% 감소하였다. 또한 Effective dose도 각각 S 사의 경우 Neck 3%, Chest 25.4%, Abdomen, 16.3%로 감소 하였고, G사는 Neck 44.7%, Chest 47.5%, Abdomen 26.8% 로 감소하는 결과가 나왔다(Table 3, Fig. 2).
Table 1. Comparison of CT parameters by CT scanner equipments
S equipment G equipment
Neck Chest Abdomen Neck Chest Abdomen
Aa Mb A M A M A M A M A M mAsc Care dose 4D 200 Care dose 4D 100 Care dose 4D 200 Noise index 15f 200 Noise index 18.8f 200 Noise index 21f 200 kVpd 120 120 120 120 120 120 Pitch 1 1 1 1 1 1 Slice(mm) 4 4 4 3.75 3.75 3.75
Rotation time(sec) 0.5 0.5 0.5 0.5 0.5 0.5
FOVe (mm) 200 300 350 200 300 350
Scan length(mm) 250 350 460 250 348.8 461.25
aAuto, bManual, cTube current x second, dTube voltage peak, eField of view. fThe 100-600mA range.
Table 2. Effective dose of European commission guideline
Region of body fa Head 0.0023 Neck 0.0054 Chest 0.017 Abdoman 0.015 Pelvis 0.019
aConversion factor. The unit is the number of mSv.
고 찰
피폭선량에 대한 관심이 대두됨에 발맞추어 CT 장비의 하드웨어적인 측면과 더불어 소프트웨어적인 측면의 발전 또한 환자의 피폭선량을 줄이는 것에 초점을 맞추어 많은 성장을 이루었으며, 그 결과 최근 CT에는 모두 관전류 자동 조절기법, 관전압자동조절기법 시스템이 있어, 이것은 환자 의 피폭선량을 낮추고 보다 정확한 영상정보를 얻는 데 있 어 기본 요구조건이 되었다. 피폭선량이란, 검사 시 X-선이 조사된 인체조직의 국소영역 내의 아주 작은 용적에서 단위 질량 당 흡수된 에너지를 말한다. 이 선량은 주 선속뿐만 아 니라 인체 구조의 투과 시 발생된 산란선, X-선관 용기로부Table 3. Comparison of radiation dose by CT scanner equipments
S equipment G equipment
Neck Chest Abdomen Neck Chest Abdomen
Aa Mb A M A M A M A M A M
CTDIvolc (mGy) 13.02 13.46 5.03 6.75 14.18 16.88 4.24 7.72 4.11 7.84 5.77 7.89
DLPd (mGy
*cm) 362.7 374.9 200 268.4 680.6 811.7 115.8 210.7 162.5 309.7 292.7 400.6
Effective dose(mSv) 1.96 2.02 3.40 4.56 10.2 12.18 0.62 1.13 2.76 5.26 4.39 6.01
aAuto, bManual, cComputed tomography dose index volume, dDose length product.
0 200 400 600
DLP
Neck Chest Abdomen
0 2 4 6 8 10 12 14 E
Neck Chest Abdomen
Siemens S-Auto S-Manual 0 100 200 300 DLP
Neck Chest Abdomen
G E 0 1 2 3 4 5 6 7 E
Neck Chest Abdomen
G-Auto G-Manual
터 누설되는 이차 방사선에 의해 조직 내 단층 촬영되는 단 면과 직각 방향뿐만 아니라 동일 단면 내의 위치에 따라 차 이가 생긴다(Shin et al. 2007; Yoo et al. 2010). 본 연구에서, 본원의 CT 검사 조건 하에 정교한 Rando pantom과 최신 의 CT 장비(S사, G사)를 이용하여 단위 스캔 부피 내의 평 균 방사선량 평균을 조사한 결과 S사 Manual의 경우 12.36 mGy가 나왔고, S사 auto의 경우 평균 10.74mGy로 감소 하였고, G사 Manual의 경우 7.78mGy가 나왔고, G사 auto 의 경우 평균 4.71mGy로 감소하였다. 선량감소 비율을 보 면 S사의 경우 13.1%, G사는 39.5% 감소하였다. 해당 다른 논문에 의하면 G사는 Plus mode에서 Auto-mA와 Smart-mA를 같이 작동 했을 때 35.3%, S사는 강함/약함의 조합에 서 48.6%로 가장 많은 방사선량 감소 효과를 통해 기법의
사용과 연구가 앞으로의 CT 촬영의 중요성으로 나타났다
(Kim 2004; Kim and Yoo 2012).
이를 통해 기법을 사용하였을 때 환자가 받는 선량을 효 율적으로 감소시키는 결과를 뒷받침해주었다. 사용자는 여 러 가지 기술적 인자들의 최적 사용을 통해 진단적 연구와 노력을 계속해야겠다. 이를 위해서는 CT 검사를, 추적검사 와 병리학적 특성이 이미 알려져 있는 상황에서는 스캔 범 위와 필요이상의 스캔 단면 수를 줄이고 잘못된 검사로 인 한 반복 노출을 피해야 할 것이다(Nam et al. 2003; Shin et al. 2007). 현재 CT 검사의 적용과 수요가 증가추세에 있기 때문에 피폭선량 감소에 대한 노력이 더욱더 절실할 것이 다. 그리고 CT 검사 시 각 의료기관의 장비의 종류에 따라 서 동일한 부위를 검사하는 경우라도 환자가 받게 되는 선 량에 차이가 발생한다. 그러므로 적절한 관리기준이 설정되 어야 한다. 이런 점에서 본 논문의 한계는 현재 임상에서 다 른 두 회사의 장비를 각각 사용하였고 환자마다 다른 특징 을 제외하고 일정하게 정형화된 팬텀을 사용했다는 점이다. 앞으로 불필요한 선량을 줄이고 영상의 품질을 향상시키기 위한 추가적인 기술개발이 필요하다고 생각된다.
결 론
최근 수년간 과학의 발달로 인해 평균 수명이 늘어남에 따라 건강에 대한 관심이 높아졌다. 그로 인해 건강검진 및 병변 진단에 쓰이는 CT 검사의 사용빈도가 증가하였는데 CT는 질 좋은 영상획득에 있어 신뢰성이 높지만 그에 반해 불필요한 환자피폭의 가능성도 증가했다고 볼 수 있다. 이 에 불필요한 피폭선량을 감소시키고자 환자의 크기 및 모 양을 반영해 방사선량을 자동적으로 조절할 수 있는 AEC 가 쓰인다. 본 연구에서는 두 회사의 CT 장비(S사, G사)의 Auto와 Manual에 따른 CTDIvol, DLP, mSv를 Rando 팬텀으로 실험해 알아보고자 했다. 각 CT 장비의 제조사마다 외
형과 작동원리는 비슷하지만 장비의 X선관, 검출기 등 CT
의 구조가 달라 피폭선량 감소에도 미세한 차이가 있었다.
S사의 경우 선량이 neck 3.3%, chest 25.5%, abdomen 16% 감소했고, G사의 경우 선량이 neck 45.1%, chest 47.6%, abdomen 26.9% 감소하였다. 이 결과적으로 보면 AEC를 사 용함에 따라 환자피폭을 감소시키는 것을 알 수 있었다. 또 한 영상 품질에 영향이 끼칠 거라는 예상과 달리 영상의 잡 음이 증가하거나 감소하는 등의 변화는 보이지 않았고 영 상 품질은 그대로 유지한 채 선량만 감소되었다. 이로 보아 AEC 기법은 영상품질의 우수함은 유지하면서 불필요한 피 폭선량을 감소하는 데 매우 유용하며 환자에게 있어 건강의 질을 높이고 방사선 피폭에 대한 불안감을 줄여줄 것이라고 사료된다.
참 고 문 헌
Diederich S, Semik M, Lentschig MG, Winter F, Scheld HH, Roos N and Bongartz G. 1999. Helical CT of pulmonary nodules in patients with extrathoracic malignancy: CT-sur-gical correlation. Am. J. Roentgenol. 172(2):353-360. Hara AK, Johnson CD and Reed JE. 1997. Colorectal lesions:
evaluation with CT colography. Radiographics 17(5):1167-1168.
Huh JY, Bhum HN, Jung JB, Kim CG and Sun JB. 2008. A Study on the Reduction Dose of Radiation When Examin-ing Coronary Artery through CT Tube Current Modulation Employing 64VCT. J. Kor. Soc. Comput. Tomogr. Technol.
10(1):41-45.
Giesler T, Baum U, Ropers D, Ulzheimer S, Wenkel E, Men-nicke M, Bautz W, Kalender WA, Daniel WG and Achen-bach S. 2002. Noninvasive visualization of coronary arter-ies using contrast-enhanced multidetector CT: influence of heart rate on image quality and stenosis detection. Am. J. Roentgenol. 179(4):911-916.
Kalra MK, Maher MM, Toth TL, Kamath RS, Halpern EF and Saini S. 2004. Comparison of Z-axis automatic tube current modulation technique with fixed tube current CT scanning of abdomen and pelvis. Radiology 232(2):347-353. Kaneko M, Eguchi K, Ohmatsu H, Kakinuma R, Naruke T,
Suemasu K and Moriyama N. 1996. Peripheral lung cancer: screening and detection with low-dose spiral CT versus radiography. Radiology 201(3):798-802.
Kim HO. 2004. Speed4D Technology with SOMATOM Sensa-tion 64. J. Kor. Soc. Comput. Tomogr. Technol. 6(1):54-58. Kim YO and Seoung YH. 2012. A Study on Various Automatic
Exposure Control System in Multi-Detector Computed To-mography by Using Human Phantom. J. Kor. Acad. Indus. Cooper. Soc. 13(4):1714-1720.