Coronavirus Disease-19 (COVID-19) 6-month outbreak infection report as of
July 19, 2020, in the Republic of Korea
This is a 6 months report on the Coronavirus Disease-19 (COVID-19) situation in the Republic of Korea based on the confirmed cases reported through the Integrated System to Korea Centers for Disease Control and Prevention according to the INFECTIOUS DISEASE CONTROL AND PREVENTION ACT and based on the epidemiological investigation by central and local health authorities.
As of July 19, 2020, there were 13,745 confirmed cases of COVID-19, and including 295 deaths. Confirmed cases were reported in all 17 provinces/cities in Korea, with the highest number of cases from Daegu, Seoul, Gyeonggi and Gyeongbuk Province. The results indicated that, by gender, women accounted for a slightly higher proportion (55.8%) of total confirmed cases than men.
The main infectious paths confirmed by epidemiological investigations showed several major clusters related to COVID-19. Of the total cases, the proportion of imported cases was 14.9%; 37.9% were Shincheonji (and related); 27.2% are small clusters and contacts of confirmed cases (other than Shincheonji); and 8.6% are currently under investigation as per infection route surveys.
Keywords: 2019 Novel Coronavirus (2019-nCoV), Coronavirus Disease-19 (COVID-19), Outbreaks, Epidemiological
monitoring, Epidemiological investigation, Social distancing, Enhanced social distancing, Distancing in daily life
Kwangsuk Park1, Younghwa Kim1, Hansol Yeom1, Insob Hwang1, Jaewoo Kwon1, Miyoung Kim1, Young Joon Park1,
Jin Gwack1, Ok Park1
1Case and Contact Management Task Force, Central Disease Control Headquarters
Introduction
Coronavirus disease 2019 (COVID-19), which started in Wuhan, China and was first announced on December 31, 2019, has infected 14,043,176 people worldwide as of July 19, 2020. In South Korea, the first case was reported on January 20, 2020, and 13,745 cumulative cases have been documented as of July 19, 2020. The South Korean government is currently maintaining the highest crisis alert level (level 4) for COVID-19, and the entire government is focused on the response to COVID-19 through the operations of the Central Disaster and Safety Countermeasure Headquarters headed by the Prime Minister.
South Korea’s COVID-19 response in the past 6 months can be classified into a first phase, which mainly involved imported cases, a second phase when a large community outbreak associated with the Shincheonji religious group and other outbreaks prompted strong social distancing measures, and the current third phase where occasional community outbreaks and sporadic cases are being reported under a more relaxed set of social distancing guidelines.
This report presents an analysis of the current situation and the major aspects of the nation’s response to COVID-19 as South Korea enters month 6 of the COVID-19 response. COVID-19 case data reported from hospitals are subject to change after
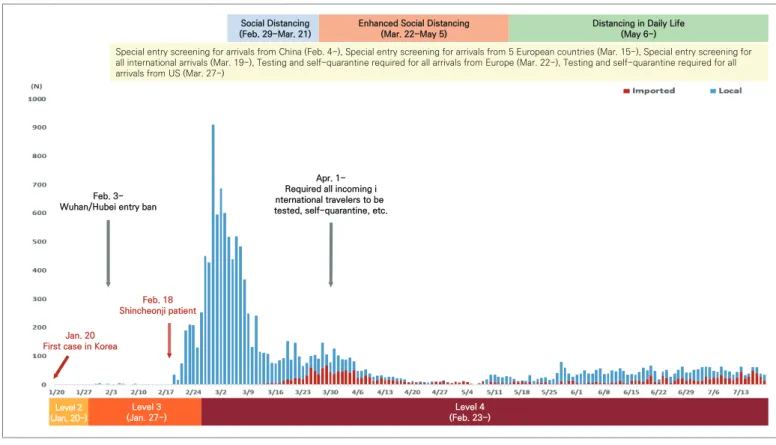
Level 2
(Jan. 20-) (Jan. 27-)Level 3 (Feb. 23-)Level 4
Social Distancing
(Feb. 29-Mar. 21) Enhanced Social Distancing(Mar. 22-May 5) Distancing in Daily Life(May 6-)
Special entry screening for arrivals from China (Feb. 4-), Special entry screening for arrivals from 5 European countries (Mar. 15-), Special entry screening for all international arrivals (Mar. 19-), Testing and self-quarantine required for all arrivals from Europe (Mar. 22-), Testing and self-quarantine required for all arrivals from US (Mar. 27-)
Jan. 20 First case in Korea
Feb. 18 Shincheonji patient
Apr. 1-Required all incoming i nternational travelers to be tested, self-quarantine, etc. Feb.
3-Wuhan/Hubei entry ban
Figure 1. Local situation and response progression since the first local case 6 month ago
an epidemiological investigation to confirm the route of transmission, and the statistics by region can differ from the COVID-19 situation reports issued by local governments as the statistics are based on the address of the reporting agency. The data presented should be interpreted with those caveats in mind.
Result
Trends in major characteristics of cases over time
The COVID-19 case trends in South Korea can be divided into the following three phases according to the major characteristics of cases and the response.
The first phase (January 20 to February 17) was characterized by sporadic individual cases that were imported, mainly from China. The total number of cases in the first phase
was 30, among which 17 (56.7%) were imported cases. After the first reported case in South Korea, the government raised the crisis alert level from level 2 to 3. Starting on February 4, special border screening measures for inbound travelers from China were put in place.
The second phase (February 18 to May 5) started with a mass cluster outbreak associated with the Shincheonji religious group in Daegu and Gyeongbuk Province and continued with community outbreaks in hospitals, religious institutions, and public facilities throughout the entire country. The total number of cases in the second phase was 10,774, with an average number of cases per day of 138.13. With the spread of community outbreaks, the crisis alert level was adjusted from level 3 to level 4 on February 23, and social distancing measures were put in place on February 29. Despite these efforts, cases continued to emerge, which prompted a strengthened social distancing policy on March 22. The number of cases started to decrease as
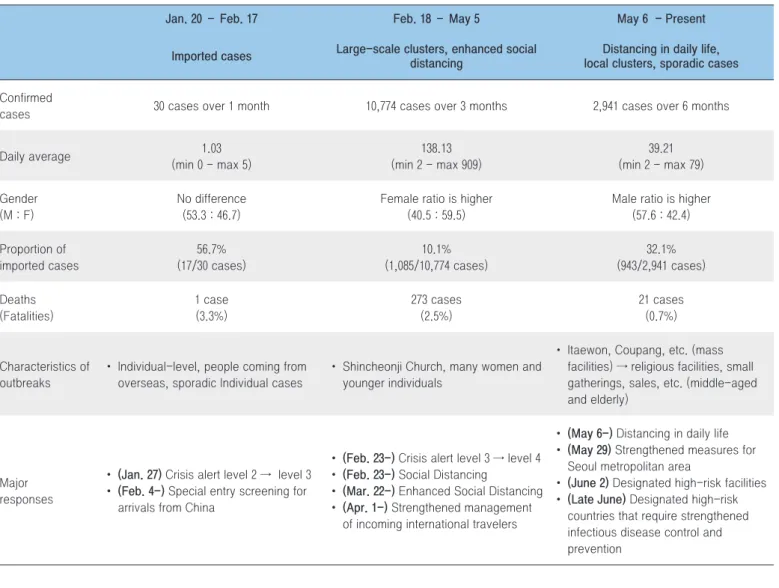
Table 1. Main characteristics of outbreaks
Jan. 20 – Feb. 17 Feb. 18 – May 5 May 6 - Present Imported cases Large-scale clusters, enhanced social
distancing
Distancing in daily life, local clusters, sporadic cases Confirmed
cases 30 cases over 1 month 10,774 cases over 3 months 2,941 cases over 6 months
Daily average 1.03 (min 0 - max 5) 138.13 (min 2 - max 909) 39.21 (min 2 - max 79) Gender (M : F) No difference (53.3 : 46.7)
Female ratio is higher (40.5 : 59.5)
Male ratio is higher (57.6 : 42.4) Proportion of imported cases 56.7% (17/30 cases) 10.1% (1,085/10,774 cases) 32.1% (943/2,941 cases) Deaths (Fatalities) 1 case (3.3%) 273 cases (2.5%) 21 cases (0.7%) Characteristics of outbreaks
• Individual-level, people coming from overseas, sporadic Individual cases
• Shincheonji Church, many women and younger individuals
• Itaewon, Coupang, etc. (mass facilities) → religious facilities, small gatherings, sales, etc. (middle-aged and elderly)
Major responses
• (Jan. 27) Crisis alert level 2 → level 3 • (Feb. 4-) Special entry screening for
arrivals from China
• (Feb. 23-) Crisis alert level 3 → level 4 • (Feb. 23-) Social Distancing
• (Mar. 22-) Enhanced Social Distancing • (Apr. 1-) Strengthened management
of incoming international travelers
• (May 6-) Distancing in daily life • (May 29) Strengthened measures for
Seoul metropolitan area
• (June 2) Designated high-risk facilities • (Late June) Designated high-risk
countries that require strengthened infectious disease control and prevention
new community outbreaks were prevented. To respond to the increasing number of imported cases since April, management of all incoming travelers was also strengthened on April 1.
The third phase (May 6 to present) began with relaxing the social distancing measures while maintaining the crisis alert level 4. A cluster of cases that began in entertainment venues in Seoul in early May spread to adjacent regions. Due to cases in crowded and enclosed places forming a chain of infections, sporadic cases continue to occur until now. Various groups have been associated with infection clusters, such as nightclubs, large logistics centers, religious groups, and door-to-door sales, in the Seoul metropolitan area and the Chungcheong and Honam areas. Imported case numbers have increasedas well. As of July 19, the average number
of cases per day in the third phase was 39.21. The government implemented stronger quarantine measures in the Seoul metropolitan area on May 29, and on June 2, asked citizens to abide by social distancing measures by designating high-risk facilities. Starting in late June, the government also designated countries for which border screening measures would be strengthened to respond to increased numbers of imported cases from Asia (other than China) and other regions (Figure 1, Table 1).
Characteristics of cases by sex, age, and region
There were more female cases (55.8%) than males, and the overall incidence rate (per 100,000) was 26.5. In terms of age,
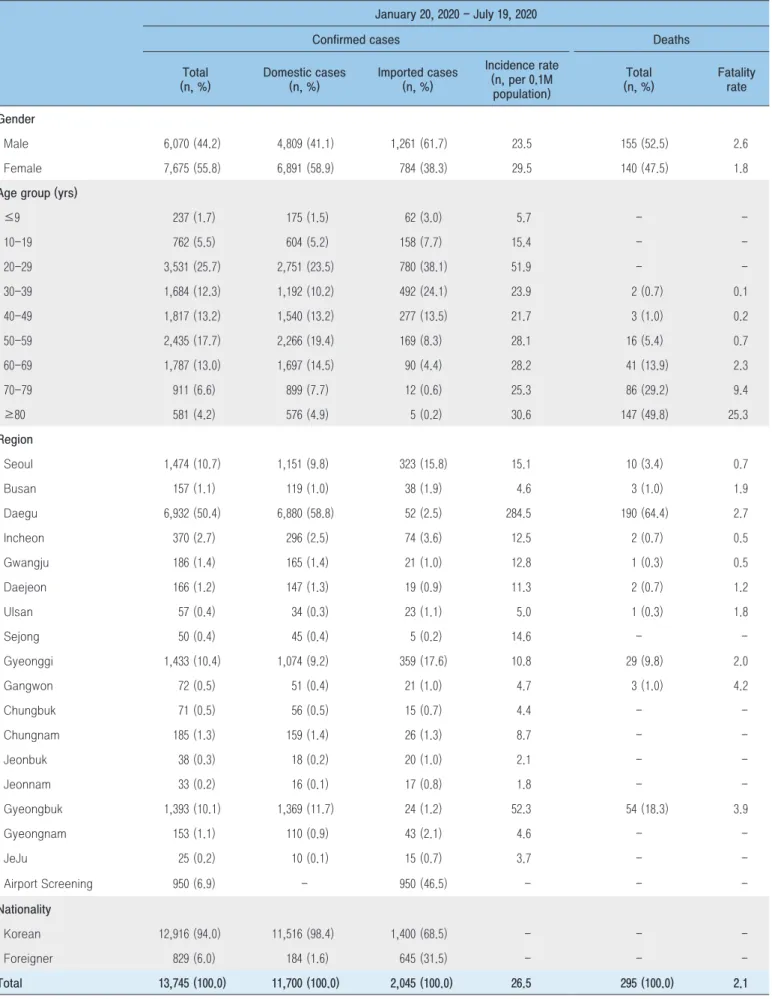
Table 2. The number of confirmed/deceased cases and the incidence rate
January 20, 2020 - July 19, 2020
Confirmed cases Deaths Total (n, %) Domestic cases (n, %) Imported cases (n, %) Incidence rate (n, per 0.1M population) Total (n, %) Fatality rate Gender Male 6,070 (44.2) 4,809 (41.1) 1,261 (61.7) 23.5 155 (52.5) 2.6 Female 7,675 (55.8) 6,891 (58.9) 784 (38.3) 29.5 140 (47.5) 1.8
Age group (yrs)
≤9 237 (1.7) 175 (1.5) 62 (3.0) 5.7 - 10-19 762 (5.5) 604 (5.2) 158 (7.7) 15.4 - 20-29 3,531 (25.7) 2,751 (23.5) 780 (38.1) 51.9 - 30-39 1,684 (12.3) 1,192 (10.2) 492 (24.1) 23.9 2 (0.7) 0.1 40-49 1,817 (13.2) 1,540 (13.2) 277 (13.5) 21.7 3 (1.0) 0.2 50-59 2,435 (17.7) 2,266 (19.4) 169 (8.3) 28.1 16 (5.4) 0.7 60-69 1,787 (13.0) 1,697 (14.5) 90 (4.4) 28.2 41 (13.9) 2.3 70-79 911 (6.6) 899 (7.7) 12 (0.6) 25.3 86 (29.2) 9.4 ≥80 581 (4.2) 576 (4.9) 5 (0.2) 30.6 147 (49.8) 25.3 Region Seoul 1,474 (10.7) 1,151 (9.8) 323 (15.8) 15.1 10 (3.4) 0.7 Busan 157 (1.1) 119 (1.0) 38 (1.9) 4.6 3 (1.0) 1.9 Daegu 6,932 (50.4) 6,880 (58.8) 52 (2.5) 284.5 190 (64.4) 2.7 Incheon 370 (2.7) 296 (2.5) 74 (3.6) 12.5 2 (0.7) 0.5 Gwangju 186 (1.4) 165 (1.4) 21 (1.0) 12.8 1 (0.3) 0.5 Daejeon 166 (1.2) 147 (1.3) 19 (0.9) 11.3 2 (0.7) 1.2 Ulsan 57 (0.4) 34 (0.3) 23 (1.1) 5.0 1 (0.3) 1.8 Sejong 50 (0.4) 45 (0.4) 5 (0.2) 14.6 - Gyeonggi 1,433 (10.4) 1,074 (9.2) 359 (17.6) 10.8 29 (9.8) 2.0 Gangwon 72 (0.5) 51 (0.4) 21 (1.0) 4.7 3 (1.0) 4.2 Chungbuk 71 (0.5) 56 (0.5) 15 (0.7) 4.4 - Chungnam 185 (1.3) 159 (1.4) 26 (1.3) 8.7 - Jeonbuk 38 (0.3) 18 (0.2) 20 (1.0) 2.1 - Jeonnam 33 (0.2) 16 (0.1) 17 (0.8) 1.8 - Gyeongbuk 1,393 (10.1) 1,369 (11.7) 24 (1.2) 52.3 54 (18.3) 3.9 Gyeongnam 153 (1.1) 110 (0.9) 43 (2.1) 4.6 - JeJu 25 (0.2) 10 (0.1) 15 (0.7) 3.7 - Airport Screening 950 (6.9) - 950 (46.5) - - -Nationality Korean 12,916 (94.0) 11,516 (98.4) 1,400 (68.5) - - Foreigner 829 (6.0) 184 (1.6) 645 (31.5) - - -Total 13,745 (100.0) 11,700 (100.0) 2,045 (100.0) 26.5 295 (100.0) 2.1
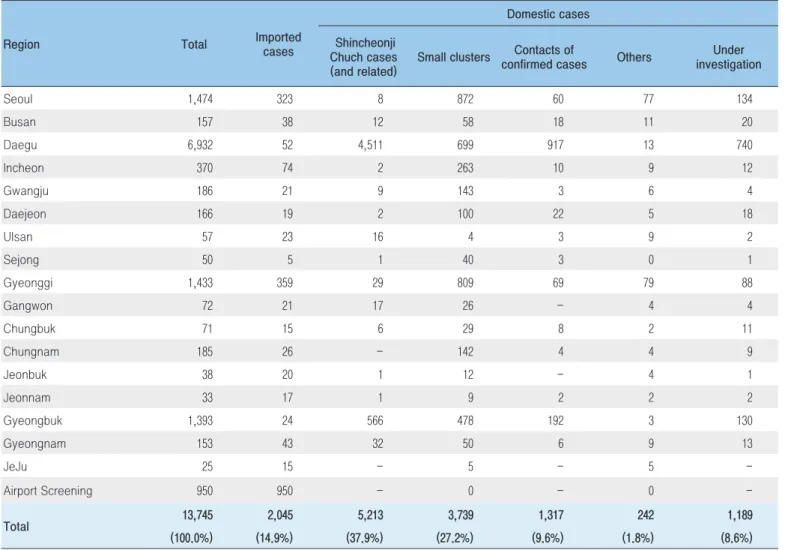
Table 3. Regional distribution and epidemiological links of confirmed cases
Region Total Imported cases
Domestic cases Shincheonji
Chuch cases (and related)
Small clusters confirmed casesContacts of Others investigationUnder
Seoul 1,474 323 8 872 60 77 134 Busan 157 38 12 58 18 11 20 Daegu 6,932 52 4,511 699 917 13 740 Incheon 370 74 2 263 10 9 12 Gwangju 186 21 9 143 3 6 4 Daejeon 166 19 2 100 22 5 18 Ulsan 57 23 16 4 3 9 2 Sejong 50 5 1 40 3 0 1 Gyeonggi 1,433 359 29 809 69 79 88 Gangwon 72 21 17 26 - 4 4 Chungbuk 71 15 6 29 8 2 11 Chungnam 185 26 - 142 4 4 9 Jeonbuk 38 20 1 12 - 4 1 Jeonnam 33 17 1 9 2 2 2 Gyeongbuk 1,393 24 566 478 192 3 130 Gyeongnam 153 43 32 50 6 9 13 JeJu 25 15 - 5 - 5 -Airport Screening 950 950 - 0 - 0 -Total 13,745 2,045 5,213 3,739 1,317 242 1,189 (100.0%) (14.9%) (37.9%) (27.2%) (9.6%) (1.8%) (8.6%)
those in their 20s accounted for the highest proportion of cases (25.7%), followed by those in their 50s (17.7%). Many cases were identified in Daegu, Gyeongbuk Province, and the Seoul metropolitan area, with 50.4% of cases in Daegu, 10.7% in Seoul, 10.4% in Gyeonggi Province, and 10.1% in Gyeongbuk Province. The incidence rate (per 100,000) by region was 284.5 in Daegu, 52.3 in Gyeongbuk Province, 15.1 in Seoul, 14.6 in Sejong, and 12.8 in Gwangju.
Among fatalities, there were more males (52.5%) than females, and the overall fatality rate was 2.1%. The vast majority (92.9%) of all deaths occurred in patients olderthan 60, and the fatality rate increased with age. The fatality rate in those aged 80 or above was 25.3%. Furthermore, 64.4% of all deaths occurred
in Daegu, 18.3% in Gyeongbuk Province, and 9.8% in Gyeonggi Province (Table 2).
Case characteristics by infection route
Epidemiological investigations in the past 6 months revealed that the main routes of transmission were the Shincheonji religious group (37.9%), community outbreaks (27.2%), imported cases (14.9%), contacts with infected individuals (9.6%), and pending investigation (8.6%).
In South Korea, Shincheonji-related cluster infections were reported from week 8, in the second phase of the outbreak, to week 16. Almost all (97.4%) of the Shincheonji-related cases
occurred in Daegu and Gyeongbuk Province. Most of the small and large community outbreaks at businesses, religious facilities, public facilities, hospitals, and care facilities that continued in the third phase occurred in the Seoul metropolitan area (43.1%) and Daegu and Gyeongbuk Province (31.5%) (Table 3).
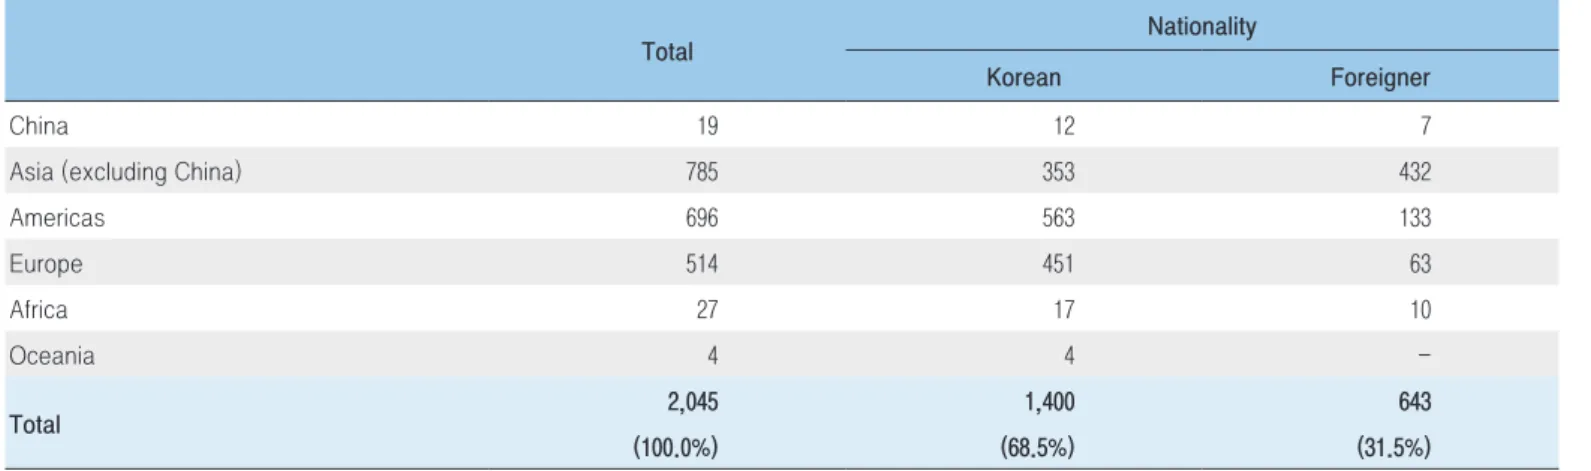
Imported cases have been steadily reported ever since the first case was imported from China in the first phase of the outbreak. From week 13 to week 17 in the second phase, many imported cases were from the Americas and Europe, but starting in week 25 in the third phase, the number of imported cases from Asia (other than China) has been increasing. Recently, the number of foreigners who test positive after arrival has
been increasing, with 31.5% of all imported cases of foreign nationality. Since stronger border screening measures were implemented, the proportion of positive cases identified during the screening process has increased. The number of cases diagnosed positive during a 14-day quarantine after entering the country was highest in Gyeonggi Province, followed by Seoul (Table 4, Figure 2).
Status of release from isolation
As of July 19, 2020, among 13,745 COVID-19 cases, 12,556
Table 4. Regional distribution and epidemiological links of imported cases
Total Nationality
Korean Foreigner
China 19 12 7
Asia (excluding China) 785 353 432
Americas 696 563 133 Europe 514 451 63 Africa 27 17 10 Oceania 4 4 -Total 2,045 1,400 643 (100.0%) (68.5%) (31.5%) 0 10 20 30 40 50 60 70 1/20 1/27 2/3 2/10 2/17 2/24 3/2 3/9 3/16 3/23 3/30 4/6 4/13 4/20 4/27 5/4 5/11 5/18 5/25 6/1 6/8 6/15 6/22 6/29 7/6 7/13
China Asia excluding China Europe Americas Africa Oceania
0 10 20 30 40 50 60 70 Domestic Foreigner
0 2,000 4,000 6,000 8,000 10,000 12,000 14,000 16,000 1.10 1.17 1.24 1.31 2.7 2.14 2.21 2.28 3.6 3.13 3.20 3.27 4.3 4.10 4.17 4.24 5.1 5.8 5.15 5.22 5.29 6.5 6.12 6.19 6.26 7.3 7.10 7.17
Cumulative number of COVID-19 cases
Isolated Released from isolation Deaths
Figure 3. Total confirmed cases and case statuses
0 500 1,000 1,500 2,000 2,500 3,000 3,500 4,000 ≤9 10-19 20-29 30-39 40-49 50-59 60-69 70-79 ≥80
Released from isolation Deaths treated
Figure 4. The distribution of case status by age group
(91.3%) had been released from isolation. Other than the 295 fatalities (2.1%), 894 (6.6%) were receiving treatment (Figure 3, Figure 4).
Conclusion
Since the first case in South Korea was reported on January 20, 2020, a total of 13,745 cases have been reported as of July 19, 2020. This report presents an analysis of the situation in South Korea and shares the results of the country’s response as it enters month 6 of the COVID-19 outbreak (based on data available as of July 19).
Although community outbreaks are decreasing, small-scale community outbreaks associated with door-to-door sales and care facilities in the Seoul metropolitan area and the Honam area continue to be reported. In order to prevent community outbreaks, it is necessary to abide by the applicablequarantine policies such as limiting the visits associated with door-to-door sales. Moreover, both policies requiring social distancing and aculture of social distancing should be established and normalized, and education and public awareness campaigns should be regularly provided to promote preventive measures such as proper mask wearing and handwashing and to establish social norms.
Moreover, since the number of imported cases has been increasing recently, it is necessary to establish an effective response strategy for combattingthe COVID-19 outbreak in South Korea that includes more intensive management of incoming travelers by country based on an assessment of risk in each country.
① What was previously known?
Since COVID-19 was first reported in China in January 2020, new cases have continued to be reported, both in South Korea and around the world.
② What is newly learned?
In the past 6 months (January 20 to July 19) a total of 13,745 COVID-19 cases have occurred in South Korea, among whom 295 died. We categorized the COVID-19 situation and response in South Korea into three phases and identified increasing or decreasing trendsin community outbreaks and imported cases by phase.
③ Implications?
The Korea Centers for Disease Control and Prevention,based on the COVID-19 case reports from hospitals made according to the infectious disease prevention law and epidemiological investigations by central and local epidemiological investigation teams, is sharing this analysis of COVID-19 case trends and response results in the past 6 months in order for the data to be used to establish effective response strategies and quarantine measures.
This article has been translated from the Public Health Weekly Report (PHWR) volume 13, Number 30, 2020.