저작자표시-비영리-변경금지 2.0 대한민국 이용자는 아래의 조건을 따르는 경우에 한하여 자유롭게 l 이 저작물을 복제, 배포, 전송, 전시, 공연 및 방송할 수 있습니다. 다음과 같은 조건을 따라야 합니다: l 귀하는, 이 저작물의 재이용이나 배포의 경우, 이 저작물에 적용된 이용허락조건 을 명확하게 나타내어야 합니다. l 저작권자로부터 별도의 허가를 받으면 이러한 조건들은 적용되지 않습니다. 저작권법에 따른 이용자의 권리는 위의 내용에 의하여 영향을 받지 않습니다. 이것은 이용허락규약(Legal Code)을 이해하기 쉽게 요약한 것입니다. Disclaimer 저작자표시. 귀하는 원저작자를 표시하여야 합니다. 비영리. 귀하는 이 저작물을 영리 목적으로 이용할 수 없습니다. 변경금지. 귀하는 이 저작물을 개작, 변형 또는 가공할 수 없습니다.
Doctoral Thesis in
Medical Sciences
Bioelectrical impedance analysis values
as markers to predict severity
in critically ill patient
Ajou University Graduate School
Medical Sciences Major
Bioelectrical impedance analysis values
as markers to predict severity
in critically ill patient
Hee Jung Wang, M.D., Ph.D., Advisor
I submit this thesis as the
Doctoral thesis in Medical Sciences.
August 2018
Ajou University Graduate School
Medical Sciences Major
This certifies that the dissertation of
Jae-myeong Lee is approved.
Ajou Graduate School, Ajou University
June, 22nd, 2018
i
ABSTRACT
-Bioelectrical impedance analysis values as markers to predict severity in critically
ill patients
Background: We investigated bioelectrical impedance analysis (BIA)-derived parameters in critically ill
patients to evaluate any differences between survivors and non-survivors.
Methods: We calculated severity scores for 241 critically ill surgical patients (161 male and 80 female; mean
age, 62.9 years) using three severity scoring systems (Acute Physiology and Chronic Health Evaluation II, Sequential Organ Failure Assessment, and Simplified Acute Physiology Score III). Body composition was measured using a portable BIA device for segmental BIA.
Results: Among the BIA values, impedance (odds ratio [OR], 0.99; P<0.001), reactance (OR 0.90; P<0.001),
and phase angle (PhA) (OR, 0.53; P<0.001) were highly statistically significant for predicting mortality in univariate and multivariate logistic regression analysis. Comparison of area under the curve (AUC) between severity scoring systems and BIA values showed statistically significant differences between reactance and PhA with all three severity scoring systems. Covariate-adjusted receiver operating characteristic curve analysis showed that compared with severity scoring, all three BIA values (impedance, reactance, and PhA) had higher AUC values.
Conclusion: PhA, impedance, and reactance determined by BIA in critically ill patients were associated with
mortality outcomes and revealed stronger predictive power for mortality than severity scoring systems commonly used in an intensive care unit.
__________________________________________________________________________________________ Keywords: Bioelectrical impedance, Critical illness, Severity of illness index, Biomarkers
ii
TABLE OF CONTENTS
ABSTRACT ··· i
TABLE OF CONTENTS ··· ii
LIST OF TABLES ··· iii
LIST OF FIGURE ··· iv
I. INTRODUCTION ··· 1
II. MATERIALS AND METHODS ··· 3
A. Subject Population ··· 3
B. Severity scoring systems ··· 3
C. BIA measurement ··· 3 D. Nutritional assessment ··· 4 E. Statistical analysis ··· 5 III. RESULTS ··· 6 IV. DISCUSSION ··· 16 V. CONCLUSION ··· 19 REFERENCES ··· 20 국문요약 ··· 23
iii
LIST OF TABLES
Table 1. Comparison of patient characteristics, BMI, severity scores, and BIA data between survivors and non-survivors. ··· 7
Table 2. Univariate logistic regression analysis of predictors of death during hospitalization. ··· 11
Table 3. Adjusted odds ratios of mortalities by severity scores and BIA values in multivariate logistic regression analysis (adjusted for age, sex, and BMI). ··· 13
Table 4. Comparison between ROC curves for severity scores and BIA values (adjusted for age, sex, and BMI). ··· 15
iv
LIST OF FIGURE
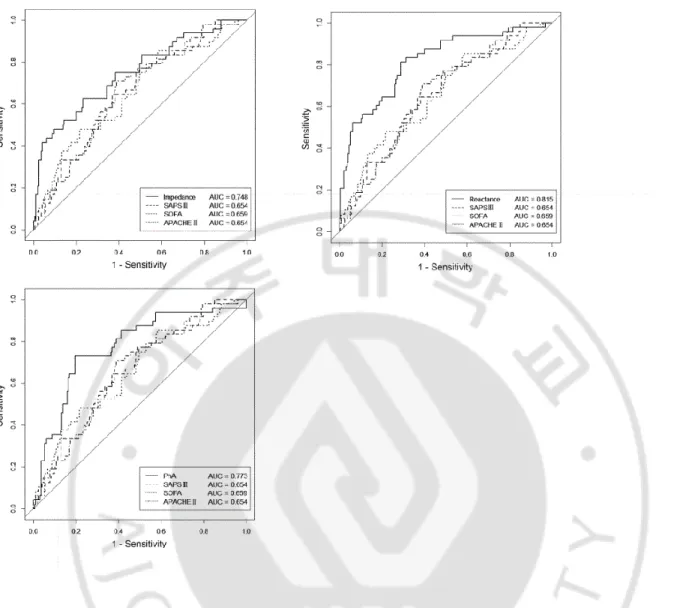
Figure 1. Multivariate-adjusted ROC curves for BIA data (reactance, impedance, and PhA) and severity scores (APACHE II, SOFA, and SAPS III) adjusted for age, sex, and body mass index. A) ROC curve for impedance and severity scores. B) ROC curves for reactance and severity scores. C) ROC curves for PhA and severity scores. ··· 14
1
I. INTRODUCTION
Since the condition of critically ill patients can change rapidly, and their vital signs are often unstable, it is difficult to accurately predict mortality or medical outcomes. Therefore, many previous studies attempting to predict the mortality of critically ill patients used severity scoring systems such as Simplified Acute Physiology Score (SAPS), Sequential Organ Failure Assessment (SOFA), or Acute Physiology and Chronic Health Evaluation (APACHE), which use various indicators such as vital signs, blood and urine composition, and urine output. However, because these severity scoring systems often lack accuracy (Bouch et al., 2008; Wong et al., 1991; Vincent et al., 1996), efforts are being made to improve them or find more accurate and efficient methods to predict the outcomes.
For Bioelectrical impedance analysis (BIA) analysis, it is generally assumed that the measured body is one cylinder. In contrast, the InBody analyzer uses direct segmental measurement bioelectric impedance analysis (DSM-BIA), a patented technology, to precisely measure the body as 5 separate cylinders, four limbs and the trunk. BIA allows estimation of several factors of human body composition (Kyle et al., 2004; Kyle et al., 2004). The principle of BIA involves passing a small single- or multiple-frequency alternating current (1–10 μA) through the body and measuring the resulting impedance composed of resistance, capacitive reactance, and the phase angle (PhA). As the body’s electrical conductivity depends on its composition (fat and water content), the total body water (TBW), as well as the intra- and extracellular water content (ICW and ECW, respectively) can be estimated. PhA represents the phase difference between voltage and current and is related to the number of healthy cells in the body. Experimental results further allow calculation of fat mass (FM), fat-free mass (FFM), and cell mass by using a regression equation based on measuring values. Furthermore, it is possible to determine the water content and muscle mass for specific body parts such as arms, legs, and the trunk.
2
As a noninvasive method, BIA is widely used in clinical settings because it provides a convenient tool to easily and quickly examine body composition at a patient’s bedside (Kyle et al., 2004; Kyle et al., 2004, Lukaski et al., 1986; Reis de Lima e Silva et al. 2015). In particular, the PhA is a useful indicator of nutritional status (Gupta et al., 2004; Gupta et al., 2004; Schwenk et al., 2000; Kyle et al., 2013), and hence for the patient’s overall condition (Schwenk et al., 2000; Kyle et al., 2013; Hui et al., 2014; Kaido et al., 2012).
BIA studies on critically ill patients are rare due to the concern that their severely imbalanced state of body fluids might affect BIA results (Barak et al., 2003; Berneis et al., 2000). However, some recent studies suggested the possibility of evaluating nutritional status and predicting mortality of critically ill patients using segmental BIA (Reis de Lima e Silva et al., 2015; Basso et al., 2013; Malbrain et al., 2014; Lee et al., 2015; Jones et al., 2015; de Silva et al., 2015).
In the present study, we intended to gain further insight into BIA of critically ill patients and investigated the question of whether BIA is a useful tool to predict mortality of critically ill patients. For this purpose, we compared BIA data with the popular severity scoring systems SAPS III, SOFA, and APACHE II, which are commonly employed for this prediction (Bouch et al., 2008; Wong et al., 1991; Vincent et al., 1996).
3
II. MATERIALS AND METHODS
This was a prospective, open-label, observational study.
A. Subject Population
This study was conducted from January 12 to August 3, 2015, in the surgical intensive care unit (ICU) of Ajou University Hospital, Suwon, Korea. A total of 241 critically ill surgical patients (161 male and 80 female, mean age 62.9 ± 13.1 years) over 18 years old were enrolled. Pregnant or brain dead patients were excluded. BIA analysis was performed for all patients regardless of whether they were on diet or fasting, had limb edema, anasarca, sepsis, shock, or undergoing renal replacement therapy. This study was performed after obtaining the approval of the Institutional Review Board (IRB) of Ajou University Hospital (DEV-DE4-15-115). Before inclusion in this study, informed consent was obtained from patients or their next of kin.
B. Severity scoring systems
SAPS III, SOFA, and APACHE II scores were calculated based on test results or clinical features obtained within 24 hours after admission to the ICU.
C. BIA measurement
Body composition was measured using a portable BIA device for segmental BIA (InBody S10® , InBody Corp., Seoul, South Korea), using 50-kHz alternating current. The InBody S10 body composition analyzer is designed for patients over 3 years of age who are immobile or who are amputees, with touch-type electrodes or with adhesive-type electrodes and produces results within 2 minutes. With each InBody S10 test, a full-page results sheet is printed detailing the whole-body and segmental (right and left arms and legs and trunk) muscle,
4
fat, and water values such as total body water (TBW), ICW, ECW, ECW/TBW, lean body mass, FM, skeletal muscle mass, and whole-body and segmental PhA, impedance, and reactance at each segment and frequency.
After a patient’s admission to the ICU, the measurements were performed twice weekly (Monday and Thursday) in the afternoon between 2 and 4 pm because the researcher who measured BIA was available only at this time. BIA measurements were performed while patients were lying on the bed with their arms and legs spread out. Because it is usually difficult to apply touch-type electrodes to ICU patients due to intravascular lines and dressing covering these lines, we used adhesive-type electrodes. Eight adhesive electrodes were used: one on the most distal part of the third metacarpal bone of each hand, one on each wrist, one on the most distal part of the second metatarsal bone in each foot, and one on the central part of each ankle. In contrast with other BIA devices used for patients who are standing, the InBody S10 cannot measure height and body weight while the patient is lying down. Before pressing the measurement button, manual input of patient information such as age, height, and weight is needed. We used the actual body weight of each patient which was measured by scale in the ICU bed on their exam date. To prevent any errors caused by improper patient postures or inappropriate attachment of the electrodes, photographs were taken and reviewed by co-investigators.
D. Nutritional assessment
Nutritional assessment was performed for patients with a medium or high risk of malnutrition. Risk factors at the time of admission included 1) unexpected weight loss during the past month; 2) dysphagia; 3) starvation for more than 3 days; 4) anorexia for more than 2 weeks; 5) tube feeding; 6) human immunodeficiency virus infection, chronic kidney disease, liver cirrhosis, hepatic encephalopathy, congenital metabolic disease, sores, multiple trauma, burns on more than 10% of the body surface; g) old age; h) extremely low body mass index; and i) abnormal serum albumin level. Depending on the result of the nutritional assessment, patients were categorized as either well-nourished or malnourished.
5
The first BIA measurement values from patients admitted to the ICU were used for comparisons with severity scores. All continuous data are expressed as the arithmetic mean values ± standard deviation; other data are reported as number (percentage). The normality of each variable was tested using the Kolmogorov–Smirnov test. Student’s t-tests were used for comparisons between survivors and nonsurvivors. Univariate logistic regression analysis with a forward stepwise approach and multivariate logistic regression analysis were performed to investigate correlations of BIA data and severity scores with respect to their ability to predict mortality. Receiver operating characteristic (ROC) curves were generated and areas under the curves (AUCs) calculated.
ROC curves and AUCs were compared using the DeLong method [21]. P-values of <0.05 were considered statistically significant.
All of the statistical analysis was performed using R software version 3.2.0 (R Foundation for Statistical Computing, Vienna, Austria).
6
III. RESULTS
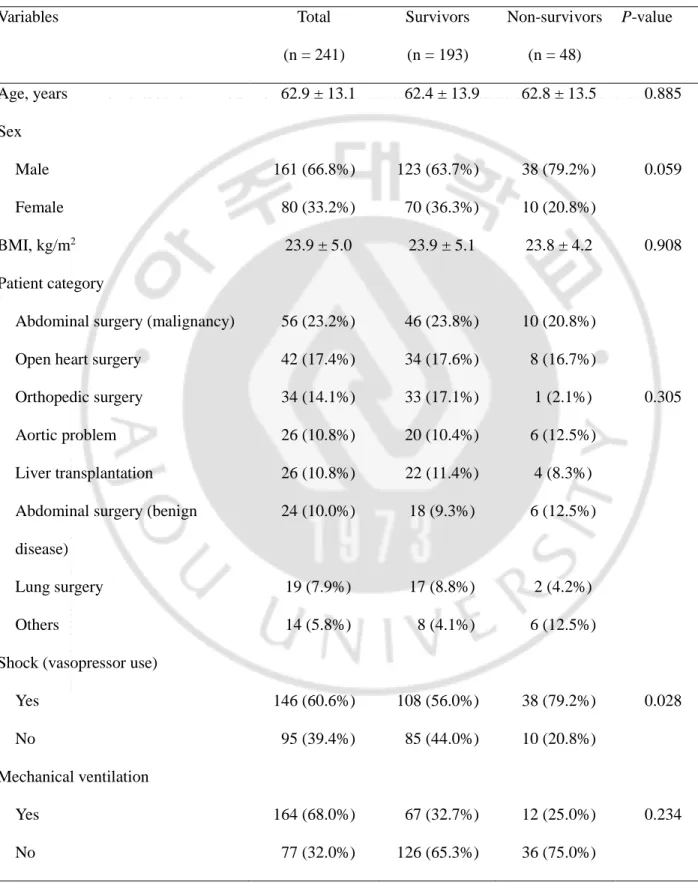
Patient characteristics are shown in Table 1. Height and weight were 164.4 ± 8.9 cm (range, 140–186 cm) and 64.7 ± 14.7 kg (range, 33–135 kg), respectively. The most common cause of admission was abdominal surgery due to malignant tumors (23.2%), followed by open-heart surgery (17.4%). Malnourished patients accounted for 17.0%, and patients with a shock status needing vasopressors accounted for 60.6%. In-hospital mortality was 19.9%.
The mean time interval from ICU admission to the BIA measurement used for this analysis was 2.3 ± 1.8 days (range, 0–5 days). A comparative analysis was performed between the severity scores and BIA values for survivors and non-survivors. The established scoring systems (SAPS III, SOFA, and APACHE II) showed a statistically significant correlation with the difference between survivors and non-survivors (Table 1). Among the BIA values, PhA (P < 0.001), impedance (P < 0.001), and reactance (P < 0.001) were statistically different between the two groups. Although ECW, TBW, ECW/TBW, and FM also showed weak statistical significance, all other BIA data were unrelated to patient mortality.
7
Table 1. Comparison of patient characteristics, BMI, severity scores, and BIA data between survivors and non-survivors. Variables Total (n = 241) Survivors (n = 193) Non-survivors (n = 48) P-value Age, years 62.9 ± 13.1 62.4 ± 13.9 62.8 ± 13.5 0.885 Sex Male 161 (66.8%) 123 (63.7%) 38 (79.2%) 0.059 Female 80 (33.2%) 70 (36.3%) 10 (20.8%) BMI, kg/m2 23.9 ± 5.0 23.9 ± 5.1 23.8 ± 4.2 0.908 Patient category
Abdominal surgery (malignancy) 56 (23.2%) 46 (23.8%) 10 (20.8%) Open heart surgery 42 (17.4%) 34 (17.6%) 8 (16.7%)
Orthopedic surgery 34 (14.1%) 33 (17.1%) 1 (2.1%) 0.305
Aortic problem 26 (10.8%) 20 (10.4%) 6 (12.5%)
Liver transplantation 26 (10.8%) 22 (11.4%) 4 (8.3%) Abdominal surgery (benign
disease)
24 (10.0%) 18 (9.3%) 6 (12.5%)
Lung surgery 19 (7.9%) 17 (8.8%) 2 (4.2%)
Others 14 (5.8%) 8 (4.1%) 6 (12.5%)
Shock (vasopressor use)
Yes 146 (60.6%) 108 (56.0%) 38 (79.2%) 0.028
No 95 (39.4%) 85 (44.0%) 10 (20.8%)
Mechanical ventilation
Yes 164 (68.0%) 67 (32.7%) 12 (25.0%) 0.234
8
Nutritional status
Well-nourished 200 (83.0%) 163 (84.5%) 37 (77.1%) 0.281
Malnourished 41 (17.0%) 30 (15.5%) 11 (22.9%)
Severity scores, points
SAPS III 44.2 ± 17.0 42.9 ± 17.1 49.3 ± 15.5 0.019
SOFA 6.8 ± 3.6 6.4 ± 3.5 8.1 ± 3.7 0.004
APACHE II 16.2 ± 7.2 15.7 ± 7.2 18.5 ± 7.0 0.016
Clinical outcome, days
Length of stay in ICU 19.6 ± 18.4 19.6 ± 18.4 19.6 ± 18.4 0.149 Length of stay in hospital 25.0 ± 31.7 20.0 ± 18.9 18.0 ± 16.3 0.142 Duration of MV (n = 164) 12.3 ± 22.8 12.2 ± 24.0 13.2 ± 17.0 0.521 BIA data PhA, ° 4.0 ± 1.4 4.1 ± 1.3 3.2 ± 1.5 <0.0001 Impedance, Ω 450.2 ± 135.8 472.1 ± 131.3 361.2 ± 117.3 <0.0001 Reactance, Ω 31.4 ± 14.7 34.2 ± 14.2 20.2 ± 11.3 <0.0001 ICW, L 22.7 ± 5.3 22.5 ± 5.2 23.7 ± 5.5 0.161 ECW, L 15.7 ± 3.9 15.3 ± 3.8 17.0 ± 4.1 0.006 TBW, L 38.4 ± 9.0 37.8 ± 8.8 40.7 ± 9.2 0.044 ECW/TBW 0.41 ± 0.02 0.41 ± 0.02 0.42 ± 0.03 0.001 FFM, kg 51.6 ± 11.9 51.0 ± 11.7 54.5 ± 12.2 0.065 FM, kg 13.0 ± 8.4 13.9 ± 8.2 9.3 ± 8.1 0.001 TBW/FFM, L/kg*100 74.2 ± 1.2 74.1 ± 0.9 74.7 ± 1.9 0.053 Protein, kg 9.8 ± 2.3 9.7 ± 2.2 10.2 ± 2.4 0.175 BCM, kg 32.5 ± 7.6 32.2 ± 7.5 33.9 ± 7.9 0.161 BMC, kg 2.8 ± 0.7 2.8 ± 0.6 2.9 ± 1.0 0.505
9
AMC, cm 26.1 ± 4.3 26.1 ± 4.4 26.2 ± 3.8 0.888
WHR 0.9 ± 0.1 0.9 ± 0.1 0.8 ± 0.2 0.090
Variables are expressed as mean ± standard deviation or number of patients (%).
BMI, body mass index; BIA, bioelectrical impedance analysis; SAPS III, Simplified Acute Physiology Score III; SOFA, Sequential Organ Failure Assessment; APACHE, Acute Physiology and Chronic Health Evaluation; ICU, intensive care unit; MV, mechanical ventilation; PhA, phase angle; ICW, intracellular water; ECW, extracellular water; TBW, total body water; FFM, fat-free mass; FM, fat mass; BCM, body cell mass; BMC, bone mineral content; AMC, arm muscle circumference; WHR waist to hip ratio.
10
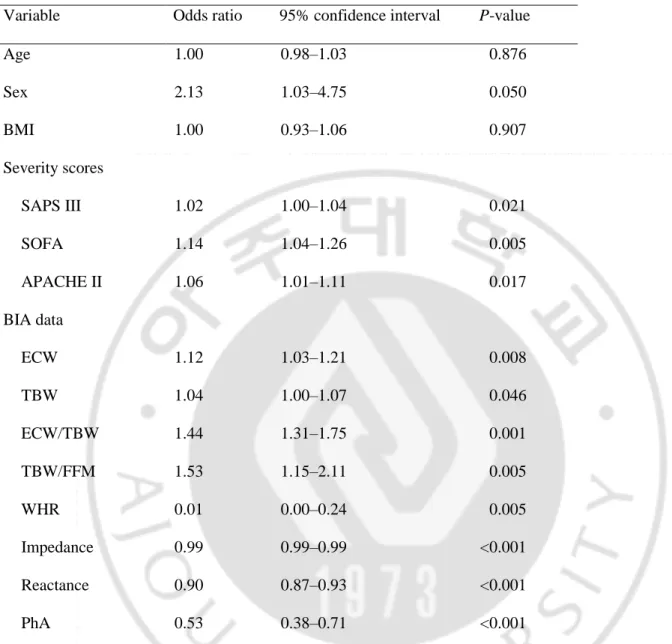
A univariate logistic regression analysis was performed to assess the predictive power of several characteristics (Table 2). All three severity scores exhibited significant predictive power for mortality. Among the BIA values, impedance (odds ratio [OR], 0.99; P < 0.001), reactance (OR 0.90; P < 0.001), and PhA (OR, 0.53; P < 0.001) were highly statistically significant for predicting mortality, whereas ECW, TBW, ECW/TBW, TBW/FFM, and waist to hip ratio displayed somewhat lower predictive power, similar to the severity scoring systems.
11
Table 2. Univariate logistic regression analysis of predictors of death during hospitalization.
Variable Odds ratio 95% confidence interval P-value
Age 1.00 0.98–1.03 0.876 Sex 2.13 1.03–4.75 0.050 BMI 1.00 0.93–1.06 0.907 Severity scores SAPS III 1.02 1.00–1.04 0.021 SOFA 1.14 1.04–1.26 0.005 APACHE II 1.06 1.01–1.11 0.017 BIA data ECW 1.12 1.03–1.21 0.008 TBW 1.04 1.00–1.07 0.046 ECW/TBW 1.44 1.31–1.75 0.001 TBW/FFM 1.53 1.15–2.11 0.005 WHR 0.01 0.00–0.24 0.005 Impedance 0.99 0.99–0.99 <0.001 Reactance 0.90 0.87–0.93 <0.001 PhA 0.53 0.38–0.71 <0.001
BMI, body mass index; SAPS III, Simplified Acute Physiology Score III; SOFA, Sequential Organ Failure Assessment; APACHE, Acute Physiology and Chronic Health Evaluation; BIA, bioelectrical impedance analysis; ECW, extracellular water; TBW, total body water; FFM, fat-free mass; WHR, waist to hip ratio; PhA, phase angle.
12
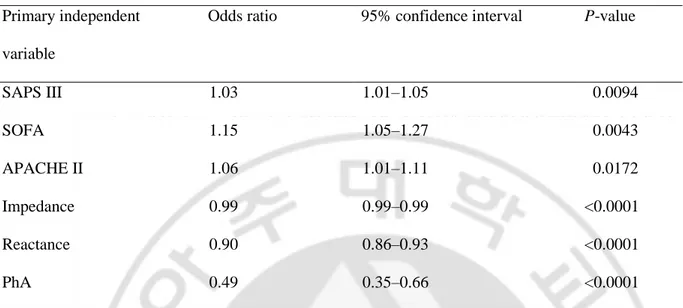
The three BIA indicators, PhA, impedance, and capacitive reactance, as well as the three severity scores exhibited a high correlation with mortality in multivariate logistic regression analysis (using age, sex, and body mass index as parameters; Table 3). Statistical significance was much more pronounced in the case of BIA (P < 0.001 for all three indicators). This higher correlation between BIA values (PhA, impedance, and capacitive reactance) and mortality is also reflected in the ROC curves (Fig. 1). The AUCs were higher for BIA values than for the severity scoring systems (Table 4).
13
Table 3. Adjusted odds ratios of mortalities by severity scores and BIA values in multivariate logistic regression analysis (adjusted for age, sex, and BMI).
Primary independent variable
Odds ratio 95% confidence interval P-value
SAPS III 1.03 1.01–1.05 0.0094 SOFA 1.15 1.05–1.27 0.0043 APACHE II 1.06 1.01–1.11 0.0172 Impedance 0.99 0.99–0.99 <0.0001 Reactance 0.90 0.86–0.93 <0.0001 PhA 0.49 0.35–0.66 <0.0001
BIA, bioelectrical impedance analysis; BMI, body mass index; SAPS III, Simplified Acute Physiology Score III; SOFA, Sequential Organ Failure Assessment; APACHE, Acute Physiology and Chronic Health Evaluation; PhA, phase angle.
14
Fig 1. Multivariate-adjusted ROC curves for BIA data (reactance, impedance, and PhA) and severity scores (APACHE II, SOFA, and SAPS III) adjusted for age, sex, and body mass index. A) ROC curve for impedance and severity scores. B) ROC curves for reactance and severity scores. C) ROC curves for PhA and severity scores.
ROC, receiver operating characteristic; BIA, bioelectrical impedance analysis; APACHE II, Acute Physiology and Chronic Health Evaluation II; SOFA, Sequential Organ Failure Assessment; SAPS III, Simplified Acute Physiology Score III; PhA, phase angle; AUC, area under the curve.
15
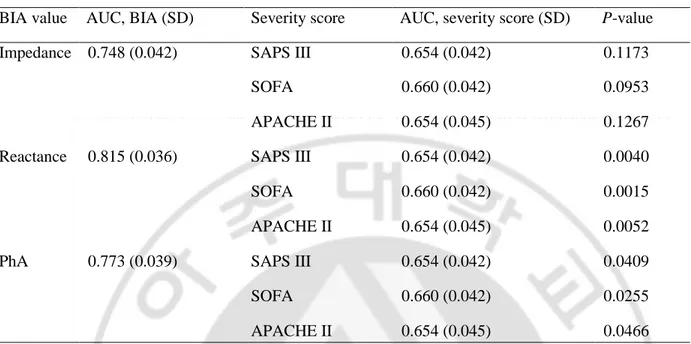
Table 4. Comparison between ROC curves for severity scores and BIA values (adjusted for age, sex, and BMI).
BIA value AUC, BIA (SD) Severity score AUC, severity score (SD) P-value
Impedance 0.748 (0.042) SAPS III 0.654 (0.042) 0.1173
SOFA 0.660 (0.042) 0.0953
APACHE II 0.654 (0.045) 0.1267
Reactance 0.815 (0.036) SAPS III 0.654 (0.042) 0.0040
SOFA 0.660 (0.042) 0.0015
APACHE II 0.654 (0.045) 0.0052
PhA 0.773 (0.039) SAPS III 0.654 (0.042) 0.0409
SOFA 0.660 (0.042) 0.0255
APACHE II 0.654 (0.045) 0.0466
ROC, receiver operating characteristic; BIA, bioelectrical impedance analysis; BMI, body mass index; AUC, areas under the curves; SD, standard deviation; PhA, phase angle; SAPS III, Simplified Acute Physiology Score III; SOFA, Sequential Organ Failure Assessment; APACHE, Acute Physiology and Chronic Health Evaluation.
16
IV. DISCUSSION
In this study, PhA, impedance, and reactance determined by BIA in critically ill patients were strongly associated with mortality outcomes. Indeed, BIA showed stronger mortality predictive power than the severity scoring systems commonly used in an ICU. The methodology of BIA has been used in the past as a tool to predict patient mortality (Gupta et al., 2004; Gupta et al., 2004; Hui et al., 2014; Lee et al., 2015; Vaara et al., 2012). One study, comprising 30 critically ill patients under continuous veno-venous hemodialysis, revealed that survivors showed significantly lower TBW, ICW, and ECW compared with non-survivors (Vaara et al., 2012). It was claimed that fluid overload was associated with an increased risk for 90-day mortality in critically ill patients with renal replacement therapy. Similarly, in 66 critically ill patients, Lee et al. (Lee et al., 2015) found statistically significant differences in ECW/TBW and TBW/FFM between survivors and non-survivors. In line with these results, BIA values determined in the present study (ECW, TBW, ECW/TBW, and FM) showed significant correlations with patient mortality, but ICW values were not related to outcomes. Even though we analyzed FFM and FM as comparative parameters between survivors and non-survivors, edema or hydration can alter these values; therefore, we cannot confirm whether FM could be a meaningful predictive marker for mortality.
Among all BIA-derived compositional data (body fat and water), ECW/TBW seems to be a reliable parameter with respect to predicting mortality (see Table 1). ECW/TBW represents fluid overload, with high values indicating poor health. The main reason for increased ECW ratios in critically ill patients is edema, which can be caused by acute heart or liver failure. A decrease in ICW (with a concomitant decrease in TBW) can occur in the case of severe malnutrition, old age, or cachexia. All these factors lead to high ECW/TBW values, thus explaining its close relationship with potential death.
The data directly accessible via BIA measurements (impedance, reactance, and PhA) have an even higher predictive power for patient mortality (see Table 1). As the study of da Silva et al. (da Silva et al., 2015), low
17
PhA values were closely related to mortality after performing BIA in 95 ICU patients, and Lee et al. (Lee et al., 2015) showed a remarkable difference in PhA between survivors (4.1 ± 1.2) and non-survivors (2.9 ± 0.8).
Many previous studies that performed BIA emphasized the importance of the PhA, but none investigated impedance or reactance. However, both quantities proved to be highly correlated with mortality in our investigation. Capacitive reactance was even more strongly correlated with mortality than PhA. This result is likely because the Inbody S10 BIA device used in the present study was designed to calculate the reactance value from measured impedance and PhA values, whereas in other studies, BIA devices are designed to calculate the PhA value from measured impedance and reactance values. This means, in Inbody S-10 device measurement, reactance reflects only the membrane integrity of cells, which can be a strong indicator of a cell’s condition, even though the PhA values could be affected by body water composition.
Even though we could obtain data using multiple frequencies (1, 5, 50, 250, and 500 kHz and 1 MHz) with Inbody S10 device, we used only the 50-kHz data for analysis, because until now, many studies (Gupta et al., 2004; Kyle et al., 2013; Hui et al., 2014; da Silva et al., 2015; Gunn et al., 2008) have reported their study data using the 50-kHz frequency. Furthermore, it was difficult for us to analyze the meaning of data obtained using various frequencies. Further study with multiple-frequency BIA is needed.
A major limitation of this study is that there are many factors that interfere with BIA measurements that are currently not well understood. Fluid status variations such as infusions with large amounts of fluids, peripheral edema, overhydration, which are frequently observed in critically ill patients, can affect the BIA parameters. Body weight measured in the ICU also may not be accurate because of the multiple devices, fluid lines, and drainage systems that may be attached to the patient. Furthermore, we do not know the effect of changes in factors such as ambient air and skin temperature or fever, sweating, nutrition and oral feeding, nutritional status, changes in Na and K content, body mass index, and specific conductance of hospital beds on the BIA measurements. However, we still attempted to find the validity of the BIA technique for critically ill patients.
18
We also did not perform subgroup analyses according to type of surgery, renal replacement therapy, shock status, or organ failure status. Patients with massive pleural effusion or ascites were also included, and we did not analyze the difference in these patients.
However, in this study, even though there are many unknown factors affecting BIA, very interestingly, BIA parameters such as impedance, reactance, and PhA showed a definite difference between survivors and non-survivors and a strong predictive power for mortality of critically ill patients.
19
V. CONCLUSION
In summary, we showed that impedance, reactance, and PhA determined by BIA in critically ill patients were associated with patient mortality. The raw data obtained (PhA, impedance, and reactance) revealed stronger mortality predictive power than the severity scoring systems commonly used in an ICU (APACHE II, SOFA and SAPS III).
20
REFERENCES
1. Bouch DC, Thompson JP. Severity scoring systems in the critically ill. Contin Educ Anaesth Crit Care Pain 2008;8:181–5.
2. Wong DT, Knaus WA. Predicting outcome in critical care: the current status of the APACHE prognostic scoring system. Can J Anaesth 1991;38:374–83.
3. Vincent JL1, Moreno R, Takala J, Willatts S, De Mendonça A, Bruining H, Reinhart CK, Suter PM, Thijs LG. The SOFA (Sepsis-related Organ Failure Assessment) score to describe organ dysfunction/failure. On behalf of the Working Group on Sepsis-Related Problems of the European Society of Intensive Care Medicine. Intensive Care Med 1996;22:707–10.
4. Kyle UG1, Bosaeus I, De Lorenzo AD, Deurenberg P, Elia M, Gómez JM, Heitmann BL, Kent-Smith L, Melchior JC, Pirlich M, Scharfetter H, Schols AM, Pichard C; Composition of the ESPEN Working Group. Bioelectrical impedance analysis–part I: review of principles and methods. Clin Nutr 2004;23:1226–43.
5. Kyle UG1, Bosaeus I, De Lorenzo AD, Deurenberg P, Elia M, Manuel Gómez J, Lilienthal Heitmann B, Kent-Smith L, Melchior JC, Pirlich M, Scharfetter H, M W J Schols A, Pichard C; ESPEN. Bioelectrical impedance analysis–part II: utilization in clinical practice. Clin Nutr 2004;23:1430–53.
6. Lukaski HC, Bolonchuk WW, Hall CB, Siders WA. Validation of tetrapolar bioelectrical impedance method to assess human body composition. J Appl Physiol 1986;60:1327–32.
7. Reis de Lima e Silva R, Porto Sabino Pinho C, Galvao Rodrigues I, Gildo de Moura Monteiro Junior J. Phase angle as an indicator of nutritional status and prognosis in critically ill patients. Nutr Hosp 2015;31:1278–85.
8. Gupta D1, Lammersfeld CA, Burrows JL, Dahlk SL, Vashi PG, Grutsch JF, Hoffman S, Lis CG. Bioelectrical impedance phase angle in clinical practice: implications for prognosis in advanced colorectal cancer. Am J Clin Nutr 2004;80:1634–8.
21
9. Gupta D, Lis CG, Dahlk SL, Vashi PG, Grutsch JF, Lammersfeld CA. Bioelectrical impedance phase angle as a prognostic indicator in advanced pancreatic cancer. Br J Nutr 2004;92:957–62.
10. Schwenk A, Beisenherz A, Romer K, Kremer G, Salzberger B, Elia M. Phase angle from bioelectrical impedance analysis remains an independent predictive marker in HIV-infected patients in the era of highly active antiretroviral treatment. Am J Clin Nutr 2000;72:496–501.
11. Kyle UG, Genton L, Pichard C. Low phase angle determined by bioelectrical impedance analysis is associated with malnutrition and nutritional risk at hospital admission. Clin Nutr 2013;32:294–9. 12. Hui D, Bansal S, Morgado M, Dev R, Chisholm G, Bruera E. Phase angle for prognostication of survival
in patients with advanced cancer: preliminary findings. Cancer 2014;120:2207–14.
13. Kaido T, Mori A, Ogura Y, Ogawa K, Hata K, Yoshizawa A, Yagi S, Uemoto S. . Pre- and perioperative factors affecting infection after living donor liver transplantation. Nutrition 2012;28:1104–8.
14. Barak N, Wall-Alonso E, Cheng A, Sitrin MD. Use of bioelectrical impedance analysis to predict energy expenditure of hospitalized patients receiving nutrition support. JPEN J Parenter Enteral Nutr 2003;27:43–6.
15. Berneis K, Keller U. Bioelectrical impedance analysis during acute changes of extracellular osmolality in man. Clin Nutr 2000;19:361–6.
16. Basso F1, Berdin G, Virzì GM, Mason G, Piccinni P, Day S, Cruz DN, Wjewodzka M, Giuliani A, Brendolan A, Ronco C. Fluid management in the intensive care unit: bioelectrical impedance vector analysis as a tool to assess hydration status and optimal fluid balance in critically ill patients. Blood Purif 2013;36:192–9.
17. Malbrain ML, Huygh J, Dabrowski W, De Waele JJ, Staelens A, Wauters J. The use of bio-electrical impedance analysis (BIA) to guide fluid management, resuscitation and deresuscitation in critically ill patients: a bench-to-bedside review. Anaesthesiol Intensive Ther 2014;46:381–91.
18. Lee Y, Kwon O, Shin CS, Lee SM. Use of bioelectrical impedance analysis for the assessment of nutritional status in critically ill patients. Clin Nutr Res 2015;4:32–40.
22
19. Jones SL, Tanaka A, Eastwood GM, Young H, Peck L, Bellomo R, Mårtensson J. Bioelectrical impedance vector analysis in critically ill patients: a prospective, clinician-blinded investigation. Crit Care 2015;19:290.
20. da Silva TK, Berbigier MC, Rubin Bde A, Moraes RB, Correa Souza G, Schweigert Perry ID. Phase angle as a prognostic marker in patients with critical illness. Nutr Clin Pract 2015;30:261–5.
21. DeLong ER, DeLong DM, Clarke-Pearson DL. Comparing the areas under two or more correlated receiver operating characteristic curves: a nonparametric approach. Biometrics 1988;44:837–45.
22. Vaara ST, Korhonen AM, Kaukonen KM, Nisula S, Inkinen O, Hoppu S, et al. Fluid overload is associated with an increased risk for 90-day mortality in critically ill patients with renal replacement therapy: data from the prospective FINNAKI study. Crit Care 2012;16:R197.
23. Gunn SM, Halbert JA, Giles LC, Stepien JM, Miller MD, Crotty M. Bioelectrical phase angle values in a clinical sample of ambulatory rehabilitation patients. Dyn Med 2008;7:14.
23
- 국문요약 -중환자에서 생체전기임피던스분석법의
강한 생존사망 예측능력
아주대학교 대학원의학과 이 재 명 (지도교수: 왕 희 정) 목적: 중환자에게 생체전기임피던스분석법을 적용하여 얻어진 결과값들이 사망예측력을 갖는지 알아보고자 하였다. 방법: 아주대병원 외과계 중환자실에 입실한 2 4 1 명의 환자( 남 1 6 1 명, 여 8 0 명, 평균연령 6 2 . 9 세) 를 대상으로 이동식 생체전기임피던스기계를 이용하여 검사를 진행하였다. 사망군과 생존군 간에 3 개의 중증도 지표(Acute Physiology and Chronic Health Evaluation II, Sequential Organ Failure Assessment, and Simplified Acute Physiology Score III )와 생체전기임피던스분석으로 얻어진 결과값들을 비교 분석하였다.결과: 생체전기임피던스분석법 결과값 중, impedance (odds ratio [OR], 0.99; P<0.001), reactance (OR 0.90; P<0.001)와 phase angle (PhA) (OR, 0.53; P<0.001) 모두 단변량 및 다변량 분석상에서 유의한 사망예측률을 보였다. 다중요인보정 receiver operating characteristic curve 분석에서도 생체전기분석법에서 얻어진 impedance, reactance, phase angle 값 모두 세 중증도 지표값보다 통계적으로 높은 area under the curve 값들을 보였다.
결론: 생체전기임피던스분석법에서 얻어진 impedance, reactance, phase angle 값들은 환자의 사망률과 강한 연관성이 있었으며, 기존에 중환자실에서 사용하고 있는 중증도 지표들보다 더 강한 사망예측력을 갖고 있었다.
_________________________________________________________________________________________ 핵심어: 생체전기임피던스분석법, 중환자, 중증도, 생체표지자