45
Heart rate variability predicts the extent of corrected QT
interval prolongation after tracheal intubation
*Department of Anesthesiology and Pain Medicine & †Anesthesia and Pain Research Institute, Yonsei University College of Medicine, Seoul, Korea
Ji Young Kim*
,†, Yon Hee Shim*
,†, Seung Ho Choi*
,†, Sung Yeon Ham*, and Dong Woo Han*
,†Received: June 27, 2011. Revised: July 11, 2011. Accepted: August 18, 2011.
Corresponding author: Dong Woo Han, M.D., Department of Anesthesiology and Pain Medicine and Anesthesia and Pain Research Institute, Yonsei University College of Medicine, Gangnam Severance Hospital, Unjuro 612, Dogok-dong, Gangnam-gu, Seoul 135-720, Korea. Tel: 82-2-2019-3520, Fax: 82-2-3463-0940, E-mail: [email protected]
Background: Corrected QT (QTc) interval can be modulated by
sympathetic and parasympathetic balance. Tracheal intubation causes significant prolongation of the QTc interval due to sym-pathetic stimulation. This study was designed to elucidate the re-lationship between baseline autonomic nervous system activity and QTc prolongation after endotracheal intubation using heart rate variability (HRV).
Methods: Sixty-six healthy patients were included and the baseline
HRV data were recorded for 5 min before anesthesia. Power spec-trum densities were calculated for low frequencies (LF, 0.04−0.15 Hz) and high frequencies (HF, 0.15−0.4 Hz), defined as either LF’s or HF’s relative part of the total power. Anesthesia was induced with sevoflurane and vecuronium was given. The QTc interval, heart rate (HR) and mean arterial pressure (MAP) were measured before induction (baseline), before laryngoscopy (pre-intubation) and immediately after the intubation (post-intubation).
Results: The QTc interval change at post-intubation from baseline
(ΔQTc) showed a significant negative correlation with the HF (r = 0.34, P = 0.006) and positive correlation with LF/HF ratio (r = 0.37, P = 0.005). Patients were retrospectively divided into low-HF/ LF (<2.5, n = 44) and high-HF/LF group (>2.5, n = 22). The ΔQTc was statistically higher in the high-LF/HF group compared to that in the low-LF/HF group (P = 0.048). The HR and MAP at baseline, pre-intubation and post-intubation were not different between two groups.
Conclusions: The QTc interval prolongation after endotracheal
intubation is influenced by baseline autonomic conditions and can be exaggerated in patients with activated sympathetic activity or depressed parasympathetic activity. (Anesth Pain Med 2012; 7: 45 ∼50)
Key Words: Autonomic nervous system, Corrected QT interval, Heart rate variability, Intubation.
INTRODUCTION
The prolongation of corrected QT (QTc) interval has been actively studied in anesthesiology field over the past few years because it may cause potentially life-threatening ventricular arrhythmia [1]. Long QT syndrome can be inherited or ac-quired following various drugs administration or electrolyte disturbances such as hypokalemia and hypomagnesaemia [2]. The QTc interval can also be prolonged during rapid injection of catecholamine, brief stimulation of the sympathetic nervous system and an imbalance of the cardiac sympathetic tone [2-5]. It has been reported that tracheal intubation causes significant prolongation of the QTc interval mainly due to sympathetic stimulation [6,7]. The beta-adrenergic blockers and opioids were used to prevent the QTc prolongation during intubation but its beneficial effects on QTc are somewhat controversial [8-10].
Heart rate variability (HRV) analysis is a noninvasive method of measuring the autonomic nervous system (ANS) activity [11]. Since the QTc interval can be modulated by the ANS during endotracheal intubation under laryngoscopy, authors hypo-thesised that any differences in ANS regulation among patients would affect the extent of the QTc prolongation after endo-tracheal intubation. Therefore, this study was designed to eluci-date the effect of baseline ANS on QTc interval change after endotracheal intubation using HRV analysis as a surrogate for the ANS activity.
MATERIALS AND METHODS
This study was approved by the institutional review board and informed consent was obtained from all patients. Sixty- eight patients classified as ASA physical status I were enrolled
in this study. Patient exclusion criteria were arrhythmias, electrolyte imbalance, a baseline QTc interval greater than 440 ms and patients taking medication affecting the QTc interval. If tracheal intubation was not completed within 20 sec, the patients were excluded from the analysis [12].
HRV measurements
Study data were collected in the morning between 8 am to 11 am to prevent the effect of diurnal variation in the QTc interval. Patients received no premedication. On arrival in the pre-operative preparation room, ECG, pulse oximetry, non- invasive blood pressure monitors were attached and patients were asked to rest for 10 min. After 10 min of stabilization, baseline mean arterial pressure (MAP), heart rate (HR) and QTc interval were recorded. The baseline HRV data were recorded for 5 min and averaged using a standard real time automated 3-lead ECG, which was continuously obtained using a data acquisition system (PowerLab; AD Instruments, Colorado Springs, CO, USA). The data of HRV and QTc interval were transferred to an on-line computer loaded with software (CHART 5 PRO; AD Instruments, Colorado Springs, CO, USA). The fast peaks of R waves on the ECG were detected with a sample rate of 1,024 Hz. Spectral analysis was performed by fast Fourier transformation. Power spectrum densities were calculated for low frequencies (LF, 0.04−0.15 Hz) and high frequencies (HF, 0.15−0.4 Hz) in normalized units, defined as either LF’s or HF’s relative part of the total power. Breathing was controlled at a rate of 14−16 breaths/min. The QT interval was measured in lead II form the onset of the QRS complex to the end of the T wave, defined as a return to the T-P baseline. In each case, the values of the QT interval over four successive beats were averaged. Heart rate correction was made according to the Fridericia formula: QTc = QT3√(R-R interval).
Anaesthetic technique
Anesthesia for all patients was performed by one ex-perienced faculty member. Patients underwent slow inhalation induction of anesthesia with a facemask using sevoflurane in 100% oxygen to avoid the confounding effects of other anaesthetic agents. Anesthesia was induced via a facemask by initially administering 1.0% sevoflurane, and increasing the inspiratory concentration after every fifth breathe by 0.5% until a maximum of 6% sevoflurane was reached. After induction of anesthesia, anesthesia was maintained with sevoflurane and ventilation was assisted by facemask at an end-tidal
concentra-tion of 3% sevoflurane to provide an adequate depth of anes-thesia. Ten min after the start of anesthesia induction, vecuro-nium 0.15 mg/kg was given to facilitate endotracheal tion. The same anaesthesiologist performed endotracheal intuba-tion when peripheral neuromuscular stimulator confirmed ade-quate muscle relaxation. The QTc interval, HR and MAP were measured before induction (baseline), before laryngoscopy (pre-intubation) and immediately after the intubation (post-intu-bation) by an independent researcher blinded to the group assignment. The QTc interval change at post-intubation from baseline (ΔQTc) was calculated.
Statistics
Statistical analyses were performed using the statistical package (SPSS 17.0 for windows, SPSS Inc., Chicago, IL). Values were expressed as mean ± SD or number of patients. Pearson correlation was used to demonstrate correlation between ΔQTc and HRV parameters such as LF, HF and LF/HF. Based on preoperative LF/HF, patients were retro-spectively divided into the low-HF/LF (HF/LF ratio < 2.5, n = 44) and the high-HF/LF group (LF/HF ratio > 2.5, n = 22). Sample size was calculated based on a pilot study. In each group, 22 patients were required to detect a mean ± SD difference of 20 ± 23 ms with 80% power (α= 0.05 and β = 0.20). Comparisons between two groups were analysed using Fisher’s exact test, Student’s t-test or Mann-Whitney U-test where applicable. Comparisons within the group were analysed using repeated measures of ANOVA with Bonferroni correc-tion. A P value < 0.05 was considered significant.
RESULTS
Sixty-six among 68 patients completed this study and the two patients were excluded from the analysis due to failed intubation on the first attempt. Patient characteristics and HRV data are listed in Table 1. Correlations between ΔQTc and HRV parameters such as LF, HF and LF/HF are shown in Fig. 1. The ΔQTc demonstrated a significant negative tion with the HF (r = 0.34, P = 0.006) and positive correla-tion with LF/HF ratio (r = 0.37, P = 0.005), but there was no significant correlation with LF (r = 0.15, P = 0.219).
According to the baseline LF/HF, 22 patients were placed in the high-LF/HF group while 44 patients were placed in the low-LF/HF group. Patient characteristics and HRV data of two groups are listed in Table 2. There was no difference in patient characteristics between the two groups. The changes of
Fig. 1. Correlation between QTc change in post-intubation from baseline
(ΔQTc interval) and HRV variables such as (A) LF, (B) HF and (C) LF/HF. LF: low frequency, HF: high frequency.
Table 1. Patient Characteristics and Heart Rate Variability Data
Characteristic Mean ± SD Age (yr) 35.7 ± 8.9 Gender (M/F) 35/29 Height (cm) 167.3 ± 9.0 Weight (kg) 64.5 ± 11.1 LF (%) 36.9 ± 15.9 HF (%) 27.0 ± 16.0 LF/HF 2.4 ± 2.5
Data are expressed as mean ± SD or number of patients. LF: low frequency. HF: high frequency.
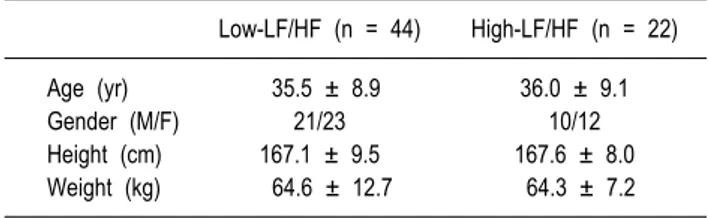
Table 2. Patient Characteristics and Heart Rate Variability Data
Low-LF/HF (n = 44) High-LF/HF (n = 22)
Age (yr) 35.5 ± 8.9 36.0 ± 9.1
Gender (M/F) 21/23 10/12
Height (cm) 167.1 ± 9.5 167.6 ± 8.0
Weight (kg) 64.6 ± 12.7 64.3 ± 7.2 Data are expressed as mean ± SD or number of patients. LF: low frequency. HF: high frequency. Low-HF/LF = HF/LF ratio < 2.5 High-HF/LF = LF/HF ratio > 2.5. There was no statistical difference between two groups.
QTc interval in consecutive periods are shown in Fig. 2A. The baseline QTc interval was not different between two groups. In both groups, QTc interval progressively increased after the anesthesia (pre-intubation) and after endotracheal intubation (post-intubation) from the baseline, which were statistically sig-nificant. The increase in QTc interval at post-intubation from pre-intubation was also statistically significant. The ΔQTc was
statistically higher in the high-LF/HF group compared to that in the low-LF/HF group (P = 0.048). The extent in QTc inter-val prolongation from pre-intubation to post-intubation was significantly higher in patients with high LF/HF (12.1 ± 6.3%) compared to that in patients with low LF/HF (6.9 ± 5.1%) (P < 0.001). Although statistically not significant, the proportion of patients with the QTc interval >440 ms were higher in the high-LF/HF group (5/22) compared to that in the low-LF/HF
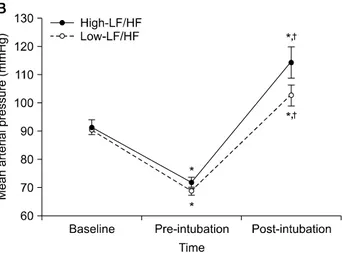
Fig. 2. The changes of (A) QTc interval, (B) mean arterial pressure and
(C) heart rate in consecutive periods. Baseline: before anaesthesia induction, Pre-intubation: 15 min after anaesthesia induction before the intubation, Post-intubation: immediately after the intubation. LF: low frequency, HF: high frequency. *P < 0.05 compared with baseline. †P
< 0.05 compared with pre-intubation. §P < 0.05 compared with low-LF/HF
group.
group (5/44) at post-intubation.
The changes in hemodynamic variables are shown in Fig. 2B and Fig. 2C. The baseline MAP and HR were not dif-ferent between two groups. In both groups, the MAP signifi-cantly decreased at pre-intubation but increased after the intubation compared to that of the baseline but there was no between group difference. The HR in both groups also de-creased at pre-intubation but inde-creased after the intubation compared to that of the baseline except at pre-intubation in the high-LF/HF group, which did not reach statistical significance. There was no between group difference in HR in both groups.
DISCUSSION
In this study, the QTc interval change after endotracheal intubation demonstrated negative linear relationship with the baseline HF value and positive linear relationship with the baseline LF/HF value in HRV parameters. In addition, the increase in QTc interval after the intubation was higher in the high-LF/HF group compared to that in the low-LF/HF group.
These results suggest that the QTc interval prolongation after endotracheal intubation can be exaggerated in patients with depressed parasympathetic activity.
The ANS influences the QTc interval and endotracheal intu-bation frequently results in severe prolongation of QTc interval through sympathetic stimulation [6,7,9,13]. The ANS can be assessed by spectral analysis of HRV and pre-operative HRV analysis has been studied to detect patients at risk of develop-ing intraoperative haemodynamic instability [14-18]. Among HRV variables, the LF represents vasomotor activity, which is an indirect index of sympathetic nerve activity, and the HF represents vagal nerve activity. Although the LF is also partially affected by parasympathetic activity, the LF/HF ratio represents the balance of sympathetic and parasympathetic acti-vities of the ANS [11,19-21]. A previous study on the autono-mic effects on QTc prolongation after exercise reported that the parasympathetic effect in the post-exercise recovery period counteracts the sympathetically mediated QTc prolongation [13]. Although the physiology of QTc prolongation induced after endotracheal intubation is somewhat different from that
after exercise, patients with low baseline parasympathetic activity in this study showed greater increase in QTc interval. When patients were retrospectively divided into two groups according to their baseline LF/HF, the increase in QTc interval after the intubation was higher in the high LF/HF group even though there was no statistical difference in haemodynamic variables between the two groups. The high LF/HF was defined to be >2.5 in this study mainly because the mean LF/HF of 68 patients in this study was 2.4. This was sup-ported by a study with 637 healthy Koreans, which resup-ported the mean LF/HF as 2.2 [22]. In addition, Hanss et al.[15] reported that LF/HF value higher than 2.5 can identify patients with risk of severe hypotension during spinal anesthesia and therefore it may be a tool to guide prophylactic therapy of patients at high risk for hypotension after spinal anesthesia [14-16].
Previous studies on HRV during general or regional anes-thesia have focused on the relationship between HRV parameters and hypotension, which was caused by the sympa-tholysis [14-16,18]. To date, no study was reported on direct relationship between preoperative HRV parameters and sympa-thetic stimulation after endotracheal intubation. In this study, although there were no statistic differences between two groups, both MAP and HR at post-intubation were higher in patients with high LF/HF compared to that in patients with low LF/HF, which may be related to the decreased parasym-pathetic activity in high LF/HF group. The lack of intergroup difference in MAP and HR in this study may have resulted from an appropriate depth of anesthesia before laryngoscopy and the fact that patients were healthy patients without co-mor-bidities such as hypertension. Further study is needed to eluci-date the influence of preoperative sympathetic and parasympa-thetic activities on hemodynamic variables at post-intubation period.
There are several limitations in this study. First is the lack of randomisation. This study could not be randomised since the assignment to the group depended on the result of the HRV analysis. Second, the tracheal intubation was not the only factor that influences the QTc interval. Most anaesthetic agents including sevoflurane prolong the QTc interval [23,24], which was consistent with the result of this study. In this study, inhalation induction with sevoflurane was performed without premedication or intravenous induction agents to avoid the complex effect of other anaesthetic drugs on the QTc interval because the effect of some anaesthetics on QTc interval still remains controversial. To facilitate endotracheal intubation,
vecuronium was administered since it causes no significant change in the QTc interval due to its lack of autonomic effect [25]. Third, this study included only healthy young adults with normal baseline QTc interval. HRV can be influenced by many factors including age, gender, posture, smoking, sleep, stress and anxiety [26,27]. The depth of inhalation anesthesia and respiration can also change the heart rate variability [28]. Since patients in this study were likely to have an intact autonomic nervous system, further study is needed to deter-mine the relationship between HRV and QTc interval in patients with high risk of QTc prolongation such as hyperten-sion and subarachnoid hemorrhage because they are likely to demonstrate a higher level of baseline sympathetic activity [29,30].
In conclusion, there was a negative correlation between pre-operative parasympathetic activity and QTc prolongation after endotracheal intubation under sevoflurane anesthesia. Since patients with LF/HF higher than 2.5 resulted in severe prolon-gation of QTc interval at post-intubation period, patients with high LF/HF should be closely monitored during intubation.
REFERENCES
1. Galloway PA, Glass PS. Anesthetic implications of prolonged QT interval syndrome. Anesth Analg 1985; 64: 612-20.
2. Wisely NA, Shipton EA. Long QT syndrome and anaesthesia. Eur J Anaesthesiol 2002; 19: 853-9.
3. Abildskov JA. Adrenergic effects of the QT interval of the electrocardiogram. Am Heart J 1976; 92: 210-6.
4. Moss AJ, McDonald J. Unilateral cervicothoracic sympathetic ganglionectomy for the treatment of long QT interval syndrome. N Engl J Med 1971; 285: 903-4.
5. Magnano AR, Talathoti N, Hallur R, Bloomfield DM, Garan H. Sympathomimetic infusion and cardiac repolarization: the norma-tive effects of epinephrine and isoproterenol in healthy subjects. J Cardiovasc Electrophysiol 2006; 17: 983-9.
6. Korpinen R, saarnivaara L, Siren K. QT interval of the ECG, heart rate and arterial pressure during anaesthetic induction. Acta Anaesthesiol Scand 1995; 39: 809-13.
7. Booker PD, Whyte SD, Ladusans EJ. Long QT syndrome and anaesthesia. Br J Anaesth 2003; 90: 349-66.
8. Saarnivaara L, Lindgren L. Hynynen M. Effects of practolol and metoprolol on QT interval, heart rate and radial pressure during induction of anaesthesia. Acta Anaesthesiol Scand 1984; 28: 644-8. 9. Lindgren L, Rautiainen P, Klemola UM, Saarnivaara L. Haemo-dynamic responses and prolongation of QT interval of ECG after suxamethonium-facilitated intubation during anaesthetic induction in children: a dosage-related attenuation by alfentanil. Acta Anaesthesiol Scand 1991; 35: 355-8.
al. Effects of fentanyl pretreatment on the QTc interval during propofol induction. Anaesthesia 2008; 63: 1056-60.
11. Pomeranz B, Macaulay RJ, Caudill MA, Kutz I, Adam D, Gordon D, et al. Assessment of autonomic function in humans by heart rate spectral analysis. Am J Physiol 1985; 248: H151-3. 12. Kim NS, Lee IO, Lee MK, Lim SH, Choi YS, Kong MH. The
effects of beta2 adrenoceptor gene polymorphisms on pressor response during laryngoscopy and tracheal intubation. Anaesthesia 2002; 57: 227-32.
13. Sundaram S, Carnethon M, Polito K, Kadish AH, Goldberger JJ. Autonomic effects on QT-RR interval dynamics after exercise. Am J Physiol Heart Circ Physiol 2008; 294: H490-7.
14. Hanss R, Bein B, Ledowski T, Lehmkuhl M, Ohnesorge H, Scherkl W, et al. Heart rate variability predicts severe hypotension after spinal anesthesia for elective cesarean delivery. Anesthesiol-ogy 2005; 102: 1086-93.
15. Hanss R, Bein B, Weseloh H, Bauer M, Cavus E, Steinfath M, et al. Heart rate variability predicts severe hypotension after spinal anesthesia. Anesthesiology 2006; 104: 537-45.
16. Hanss R, Bein B, Francksen H, Scherkl W, Bauer M, Doerges V, et al. Heart rate variability-guided prophylactic treatment of severe hypotension after subarachnoid block for elective cesarean delivery. Anesthesiology 2006; 104: 635-43.
17. Burgos LG, Ebert TJ, Asiddao C, Turner LA, Pattison CZ, Wang-Cheng R, et al. Increased intraoperative cardiovascular morbidity in diabetics with autonomic neuropathy. Anesthesiology 1989; 70: 591-7.
18. Latson T, Ashmore T, Reinhart D, Klein K, Giesecke A. Autonomic reflex dysfunction in patients presenting for elective surgery is associated with hypotension after anesthesia induction. Anesthesiology 1994; 80: 326-37.
19. Task Force of the European Society of Cardiology and the North American Society of Pacing and Electrophysiology. Heart rate variability: standards of measurement, physiological interpretation and clinical use. Circulation 1996; 93: 1043-65.
20. Pagani M, Lombardi F, Guzzetti S, Rimoldi O, Furlan R, Pizzinelli P, et al. Power spectral analysis of heart rate and arterial pressure
variabilities as a marker of sympatho-vagal interaction in man and conscious dog. Circ Res 1986; 59: 178-93.
21. Uusitalo AL, Tahvanainen KU, Uusitalo AJ, Rusko HK. Non-invasive evaluation of sympathovagal balance in athletes by time and frequency domain analyses of heart rate and blood pressure variability. Clin Physiol 1996; 16: 575-88.
22. Park SB, Lee BC, Jeong KS. Standardized tests of heart rate variability for autonomic function tests in healthy Koreans. Int J Neurosci 2007; 117: 1707-17.
23. Schmeling WT, Warltier DC, McDonald DJ, Madsen KE, Atlee JL, Kampine JP. Prolongation of the QT interval by enflurane, isoflurane, and halothane in humans. Anesth Analg 1991; 72: 137-44.
24. Kuenszberg E, Loeckinger A, Kleinsasser A, Lindner KH, Puehringer F, Hoermann C. Sevoflurane progressively prolongs the QT interval in unpremedicated female adults. Eur J Anaesthesiol 2000; 17: 662-4.
25. Booker PD, Whyte SD, Ladusans EJ. Long QT syndrome and anaesthesia. Br J Anaesth 2003; 90: 349-66.
26. Parati G, Di Rienzo M. Determinants of heart rate and heart rate variability. J Hypertens 2003; 21: 477-80.
27. Dishman RK, Nakamura Y, Garcia ME, Thompson RW, Dunn AL, Blair SN. Heart rate variability, trait anxiety, and perceived stress among physically fit men and women. Int J Psychophysiol 2000; 37: 121-33.
28. Nakatsuka I, Ochiai R, Takeda J. Changes in heart rate variability in sevoflurane and nitrous oxide anesthesia: effects of respiration and depth of anesthesia. J Clin Anesth 2002; 14: 196-200. 29. Silver HM, Tahvanainen KU, Kuusela TA, Eckberg DL.
Comparison of vagal baroreflex function in nonpregnant women and in women with normal pregnancy, preeclampsia, or gestational hypertension. Am J Obstet Gynecol 2001; 184: 1189-95. 30. Cruickshank JM, Neil-Dwyer G, Stott AW. Possible role of
catecholamines, corticosteroids, and potassium in production of electrocardiographic abnormalities associated with subarachnoid haemorrhage. Br Heart J 1974; 36: 697-706.