Noise-suppressed mutually injected Fabry-Perot
laser diodes for 10-Gb/s broadcast signal
transmission in WDM passive optical networks
Sang-Hwa Yoo, Joon-Young Kim, Byung-Il Seo, and Chang-Hee Lee*
Department of Electrical Engineering, Korea Advanced Institute of Science and Technology, 373-1, Guseong-dong, Yuseong-gu, Daejeon, 305-701, South Korea
Abstract: We propose and demonstrate 10-Gb/s broadcast signal
transmission in a wavelength-division-multiplexing passive optical network (WDM-PON) by employing a modular-type mutually injected Fabry-Perot laser diodes (MI F-P LDs) as a cost-effective multi-wavelength light source (MWS). We introduce a simple interferometric noise suppression technique with proper electrical filtering to improve transmission performance. The noise suppression doubles the number of supported subscribers with a single MI F-P LDs.
©2013 Optical Society of America
OCIS codes: (060.4510) Optical communications; (060.4250) Networks.
References and links
1. C.-H. Lee, W. V. Sorin, and B. Y. Kim, “Fiber to the home using a PON infrastructure,” J. Lightwave Technol.
24(12), 4568–4583 (2006).
2. P. P. Iannone, K. C. Reichmann, and N. J. Frigo, “High-speed point-to-point and multiple broadcast services delivered over a WDM passive optical network,” IEEE Photon. Technol. Lett. 10(9), 1328–1330 (1998). 3. P. P. Iannone, K. C. Reichmann, J. Pastor, C. G. Brinton, C.-H. Lee, H.-Y. Rhy, and Y.-L. Lam, “Experimental
demonstration of a cost-effective broadcast overlay for a commercial WDM-PON,” in Proceedings of the
National Fiber Optic Engineers Conference (Los Angeles, CA, 2011), Paper NTuB3.
4. H.-K. Lee, S.-R. Mun, S.-H. Yoo, and C.-H. Lee, “Broadcast signal transmission for WDM-PON with ASE injection seeding to a reflective modulator,” in Proceedings of the 16th Opto-Electronics and Communications
Conference (Kaohsiung, Taiwan, 2011), pp. 830–831.
5. X. Xue, X. Zheng, H. Zhang, and B. Zhou, “Noise suppression for fiber radio transmission on spectrum-sliced WDM-PONs employing interferometric structures,” in Proceedings of the Optical Fiber Communication
Conference (Los Angeles, CA, 2011), Paper OWK6.
6. J.-H. Moon, K.-M. Choi, and C.-H. Lee, “Overlay of broadcasting signal in a WDM-PON,” in Proceedings of
the Optical Fiber Communication Conference (Anaheim, CA, 2006), Paper OThK8.
7. S.-H. Yoo, H.-K. Lee, D.-S. Lim, J.-H. Jin, L. Byun, and C.-H. Lee, “2.5-Gb/s broadcast signal transmission in a WDM-PON by using a mutually injected Fabry-Pérot laser diodes,” in Proceedings of the Conference on Lasers
and Electro Optics (Baltimore, MD, 2011), Paper CFH7.
8. H.-C. Ji, I. Yamashita, and K.-I. Kitayama, “Cost-effective colorless WDM-PON delivering up/down-stream data and broadcast services on a single wavelength using mutually injected Fabry-Perot laser diodes,” Opt. Express 16(7), 4520–4528 (2008).
9. T.-Y. Kim and S.-K. Han, “Reflective SOA-based bidirectional WDM-PON sharing optical source for up/downlink data and broadcasting transmission,” IEEE Photon. Technol. Lett. 18(22), 2350–2352 (2006). 10. Y. Zhang, N. Deng, C.-K. Chan, and L.-K. Chen, “A multicast WDM-PON architecture using DPSK/NRZ
orthogonal modulation,” IEEE Photon. Technol. Lett. 20(17), 1479–1481 (2008).
11. F. Xiong, W.-D. Zhong, and H. Kim, “A broadcast-capable WDM-PON based on polarization-sensitive weak-resonant-cavity Fabry–Perot laser diodes,” J. Lightwave Technol. 30(3), 355–361 (2012).
12. H.-K. Lee, J.-H. Moon, S.-G. Mun, K.-M. Choi, and C.-H. Lee, “Decision threshold control method for optical receiver of WDM-PON,” J. Opt. Commun. Netw. 2(6), 381–388 (2010).
13. D. Jorgesen, C. F. Marki, and S. Esener, “Improved high pass filtering for passive optical networks,” IEEE Photon. Technol. Lett. 22(15), 1144–1146 (2010).
14. G.975.1: Forward error correction for high bit-rate DWDM submarine systems,” Recommendation, ITU-T (2004), http://www.itu.int/rec/T-REC-G.975.1-200402-I/en.
15. F. Koch, P. C. Reeves-Hall, S. V. Chernikov, and J. R. Taylor, “CW, multiple wavelength, room temperature, Raman fiber ring laser with external 19 channel, 10 GHz pulse generation in a single electro-absorption
modulator,” in Proceedings of the Optical Fiber Communication Conference (Anaheim, CA, 2001), Paper WDD7.
16. Q. Guo and A. V. Tran, “Mitigation of Rayleigh noise and dispersion in REAM-based WDM-PON using partial-response signaling,” in Proceedings of the European Conference on Optical Communication (Amsterdam, The Netherlands, 2012), Paper We.2.B.4.
1. Introduction
A wavelength-division-multiplexing passive optical network (WDM-PON) has been attracting a considerable attention for an access network to handle traffic explosions with growth of video-centric services such as high definition (HD) and ultra HD, since it can provide unlimited bandwidth, high security, and protocol transparency with a virtual point-to-point connection [1]. However, it is rather inefficient to provide broadcast services which are essentially based on a point-to-multipoint service. In recent years, a number of methods has been proposed to deliver broadcast data over the WDM-PON by employing various multiplexing techniques in wavelength [2–7], radio frequency [8–10], and polarization [11] domains. Among them, the wavelength band multiplexing can be preferable to the cost-sensitive WDM-PON due to easy separation of the broadcast signal from the existing downstream signal and unnecessary modification of a remote node (RN), thanks to a cyclic property of an arrayed-waveguide grating (AWG). In this scheme, a low-cost, simple, and compact multi-wavelength light source (MWS) is essential as an economical alternative to single mode laser arrays. In the early stage, a light emitting diode (LED) was adopted for a cost-effective implementation [2]. However, there are challenges related to limited launch power and high intensity noise originated from amplified spontaneous emission (ASE)-ASE beating after spectrum slicing by the AWG. Recently, a high-power superluminescent diode (SLED) was used to transmit the 1.25-Gb/s non-return-to-zero (NRZ) broadcast signal by help of a forward error correction (FEC) [3]. Taking advantage of the unpolarized ASE from an Erbium-doped fiber amplifier (EDFA), the relative intensity noise (RIN) can be improved by 3 dB relative to the polarized SLED [4]. A similar amount of the RIN can be also suppressed with an interferometric structure [5]. Even though error-free transmission can be accomplished without the FEC, data rate is limited as ever. As the alternative MWS, a mutually injected Fabry-Pérot laser diodes (MI F-P LDs) has been proposed [6–8]. Most recently, 2.5-Gb/s broadcast signal transmission without the FEC has been demonstrated using the low-noise characteristics of the MI F-P LDs [7]. Here, a Manchester modulation format was used to locate signal spectrum within the low-noise region between two noise peaks (i.e., dc and the fundamental noise of the external cavity resonance). However, transmission of the 10-Gb/s broadcast signal was questionable, since both noise peaks were within receiver bandwidth.
In this paper, we propose and demonstrate 10-Gb/s NRZ broadcast signal transmission in the WDM-PON based on the MI F-P LDs with a simple interferometric noise suppression technique and an electrical high-pass filter (HPF). The noise suppressor (NS) located at a central office (CO) can be shared by users in a WDM-PON. To evaluate a noise suppression performance, we simulate and measure RIN spectrum as a function of effective bandwidth of the NS. Thanks to the effective noise reduction, it is able to provide 10-Gb/s broadcast services to more than doubled subscribers with better receiver sensitivities. The origin of power penalty according to channel is also investigated by measuring the RIN and dynamic extinction ratio (ER).
2. Proposed broadcast capable WDM-PON based on a noise-suppressed MI F-P LDs
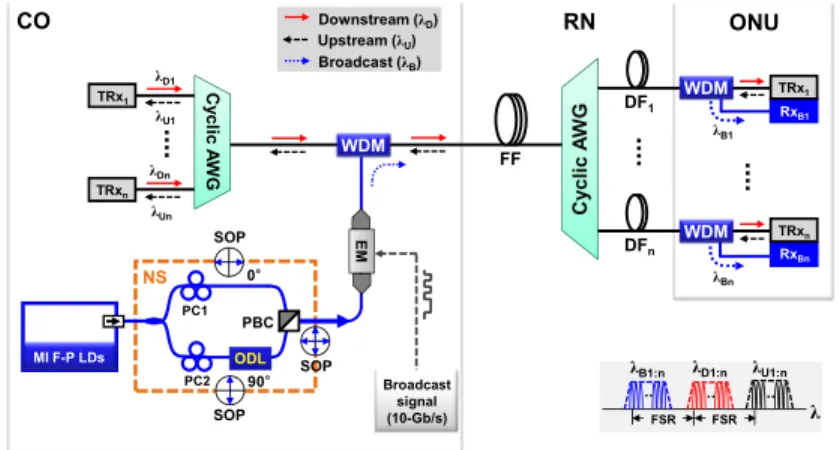
The schematic architecture of the proposed broadcast capable WDM-PON based on the noise-suppressed MI F-P LDs is shown in Fig. 1. The broadcast signal transmitter consists of the MI F-P LDs as the MWS and the NS based on the interferometric structure (dash box) at the CO. The linearly polarized light output from the MI F-P LDs is split into two equal-intensity
align the state of polarization (SOP) of the polarized beam to each principal axes of a polarization beam combiner (PBC), respectively. The optical beam of the lower branch is sent to a fiber optic delay line (ODL) to make a time delay difference (Δtd) between two branches.
The optical beams orthogonally polarization-multiplexed by the PBC are modulated with the 10-Gb/s broadcast signal by using a polarization-insensitive external modulator (EM), since two orthogonally polarization-multiplexed beams should be simultaneously modulated for an operation of the noise suppression. The MI F-P LDs spectrum for the broadcast signal (λB1:n)
is combined with WDM-PON wavelength bands for the up/downstream signal (λU1:n/λD1:n)
using a WDM filter and separated by integer multiples of the cyclic AWG’s free spectral range (FSR) from the WDM-PON wavelength bands. After propagating through a feeder fiber (FF), the multi-wavelength light is then spectrally sliced by the AWG at the RN and each slice is sent to each optical network unit (ONU) through a distribution fiber (DF). The broadcast signal is then received at each optical receiver (RxB1:n).
Since the optical signals into the receiver are orthogonally polarized, the average photocurrent (i.e., signal) at a photodiode (PD) in the RxB is a simple summation of individual
photocurrent generated by two equal-intensity optical signals. In the case when there is no time delay between two arms of the interferometer, the photocurrent fluctuations (i.e., noises) are also summation of the x- and y-polarized optical fluctuation. Thus, the signal-to-noise ratio (SNR) cannot be improved. On the other hand, if there is time delay between two arms of the NS, the photocurrent fluctuations interfere with each other constructively (in-phase) and destructively (out-of-phase) creating a series of low-noise windows. The time delay Δtd
determines center frequencies of low-noise windows corresponding to n/2Δtd, where n is an
odd number. PC2 PBC EM CO WDM C yclic A W G DF1 DFn FF Cy clic A W G RN ONU PC1 TRx1 TRxn SOP λB1 λBn Broadcast signal (10-Gb/s) λD1 λDn λU1 λUn Downstream (λD) Broadcast (λB) Upstream (λU) NS WDM WDM λB1:n FSR FSR λ λD1:n λU1:n RxBn TRxn RxB1 TRx1 MI F-P LDs ODL SOP SOP 0° 90°
Fig. 1. 10-Gb/s broadcast capable WDM-PON architecture based on the MI F-P LDs with a noise suppressor employing the interferometric structure.
The structure of the MI F-P LDs is based on optical sub-assembly as schematically shown in Fig. 2(a). It consists of two anti-reflection coated F-P LDs (front and rear facet reflectivity: 0.1% and 30%, respectively), aspheric lens, and 50/50 tap filter. The cavity length of each F-P LD was 600 µm. Thus, mode spacing was 0.6 nm (75 GHz). The external cavity length (the addition of L1 and L2 denoted in Fig. 2(a)) between two F-P LDs was about 19.3 mm (optical path length: 24.25 mm) which corresponds to the FSR of 6.1 GHz. All of these components were packaged into a single compact module [7]. Figure 2(b) shows the measured overall emission spectrum of the MI F-P LDs by an optical spectrum analyzer (OSA) with a resolution bandwidth of 0.06 nm. The bias current of each F-P LD was set at 2.3 × Ith, where
Ith is the lasing threshold current. It can be seen that more than 18 broadcast channels were
1 2 3 4 5 6 7 -150 -140 -130 -120 -110 -100 -90 -80 Frequency (GHz) RI N ( d B/ Hz ) (d) 0.902 ns (Sim.) 0.246 ns (Sim.) 3.030 ns (Sim.) 0.2 0.4 -140 -120 -100 -80 F-P LD1 F-P LD2 Aspheric lens Output port 50/50 tap filter L1 L2 (a) Wavelength (nm) O pti cal p ow er (dB m ) (b) 6 5 4 7 8 9 10 11 3 14 2 1 13 16 15 18 17 12 RBW: 0.06 nm 1 2 3 4 5 6 7 -150 -140 -130 -120 -110 -100 -90 -80 Frequency (GHz) RI N ( d B/ Hz )
(c) Single mode (measurement) Total mode (measurement)
RBW: 300 kHz 1/ƒ noise
1stperiodic noise
Fig. 2. (a) Schematic, (b) measured optical spectrum, (c) measured RIN spectra of the MI F-P LDs, and (d) simulated RIN spectra with the NS as a function of the time delay difference and their extended views with a 500 MHz span (inset).
Figure 2(c) shows the measured RIN spectra for the total and single mode by using an avalanche PD (APD) with a 3 dB bandwidth of 5 GHz and an electrical spectrum analyzer (ESA) with a resolution bandwidth of 300 kHz. In the case of the single mode (red curve), a tunable optical band pass filter (TOBPF) with a 3 dB bandwidth of 0.64 nm (80 GHz) was used to select one mode. The MI F-P LDs has superior noise characteristics between noise peaks (RIN <−130 dB/Hz). Unfortunately, there exist 1/ƒ noise whose 3 dB (10 dB) bandwidth is 22 MHz (62 MHz) and periodic noise peaks with intervals of 6.1 GHz determined by a length of the external cavity. This rapid increase should be attributed to the mode partition noise (MPN). The average RIN (obtained by dividing the integrated RIN by a frequency span from 9 kHz to 7 GHz) of the total mode and single mode are −134 and −112 dB/Hz, respectively. It is clear that the high-speed baseband data transmission over 10-Gb/s is limited by not only the 1/ƒ noise but also the 1st periodic noise peak included in the bandwidth of the optical receiver.
As described in the beginning of this section, to improve the noise performance of the MI F-P LDs, we needed to introduce the NS based on the interferometric structure due to its effectiveness of the noise suppression at certain frequencies. Firstly, the noise suppression effect was investigated through a RIN simulation. Figure 2(d) shows the RIN spectra as a function of the time delay difference of two arms in the NS. Besides, the inset shows the extended views in low frequency range to observe the 1/ƒ noise suppression. It may be noted that the time delay difference determines an effective bandwidth of low-noise window. Surprisingly, the 1st periodic noise peak is completely suppressed for about 35 dB while maintaining the 1/ƒ noise, when the time delay difference was 0.246 ns (solid line). Furthermore, both the 1/ƒ noise and the 1st periodic noise are simultaneously suppressed at the time delay difference of 3.030 ns (dotted line). However, the average RIN indicates relatively small improvement of 3.4 dB, since the NS is unable to suppress the 1/ƒ noise for more than 3 dB in the low frequency region, since the constructive interference always occurs at the dc photocurrent. Thus, for the considerable average RIN improvement, we need to utilize an electrical HPF at the optical receiver.
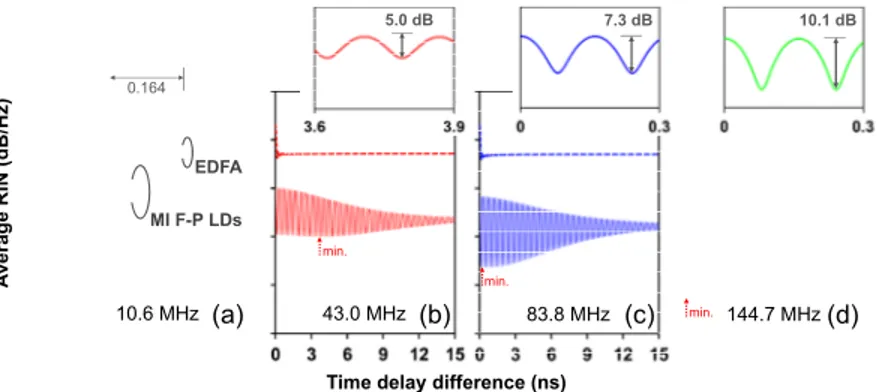
In order to evaluate the noise suppression performance by the NS and the HPF, we conducted a RIN simulation again as a function of the time delay difference with a time step of 1 picosecond and it was then repeated according to a selected 3 dB low-cutoff frequency of the 1st order HPF. As shown in Fig. 3(a) and its inset, we can see a periodic feature (solid
frequency. As the time delay difference increases from 0 (without the NS) to 15 ns, the overall trend of the decreasing average RIN was observed, since several low-noise windows with rather small effective bandwidth suppress not only the periodic noise but also the still dominant 1/ƒ noise located above the low-cutoff frequency of the HPF. As we increase the cutoff frequency to 43.0, 83.8, and 144.7 MHz, the minimum average RIN dramatically decreases at the short time delay difference satisfying the RIN requirement of −120 dB/Hz for 10-Gb/s signal transmission [12] as shown in Figs. 3(b)–3(d). Moreover, the maximum noise suppression increases as indicated in insets, since the 1st periodic noise peak dominates as we increase the cutoff frequency. The maximum suppression was 10.1 dB at the cutoff frequency of 144.7 MHz. Therefore, when the NS and the HPF are utilized to suppress the 1st periodic noise and the 1/ƒ noise, individually, the best RIN performance is achievable.
On the other hand, in the case of the spectrally sliced ASE from the EDFA considered for comparison (dash line), noise suppression ratio was fixed by 3 dB regardless of both the time delay difference and the selected low-cutoff frequency, because the ASE-ASE beat noise of the EDFA has a flat spectral shape over the entire frequency much less than the optical spectral width.
Time delay difference (ns)
A ve rag e RI N (d B /Hz ) 10.6 MHz 43.0 MHz 83.8 MHz 144.7 MHz MI F-P LDs EDFA (a) (b) (c) (d) 0.164 7.3 dB 10.1 dB min. min. min. 5.0 dB
Fig. 3. Simulation results of the average RIN from 9 kHz to 7 GHz as a function of time delay difference according to the 3 dB low-cutoff frequency of (a) 10.6 MHz, (b) 43.0 MHz, (c) 83.8 MHz, (d) 144.7 MHz and their extended views with 0.3 ns span (inset).
Unfortunately, the HPF which has the higher low-cutoff frequency compared with the 1st signal spectrum brings about unavoidable signal distortion [13]. Thus, we need trade-off between the noise suppression and the signal distortion. It may be noted that even though the suppressed RIN by the combined use of the NS and HPF gives the average RIN less than – 120 dB/Hz, it would be necessary to utilize the FEC.
3. Experimental setup and results
The experimental setup based on the MI F-P LDs with the NS to demonstrate the 10-Gb/s broadcast transmission is shown in Fig. 4. Each F-P LD operated at the bias current of 2.3 × Ith. The polarized light output from the MI F-P LDs was sent to the NS. Here, an insertion loss
of the ODL at the lower branch was about 1.0 dB. Thus, to match power in both arms, a variable optical attenuator (VOA) was added to the upper branch. The polarization-multiplexed beams by the PBC were passed through an optical amplifier (OA) based on the EDF and modulated by means of a semiconductor electro-absorption modulator (EAM) with the NRZ format. The EAM operated at a reverse bias voltage (VR) and a drive voltage of 1.2
V and 2.4 Vpp, respectively. For the maximum noise suppression, the EAM should have a
very low polarization dependent loss (PDL). The measured PDL was less than 0.1 dB and 1 dB for ‘1’ level and ‘0’ level as a function of the wavelength (corresponding to the overall emission spectrum of the MI F-P LDs), respectively. The bit-rate was 11-Gb/s including the 64B/66B code-rate (10.3-Gb/s) and FEC overhead (6.69%) with a pseudorandom bit
sequence (PRBS) pattern length of 27-1 from a pulse pattern generator. Here, we selected RS
(255, 239) code and RS (1901, 1855) with Extended Hamming Product Code (512, 502) × (510, 500) as the 1st and 2nd generation FEC, respectively [14]. The modulated optical signal propagated through a dispersion compensating fiber module (DCM) to compensate the chromatic dispersion and a 20 km standard single-mode fiber (SSMF). After spectrum slicing by the TOBPF emulating the 0.8 nm (100 GHz) channel spacing AWG with a 3 dB bandwidth of 0.64 nm (80 GHz) at the RN, it was then received at the APD whose 3 dB bandwidth was about 5 GHz. The 1st order HPFs which had various low-cutoff frequencies were simply constructed using a single capacitor.
MI F-P LDs 20-km SSMF 11-Gb/s NRZ signal OA Bias Tee CO RN ONU
TOBPF VOA APD HPF
0° PC2 ODL PBC PC1 VOA 90° EAM Δλ:0.64 nm Pulse Pattern Generator HPF
Optical fiber Electrical cable DCM DC Bias(VR) RF amp 50/50 Digital Communication Analyzer Clock-and-Data Recovery + Error Detector NS
Fig. 4. Experimental setup for broadcast transmission using the noise suppressed MI F-P LDs.
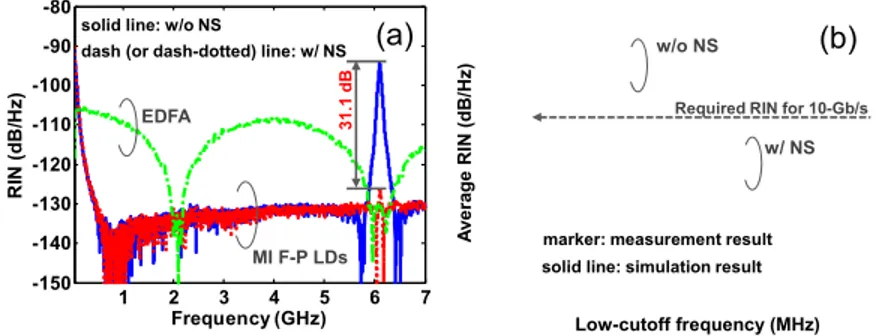
Figure 5(a) displays the measured RIN spectra w/o and w/ the NS to show performance of the noise suppression. Firstly, the RIN spectrum of the EDFA with a polarizer and the NS was measured (green curve) to set the time delay difference of 0.246 ns which yielded the 2nd low noise window at 6.1 GHz for the best RIN performance as understood through the previous RIN simulation. As we expected, the 1st periodic noise peak was significantly suppressed for 31.1 dB with the NS (red curve) compared to that without the NS (blue curve). In addition, the 1/ƒ noise suppression was confirmed by the average RIN measurement as a function of the low-cutoff frequency of the used HPF as shown in Fig. 5(b). Results showed that measured average RIN values w/o and w/ NS were well matched with simulation results. It may be noted that again, the effect of HPF with the NS is remarkable compared to that without the NS reducing RIN below −120 dB/Hz.
1 2 3 4 5 6 7 -150 -140 -130 -120 -110 -100 -90 -80 Frequency (GHz) RI N (d B/ Hz) MI F-P LDs EDFA
solid line: w/o NS
dash (or dash-dotted) line: w/ NS (a)
31 .1 d B Low-cutoff frequency (MHz) A ve rage RI N (dB/ Hz ) w/o NS (b) w/ NS
solid line: simulation result marker: measurement result
Required RIN for 10-Gb/s
Fig. 5. (a) Measured RIN spectra of the MI F-P LDs w/o and w/ the NS and (b) average RIN from 9 kHz to 7 GHz according to the 3-dB low-cutoff frequency of the constructed HPF.
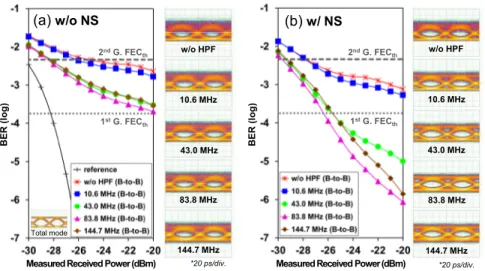
For the investigation of the transmission performance, we measured bit-error ratio (BER) curves and eye diagrams as a function of the low-cutoff frequency w/o and w/ the NS as shown in Figs. 6(a) and 6(b), respectively. These measurements were conducted in back-to-back (B-to-B) configuration (without the 20 km SSMF and DCF in Fig. 4). As the low-cutoff frequency increases from 10.6 to 83.8 MHz, the receiver sensitivity at the 2nd generation FEC threshold (FECth) of 4.6 × 10⁻³ is enhanced due to the more suppressed 1/ƒ noise. As
at −20 dBm received power. By comparing performance w/o and w/ the NS, the significant BER improvement can be achieved at the low-cutoff frequency higher than 10.6 MHz. In the case of the 83.8 MHz cutoff frequency (▲), the NS can improve more than two orders of magnitude of BER at −20 dBm received power. Furthermore, it enables the 1st generation FEC whose threshold is 1.8 × 10⁻⁴ to be utilized. Obviously, we can also observe the clearly
opened eye diagrams compared to that without the NS. However, the further increase of the
cutoff frequency to 144.7 MHz () rather degrades the BER performance by the more
distorted NRZ signal components appearing at 86.6 MHz interval. Thus, there exists the optimized low-cutoff frequency around 83.8 MHz.
2ndG. FEC th
1stG. FECth
(b) w/ NS
Measured Received Power (dBm)
BER (l og ) w/o HPF 10.6 MHz 43.0 MHz 83.8 MHz 144.7 MHz *20 ps/div.
Measured Received Power (dBm) 2ndG. FEC th 1stG. FEC th (a) w/o NS BER (l og ) w/o HPF 10.6 MHz 43.0 MHz 83.8 MHz 144.7 MHz Total mode *20 ps/div.
Fig. 6. Measured BER curves (a) w/o the NS, (b) w/ the NS as a function of low-cutoff frequency and their corresponding eye diagrams at −20 dBm received power (inset).
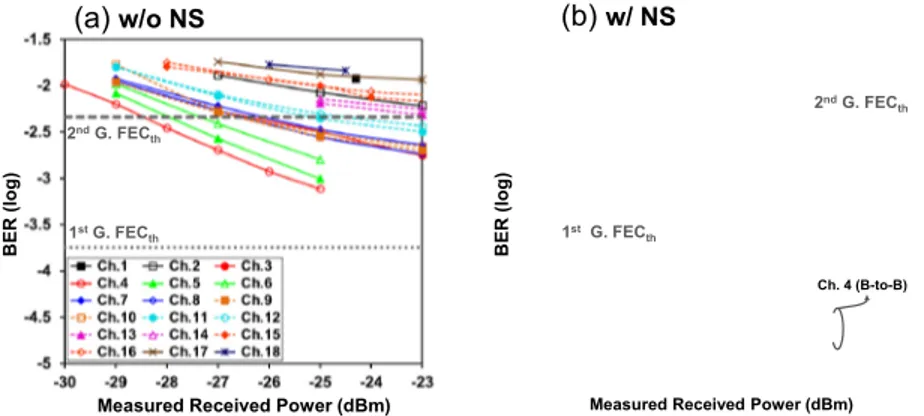
As seen in Figs. 7(a) and 7(b), we also measured the BER curves according to channel numbered in Fig. 2(b) with the 20 km SSMF and the DCM. The optimized HPF with the 83.8 MHz low-cutoff frequency was used. It should be noted that the power penalty induced by dispersion after 20 km transmission was negligible compared to the back-to-back configuration by help of the DCM as shown in Fig. 7(b). Obviously, the NS improves BER performances of all 18 channels satisfying the 2nd generation FECth. Moreover, it is able to
utilize the 1st generation FEC for more than 8 channels. Based on these BER curves, the receiver sensitivities at the FECth were measured and simulated as shown in Fig. 8(a). In the
simulation, a 5th order Bessel filter which has the most similar frequency response with the APD was designed as an electrical low-pass filter (LPF). In order to maximize the number of useable channels, we selected the 2nd generation FEC. From the results, if we allow 3 dB changes in the receiver sensitivity, the number of useable channels can be remarkably expanded from 8 w/o the NS () to 18 w/ the NS ().
In addition, to figure out the origin of the power penalty according to the channel, dynamic ER and the average RIN were also measured. As shown in Fig. 8(a), ER ( × ) was proportional to the spectral shape of the MI F-P LDs because of modulation characteristics in the used EAM [15]. Unfortunately, all measured ERs were less than 6 dB, since the emission spectrum of the MI F-P LDs was not-matched to designed wavelength of the EAM (~1550 nm). Thus, it is clear that if we utilize a suitable EAM, the higher ER can be achieved (We observed 10.0 dB ER at 1550 nm with a different light source). As seen in Fig. 8(b), the measured average RIN (from 9 kHz to 7 GHz), in common with ER, also showed a spectral shape dependency. To confirm whether the measured RIN originated from only the 1/ƒ noise induced by the MPN () or the addition of the MPN and the ASE beat noise () from the used OA, we calculated the maximum beat noise from a measured optical SNR (OSNR). The
RIN degradation by the ASE beat noise was insignificantly less than 0.5 dB resulting from the OSNR ( × ) larger than 20 dB. Thus, dominant factors of the power penalty are both the MPN and ER. 2ndG. FEC th 1stG. FEC th (b) w/ NS
Measured Received Power (dBm)
BE R (l o g ) Ch. 4 (B-to-B) w/o NS 1stG. FEC th 2ndG. FEC th (a) w/o NS
Measured Received Power (dBm)
BE
R (l
o
g
)
Fig. 7. Measured BER curves according to channel (a) w/o the NS and (b) w/ the NS.
A ver age RIN ( d B /Hz ) Channel number (b) OSNR (dB ) Channel number Se nsitiv ity @ 2 nd G. FEC th (dBm) ER (dB) (a)
Fig. 8. (a) Measured and simulated receiver sensitivity at 2nd generation FECth, measured ER, (b) average RIN and OSNR according to the channel.
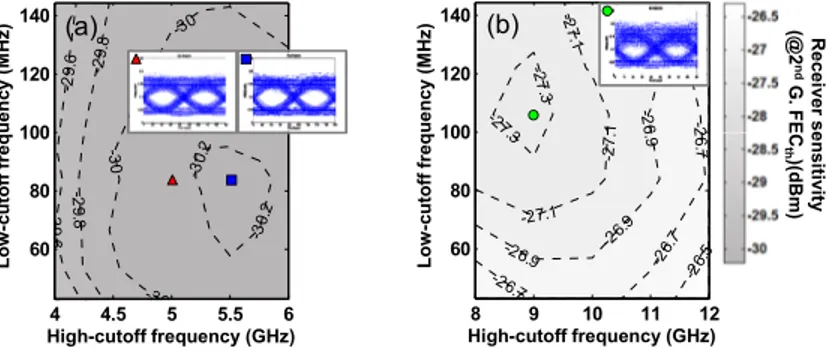
For the receiver bandwidth optimization, we conducted the simulation of the receiver sensitivity at the 2nd generation FECth with the NS as a function of the low- and high-cutoff
frequencies for the HPF and the LPF, respectively. As illustrated in Fig. 9(a), the optimum low-cutoff frequency range for the HPF was from 66.3 MHz to 93.6 MHz including the experimentally optimized cutoff frequency of 83.8 MHz. However, for the LPF, we observed that the high-cutoff frequency of 5.5 GHz () relative to the used APD bandwidth of 5 GHz () was optimized value. This can be interpreted as trade-off between filtering out the 2nd periodic noise peak at 12.2 GHz and an intersymbol interference (ISI) effect. It may be noted that the NS cannot suppress the 2nd periodic noise due to the occurrence of the constructive interference when the low-noise window is set at the 1st periodic noise frequency. Even though the improvement in the receiver sensitivity (~0.2 dB) was relatively small, we could observe the more opened eye diagram as shown in the inset. Thus, the results imply that the utilization of the higher-speed receiver can enhance the transmission performance.
To investigate the feasibility of higher-speed transmission, the bit-rate was doubled to 22-Gb/s, while keeping the MI F-P LDs which has the periodic noise peaks with intervals of 6.1 GHz. Although the NS suppressed the fundamental noise peak at 6.1 GHz, the performance degradation by the noise peak at 2nd harmonic was expected, since a more wideband receiver was needed for this case as shown in Fig. 9(b). The inset shows the degraded eye diagram () compared with 10-Gb/s eyes. However, it is possible to transmit the 20-Gb/s broadcast signal with proper HPF and LPF. The optimum high-cutoff frequency was less than a half of the
bit-rate to suppress the 2nd periodic noise peak. For the low-cutoff frequency of the HPF, we expected the increase of the optimum cutoff frequency by two times, since the first spectrum of the signal (86.6 MHz) was doubled. However, it was less than two times that for the 10-Gb/s case. This can be explained by the narrow 1/f noise bandwidth of 22 MHz as shown in Fig. 2(d). Based on this simulation result, we expect much higher bit-rate transmission using a MI F-P LDs with higher the fundamental noise peak. In other words, the MI F-P LDs with more compact package is needed for higher bit-rate broadcast signal transmission.
-27.1 -27. 1 -2 7.1 -26.9 -26.9 -2 6.9 -2 6.9 -26. 7 -2 6.7 -2 6.7 -27.3 -2 7.3 -26.7 -26. 5 -2 6.5 8 9 10 11 12 60 80 100 120 140 High-cutoff frequency (GHz) Low -c ut off f req ue ncy ( M H z) Rece iv er sen si tiv ity (@ 2 nd G. F E C th )(d B m ) (b) -30 -30 -30 -29. 8 -2 9.8 -29. 6 29 6 -30. 2 -30. 2 4 4.5 5 5.5 6 60 80 100 120 140 High-cutoff frequency (GHz) Low -c ut of f f req uen cy ( M H z) (a)
Fig. 9. Simulation results of the receiver sensitivity according to the low- and high-cutoff frequencies at the bit-rate of (a) 11-Gb/s, (b) 22-Gb/s and the simulated eye diagrams at each denoted point (inset).
4. Discussion and conclusion
In this paper, we used a NRZ signal format for broadcast signal transmission. However, if we use another signal format such as a quadrature-amplitude-modulation orthogonal-frequency-division-multiplexing format [6], the Manchester code [7], or a partial-response signal modulation format (i.e., dicode and modified duobinary signal) [16], it is possible to suppress 1/ƒ noise more effectively without inducing the signal distortion, since those signal formats have no signal spectrum around dc. Then, the useable spectrum with very low-noise can be doubled with the interferometric noise suppressor for higher-speed broadcast signal transmission. In this case, it may be possible to transmit the 20-Gb/s or 40-Gb/s broadcast signal using the MI F-P LDs without the FEC.
We have proposed and experimentally demonstrated a 10-Gb/s broadcast signal transmission in WDM-PON employing a single MI F-P LDs with the interferometric noise suppressor. To suppress the fundamental noise peak which limits high-speed transmission, we introduced the noise suppressor whose frequency response was designed to match with the noise spectrum of the MI F-P LDs. The suppression ratio of the 1st periodic noise peak at 6.1 GHz was more than 30 dB. Besides the noise suppressor, an electrical high pass filter was used to filter out the 1/ƒ noise in a low frequency region. A successful demonstration of 10-Gb/s broadcast signal transmission with the FEC confirms a feasibility of the MI F-P LDs as one of the promising cost-effective multi-wavelength light sources.