Relationship between serum 25-hydroxyvitamin D
concentration and risks of metabolic syndrome
in children and adolescents from Korean National
Health and Nutrition Examination survey 2008–2010
Purpose: Previous studies have revealed many inconsistent results regarding the relationship between vitamin D and metabolic syndrome. The purpose of our study was to investigate the association between serum 25-hydroxyvitamin D (25(OH)D) concentration and factors that characterize metabolic syndrome in Korean children and adolescents.
Methods: We analyzed data from 2,880 children and adolescents aged 10–18 years collected from the 2008–2010 Korean National Health and Nutrition Examination Survey. We investigated the data according to quartiles of 25(OH)D concentrations. Results: Systolic blood pressure and diastolic blood pressure with adjustment for sex and age differed significantly between the serum 25(OH)D groups and exhibited negative trend as 25(OH)D concentrations increased. The number of subjects with metabolic syndrome was greater in the low 25(OH)D groups (I, II, and III quartile) than in the high 25(OH)D group (IV quartile) (P=0.029). BMI and waist circumference were lower in the high 25(OH)D group. Serum 25(OH)D concentration correlated negatively with homeostasis model assessment estimate of insulin resistance (ρ=– 0.073, P<0.001) and correlated positively with quantitative insulin sensitivity check index (ρ=0.095, P<0.001).
Conclusion: Low serum 25(OH)D level is associated with an increase of insulin resistance and metabolic syndrome in children and adolescents.
Keywords: 25-hydroxyvitamin D, Metabolic syndrome, Child, Obesity, Insulin resistance
Dong Yup Lee, MD1,
Ah Reum Kwon, MD1,
Jung Min Ahn, MD1,
Ye Jin Kim, MD1,
Hyun Wook Chae, MD1,
Duk Hee Kim, MD, PhD2,
Ho-Seong Kim, MD, PhD1 1Department of Pediatrics, Yonsei University College of Medicine, Seoul, 2Sowha Children’s Hospital, Seoul, Korea
Ann Pediatr Endocrinol Metab 2015;20:46-52
Received: 13 October, 2014 Revised: 27 October, 2014 Accepted: 21 November, 2014
Address for correspondence:
Hyun Wook Chae, MD
Department of Pediatrics, Gangnam Severance Hospital, Yonsei University College of Medicine, 211 Eonju-ro, Gangnam-gu, Seoul 135-720, Korea Tel: +82-2-2019-3355
Fax: +82-2-3461-9473 E-mail: [email protected]
This is an Open Access article distributed under the terms of the Creative Commons Attribution Non-Commercial License (http://
creativecommons.org/licenses/by-nc/3.0) which permits unrestricted non-commercial use, distribution, and reproduction in any ISSN: 2287-1012(Print) ISSN: 2287-1292(Online)
Introduction
According to recent studies, vitamin D deficiency is common in all ages and has become a worldwide health concern1). This condition could be a problem especially in growing children because vitamin D plays an important role in bone metabolism and calcium homeostasis1,2). Research has shown that vitamin D deficiency is related to musculoskeletal disease, cardiovascular disease, type 2 diabetes mellitus, certain types of cancers, and autoimmune diseases3-5).
Metabolic syndrome is a cluster of medical disorders that, when manifested altogether, increases the risk of developing cardiovascular disease and type 2 diabetes6). Metabolic syndrome is characterized by dyslipidemia, glucose intolerance, elevated blood pressure, and abdominal obesity7). In particular, insulin resistance (IR) plays a central role in the pathogenesis of type 2 diabetes mellitus and other cardiovascular complication8). Obese children have a higher risk of IR9). Moreover, studies have shown that obesity is associated with vitamin D
deficiency due to decreased bioavailability of the vitamin10,11). Although research on the relationship between vitamin D and metabolic syndrome has increased, many results have been inconsistent. Gordon et al.12) reported a negative correlation between BMI and serum 25-hydroxy-vitamin D [25(OH) D] concentration, whereas Baradaran et al.13) showed no significant association between these parameters. Studies of the relationship between serum vitamin D and metabolic syndrome in children are lack. Thus, we investigated the association between serum 25(OH)D concentration and the components of metabolic syndrome and IR in Korean children and adolescents using data obtained from the Korean National Health and Nutrition Examination Survey (KNHANES) conducted from 2008 to 2010.
Materials and methods
1. Subjects
We used data from the 2008–2010 KNHANES. This cross-sectional and nationally representative survey was conducted by the Division of Chronic Disease Surveillance of the Korean Centers for Disease Control and Prevention, which has assessed the health and nutritional status of adults and children since 1998. This study was approved by the Korean Centers for Disease Control and Prevention and written informed consents were obtained. Also, written informed consents from the next of kin, caretakers, or guardians were obtained on behalf of the children enrolled in this study. The study was approved by the Yonsei University Health System, Gangnam Severance Hospital, Institutional Review Board (3–2014–0135). From 2008 to 2010, a survey was conducted annually that included 3,656 children and adolescents aged 10–18 years. We excluded individuals for which data on 25(OH)D was missing (n=721), as well as patients with an insufficient blood sample to determine metabolic syndrome (n=611). In total, the study population consisted of 2,880 children and adolescents, of which 1,537 were boys and 1,343 were girls.
2. Anthropometric and biochemical measurements
The participants’ height, weight, and waist circumferences (WCs) were measured to the nearest 0.1 kg using a scale (CAS, Seoul, Korea) and 0.1 cm using a stadiometer (SECA-225, Hamburg, Germany) by a trained medical examiner. WC was measured at the narrowest point between the lower border of the rib cage and the iliac crest. Standard deviation scores (SDS) of heights, weights, and BMI were calculated using the lambda-mu-sigma method. Blood pressure was measured in the right arm using a standard mercury sphygmomanometer (Baumanometer, W.A. Baum Co., Copiague, NY, USA) after the subject had rested for 5 minutes in a sitting position. Two systolic and diastolic blood pressure (DBP) readings were recorded at 5-minute intervals, and the average was used for
analysis.
Blood samples were collected from subjects who had fasted overnight. The serum triglyceride, high density lipoprotein (HDL) cholesterol, and plasma fasting glucose level were measured using a Hitachi Automatic Analyzer 7600 (Hitachi, Tokyo, Japan). Serum insulin levels was measured using the competitive radioimmunoassay (RIA) method with 1470 WIZARD equipment (PerkinElmer, Turku, Finland) and serum 25(OH)D levels were measured with 125I-labelled RIA kits (Diasorin, Stillwater, MN, USA) using a gamma-counter (1470 Wizard; PerkinElmer). IR was evaluated using the homeostasis model assessment of IR (HOMA-IR) index, which was calculated as [glucose (mmol/L)×insulin (µU/mL)]/22.5014), and the quantitative insulin sensitivity check index (QUICKI), which was determined as 1/{log [fasting insulin (µU/mL)]+log [fasting glucose (mg/dL)]}15).
3. Definition of metabolic syndrome
Modified National Cholesterol Education Program-Adult Treatment Panel III (NCEP-ATP III) criteria was used for diagnosis of adolescent metabolic syndrome16). We used a cutoff value of 100 mg/dL for fasting glucose as revised by the American Diabetes Association in 200317). According to these criteria, the diagnosis for metabolic syndrome requires the presence of three or more of the following: (1) WC≥90th percentile for age and sex, (2) triglycerides≥110 mg/dL, (3) HDL cholesterol≤40 mg/dL, (4) either systolic blood pressure (SBP) or DBP≥90th percentile for age, sex, and height, (5) or fasting glucose≥100 mg/dL. The reference values for WC and blood pressure were based on growth charts published by the Korean Pediatric Society in 200718).
4. Statistical analysis
SAS 9.2 (SAS Institute Inc., Cary, NC, USA) was used for data analysis. The statistical analyses conducted were the Student t-test, chi-square test, analysis of variance (ANOVA), analysis of covariance (ANCOVA), Mantel-Haenszel test, and partial correlation analysis. Children were divided into four subgroups according to quartiles of serum 25(OH)D concentration. Anthropometric data, each metabolic component, and the insulin sensitivity index were compared between the quartile groups by ANOVA, ANCOVA and trend analyses. Partial correlation analysis was used to obtain the partial correlation coefficient between vitamin D and the insulin sensitivity index. P<0.05 was considered as statistically significant.
Results
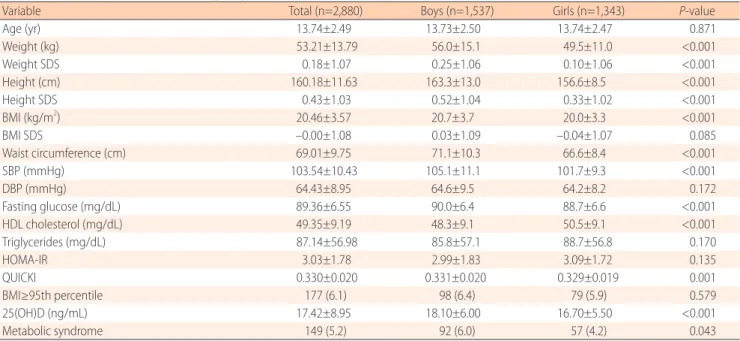
Of the 2,880 subjects included in this study, 1,537 (53.3%) were boys and 1,343 (46.7%) were girls. The mean age was 13.74±2.49, ranging from 10–18 years. Weight, weight SDS, height, height SDS, BMI, WC, SBP, fasting glucose, HDL cholesterol, and
QUICKI differed significantly between the sexes. The serum 25(OH)D concentration and prevalence of metabolic syndrome were significantly higher in boys than in girls. The mean serum 25(OH)D concentration of all participants was 17.42±8.95 ng/ mL (Table 1).
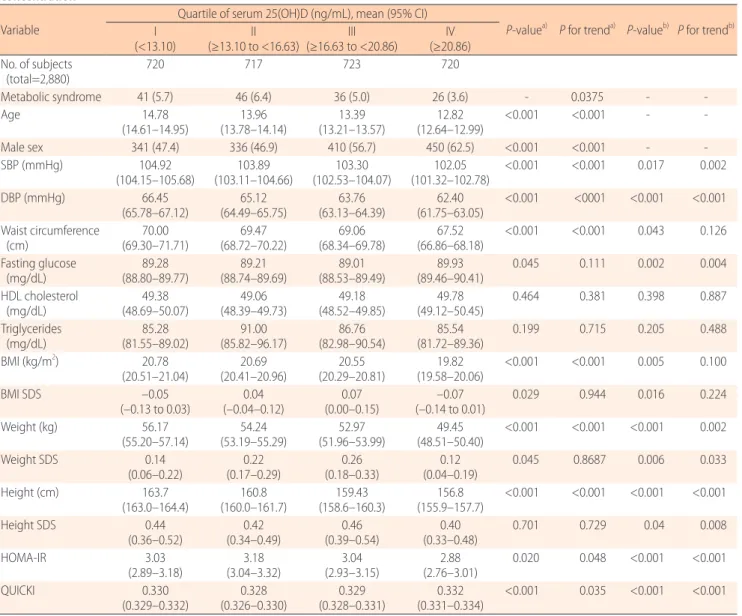
All subjects were divided into four groups according to quartiles of serum 25(OH)D concentration, namely I (<13.10 ng/mL), II (13.10 to 16.63 ng/mL), III (16.63 to 20.86 ng/mL), and IV (≥20.86 ng/mL). SBP, DBP, WC, BMI, HOMA-IR, and QUICKI were significantly different and exhibited a consistent trend according to the quartile of serum 25(OH)D in the analysis with unadjusted data (Table 2).
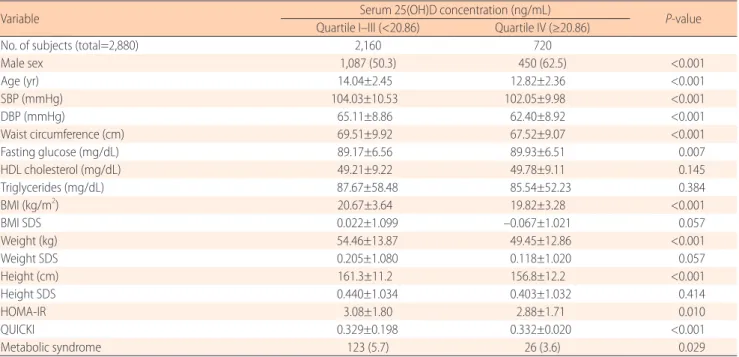
When vitamin D deficiency was defined as less than 20 ng/ mL19), most of subjects were vitamin D deficiency except IV quartile group. We put together subjects from first quartile group to third quartile group and performed analysis of comparison with IV quartile group. There were significant difference in mean age, SBP, DBP, WC, fasting glucose, BMI, weight, height, HOMA-IR and QUICKI between two groups. The occurrence of metabolic syndrome was significantly lower in IV quartile group (P=0.029) (Table 3).
Finally, the association between serum 25(OH)D level and insulin sensitivity index is presented in Table 4. Partial corr-elation analysis revealed an inverse corrcorr-elation between serum 25(OH)D and HOMA-IR (ρ=–0.073) and a positive correlation between serum 25(OH)D and QUICKI (ρ=0.095).
Discussion
In this study, we analyzed the relationship between serum 25(OH)D levels and risk factors for metabolic syndrome in Korean children and adolescents using nationally representative data collected for 3 years. We tried to show the correlation of serum 25(OH)D with not only metabolic component, but also insulin sensitivity index. Our study found low serum 25(OH) D concentrations were related with elevated blood pressure, abdominal obesity, increase of insulin resistance, and high prevalence of metabolic syndrome.
Several studies have investigated the relationship between serum 25(OH)D levels and cardiovascular risk factors, such as insulin resistance and abdominal obesity. In a study of 1,660 nine-year old Korean children, Lee et al.20) found that vitamin D deficiency in children may be a risk factor for obesity and metabolic syndrome. Reis et al.21) also found that low serum vitamin D in United States adolescents aged 12–19 years was strongly associated with hypertension, hyperglycemia, and metabolic syndrome. These studies showed a consistent trend that incidence of metabolic syndrome decreased as serum 25(OH)D increased.
However, our study showed a different result compared with previous study in part. BMI SDS, weight SDS and incidence of metabolic syndrome were lower in the first quartile of serum 25(OH)D group than in the second quartile group. This result indicates that people in the first quartile of serum 25(OH)D were relatively slimmer than those in the second quartile. In obese patients, the ability to produce vitamin D in the skin is
Table 1. Basic characteristics of the study subjects
Variable Total (n=2,880) Boys (n=1,537) Girls (n=1,343) P-value
Age (yr) 13.74±2.49 13.73±2.50 13.74±2.47 0.871 Weight (kg) 53.21±13.79 56.0±15.1 49.5±11.0 <0.001 Weight SDS 0.18±1.07 0.25±1.06 0.10±1.06 <0.001 Height (cm) 160.18±11.63 163.3±13.0 156.6±8.5 <0.001 Height SDS 0.43±1.03 0.52±1.04 0.33±1.02 <0.001 BMI (kg/m2) 20.46±3.57 20.7±3.7 20.0±3.3 <0.001 BMI SDS –0.00±1.08 0.03±1.09 –0.04±1.07 0.085 Waist circumference (cm) 69.01±9.75 71.1±10.3 66.6±8.4 <0.001 SBP (mmHg) 103.54±10.43 105.1±11.1 101.7±9.3 <0.001 DBP (mmHg) 64.43±8.95 64.6±9.5 64.2±8.2 0.172 Fasting glucose (mg/dL) 89.36±6.55 90.0±6.4 88.7±6.6 <0.001 HDL cholesterol (mg/dL) 49.35±9.19 48.3±9.1 50.5±9.1 <0.001 Triglycerides (mg/dL) 87.14±56.98 85.8±57.1 88.7±56.8 0.170 HOMA-IR 3.03±1.78 2.99±1.83 3.09±1.72 0.135 QUICKI 0.330±0.020 0.331±0.020 0.329±0.019 0.001 BMI≥95th percentile 177 (6.1) 98 (6.4) 79 (5.9) 0.579 25(OH)D (ng/mL) 17.42±8.95 18.10±6.00 16.70±5.50 <0.001 Metabolic syndrome 149 (5.2) 92 (6.0) 57 (4.2) 0.043
P-values were calculated as a comparison between boys and girls.
Values are presented as mean±standard deviation or number (%).
SDS, standard deviation score; BMI, body mass index; SBP, systolic blood pressure; DBP, diastolic blood pressure; HDL cholesterol, high density lipoprotein cholesterol; HOMA-IR, homeostasis model assessment of insulin resistance index; QUICKI, quantitative insulin sensitivity check index; 25(OH)D, 25-hydroxyvitamin D.
not reduced compared to nonobese patients; however, obesity may decrease vitamin D release from the skin and dietary sources into the circulation by storing fat-soluble vitamin D in subcutaneous fat10). Many researches have demonstrated inverse correlation between status of obesity and serum 25(OH)D. Our result implies the subjects in first quartile could be affected by other factors that were uncontrolled in this study but had stronger effect than obesity to decrease serum vitamin D levels, such as sun exposure time, whether sunblock use or not, amount of vitamin D intake, life style, and so on. Especially, sun exposure is critical factor to synthesize endogenous vitamin D. However, our study could not consider and control these factors.
Another reason for the discrepancy with previous result
may be a low prevalence of obesity in Korean children and adolescents. When obesity was defined beyond the 95th percentile by sex and age, 16.9% of United States children and adolescents aged 2–19 years were found to be obese in 2009– 201022), whereas the prevalence of obesity among participants was only 6.1% in this study. In the study of Reis et al.21), they compared BMI according to quartiles of serum 25(OH)D in the same manner, and from the first quartile to the fourth quartile, BMI values were 26.0, 24.3, 23.5, and 22.1, respectively. These values were higher than our results which were 20.78, 20.69, 20.55, and 19.82. Populations with a low prevalence of obesity may be obscuring the relationship between serum vitamin D and metabolic syndrome23).
Table 2. Factors of metabolic syndrome, anthropometric indices, and insulin sensitivity index according to quartiles of serum 25(OH)D concentration
Variable Quartile of serum 25(OH)D (ng/mL), mean (95% CI) P-valuea)
P for trenda) P-valueb) P for trendb) I (<13.10) (≥13.10 to <16.63)II (≥16.63 to <20.86)III (≥20.86)IV No. of subjects (total=2,880) 720 717 723 720 Metabolic syndrome 41 (5.7) 46 (6.4) 36 (5.0) 26 (3.6) - 0.0375 - -Age 14.78 (14.61–14.95) (13.78–14.14)13.96 (13.21–13.57)13.39 (12.64–12.99)12.82 <0.001 <0.001 - -Male sex 341 (47.4) 336 (46.9) 410 (56.7) 450 (62.5) <0.001 <0.001 - -SBP (mmHg) 104.92 (104.15–105.68) (103.11–104.66)103.89 (102.53–104.07)103.30 (101.32–102.78)102.05 <0.001 <0.001 0.017 0.002 DBP (mmHg) 66.45 (65.78–67.12) (64.49–65.75)65.12 (63.13–64.39)63.76 (61.75–63.05)62.40 <0.001 <0001 <0.001 <0.001 Waist circumference (cm) (69.30–71.71)70.00 (68.72–70.22)69.47 (68.34–69.78)69.06 (66.86–68.18)67.52 <0.001 <0.001 0.043 0.126 Fasting glucose (mg/dL) (88.80–89.77)89.28 (88.74–89.69)89.21 (88.53–89.49)89.01 (89.46–90.41)89.93 0.045 0.111 0.002 0.004 HDL cholesterol (mg/dL) (48.69–50.07)49.38 (48.39–49.73)49.06 (48.52–49.85)49.18 (49.12–50.45)49.78 0.464 0.381 0.398 0.887 Triglycerides (mg/dL) (81.55–89.02)85.28 (85.82–96.17)91.00 (82.98–90.54)86.76 (81.72–89.36)85.54 0.199 0.715 0.205 0.488 BMI (kg/m2) 20.78 (20.51–21.04) (20.41–20.96)20.69 (20.29–20.81)20.55 (19.58–20.06)19.82 <0.001 <0.001 0.005 0.100 BMI SDS –0.05 (–0.13 to 0.03) (–0.04–0.12)0.04 (0.00–0.15)0.07 (–0.14 to 0.01)–0.07 0.029 0.944 0.016 0.224 Weight (kg) 56.17 (55.20–57.14) (53.19–55.29)54.24 (51.96–53.99)52.97 (48.51–50.40)49.45 <0.001 <0.001 <0.001 0.002 Weight SDS 0.14 (0.06–0.22) (0.17–0.29)0.22 (0.18–0.33)0.26 (0.04–0.19)0.12 0.045 0.8687 0.006 0.033 Height (cm) 163.7 (163.0–164.4) (160.0–161.7)160.8 (158.6–160.3)159.43 (155.9–157.7)156.8 <0.001 <0.001 <0.001 <0.001 Height SDS 0.44 (0.36–0.52) (0.34–0.49)0.42 (0.39–0.54)0.46 (0.33–0.48)0.40 0.701 0.729 0.04 0.008 HOMA-IR 3.03 (2.89–3.18) (3.04–3.32)3.18 (2.93–3.15)3.04 (2.76–3.01)2.88 0.020 0.048 <0.001 <0.001 QUICKI 0.330 (0.329–0.332) (0.326–0.330)0.328 (0.328–0.331)0.329 (0.331–0.334)0.332 <0.001 0.035 <0.001 <0.001 25(OH)D, 25-hydroxyvitamin D; CI, confidence interval; SDS, standard deviation score; SBP, systolic blood pressure; DBP, diastolic blood pressure; HDL cholesterol, high density lipoprotein cholesterol; BMI, body mass index; HOMA-IR, homeostasis model assessment of insulin resistance index; QUICKI, quantitative insulin sensitivity check index.
a)P-value was analyzed using analysis of variance and trend analyses. b)P-value was analyzed using analysis of covariance and trend analyses with adjustments for sex and age.
Holick et al.19) divided children into 3 group according to serum 25(OH)D concentrations; deficiency (less than 20 ng/ mL), insufficiency (21–29 ng/mL), sufficiency (more than 30 ng/mL). Most of subjects belonging to I–III quartile group were vitamin D deficiency, and most of subjects in the IV quartile group were insufficiency. Vitamin D sufficiency was only 3.1% and this result is consistent with other research20).
In the comparison of two group, the number of subjects with metabolic syndrome was greater in the low 25(OH)D groups (I, II, and III quartile) than in the high 25(OH)D group (IV quartile). In addition, BMI and WC were significantly lower in the IV quartile group. These results suggest low serum vitamin D concentration is a risk factor of obesity and metabolic syndrome.
Some studies have investigated the correlation between serum 25(OH)D concentration and insulin sensitivity24,25). Vitamin D has been shown to enhance insulin sensitivity directly by stimulating insulin receptor expression and insulin responsiveness for glucose transport26). Also, vitamin D has an indirect effect by regulating extracellular calcium concentration
and influx through cell membranes, because calcium is essential for mediated intracellular processes in insulin-responsive tissue27). Consistent with this study, our data shows a significant association with two types of insulin sensitivity index and serum 25(OH)D. Since insulin resistance is a key mechanism of metabolic syndrome, the result that low vitamin D has been correlated with increase of insulin resistance is a conclusive evidence to support vitamin D deficiency is a risk factor of metabolic syndrome.
Our data also showed that age was negatively correlated with the serum 25(OH)D level. Few studies have reported an association between serum 25(OH)D and age. Kim et al.28) reported that senior high school students exhibit a high proportion of vitamin D deficiency compared with elementary school children. Another study reported that adolescents possess low vitamin D levels compared with young children29). One possible cause is that most Korean middle and high school students spend the majority of the daylight hours in school and private institutes without exercise and outdoor physical activity. In such environments, adolescents could not receive enough
Table 3. Comparison of factors of metabolic syndrome, anthropometric indices, and insulin sensitivity index between serum 25(OH)D quartile I–III groups and quartile IV group
Variable Serum 25(OH)D concentration (ng/mL) P-value
Quartile I–III (<20.86) Quartile IV (≥20.86)
No. of subjects (total=2,880) 2,160 720
Male sex 1,087 (50.3) 450 (62.5) <0.001 Age (yr) 14.04±2.45 12.82±2.36 <0.001 SBP (mmHg) 104.03±10.53 102.05±9.98 <0.001 DBP (mmHg) 65.11±8.86 62.40±8.92 <0.001 Waist circumference (cm) 69.51±9.92 67.52±9.07 <0.001 Fasting glucose (mg/dL) 89.17±6.56 89.93±6.51 0.007 HDL cholesterol (mg/dL) 49.21±9.22 49.78±9.11 0.145 Triglycerides (mg/dL) 87.67±58.48 85.54±52.23 0.384 BMI (kg/m2) 20.67±3.64 19.82±3.28 <0.001 BMI SDS 0.022±1.099 –0.067±1.021 0.057 Weight (kg) 54.46±13.87 49.45±12.86 <0.001 Weight SDS 0.205±1.080 0.118±1.020 0.057 Height (cm) 161.3±11.2 156.8±12.2 <0.001 Height SDS 0.440±1.034 0.403±1.032 0.414 HOMA-IR 3.08±1.80 2.88±1.71 0.010 QUICKI 0.329±0.198 0.332±0.020 <0.001 Metabolic syndrome 123 (5.7) 26 (3.6) 0.029
P-value was calculated as a comparison between quartile I–III groups and quartile IV group.
Values are presented as number (%) or mean±standard deviation.
25(OH)D, 25-hydroxyvitamin D; SBP, systolic blood pressure; DBP, diastolic blood pressure; SDS, standard deviation score; HDL cholesterol, high density lipoprotein cholesterol; BMI, body mass index; HOMA-IR, homeostasis model assessment of insulin resistance index; QUICKI, quantitative insulin sensitivity check index.
Table 4. Partial correlation between serum 25(OH)D and insulin sensitivity index
Variable ρa) (95% CI) P-value ρb) (95% CI) P-value
HOMA-IR –0.047 (–0.083 to –0.011) 0.012 –0.073 (–0.103 to –0.039) <0.001
QUICKI 0.055 (0.019–0.091) 0.003 0.095 (0.056–0.132) <0.001
25(OH)D, 25-hydroxyvitamin D; CI, confidence interval; HOMA-IR, homeostasis model assessment of insulin resistance index; QUICKI, quantitative insulin sensitivity check index; BMI, body mass index; SDS, standard deviation score.
sunlight to synthesize vitamin D. Increased use of sunscreen and consumption of less than the recommended levels of vitamin D in adolescents are also thought to be causes for lower serum 25(OH)D levels in high school students28).
This study has some limitations. First, causality could not be determined because this study was cross-sectional design. Second, other factors that affect serum vitamin D level were not evaluated in this study, including dietary vitamin D, calcium intake, and outdoor physical activity time, parathyroid hormone, which plays an important role in calcium homeostasis and serum vitamin D level. Third, age- and sex-related factors, such as lifestyle and diet, were not adjusted even though we adjusted age and sex in the statistics. Such confounding factors may affect the result that individuals in the first quartile of 25(OH)D presented lower BMI SDS, weight SDS, and incidence of metabolic syndrome than those in the second quartile. To confirm the effect of vitamin D status on metabolic syndrome, especially in children and adolescents, a well-designed longitudinal study is needed after adjusting for controllable factors.
In summary, our study demonstrates that low serum 25(OH) D level is associated with an increase of insulin resistance and metabolic syndrome in children and adolescents. Additional well designed longitudinal research is needed to reveal long term effect and causality between vitamin D status and metabolic syndrome.
Conflict of interest
No potential conflict of interest relevant to this article was reported.
Acknowledgments
The authors thank Mi Kyung Song for her statistical analysis. This study was supported by a faculty research grant of Yonsei University College of Medicine for 2014(6-2014-0019).
References
1. Holick MF. Vitamin D deficiency. N Engl J Med 2007;357: 266-81.
2. Huh K, Woo MK, Yoon JR, Shim GH, Chey MJ, Park MJ. Clinical characteristics of vitamin D deficiency rickets in infants and preschool children. Korean J Pediatr 2010;53: 152-7.
3. Holick MF. Sunlight and vitamin D for bone health and prevention of autoimmune diseases, cancers, and cardiovas-cular disease. Am J Clin Nutr 2004;80(6 Suppl):1678S-1688S.
4. Wang C. Role of vitamin d in cardiometabolic diseases. J Diabetes Res 2013;2013:243934.
5. Baz-Hecht M, Goldfine AB. The impact of vitamin D deficiency on diabetes and cardiovascular risk. Curr Opin
Endocrinol Diabetes Obes 2010;17:113-9.
6. Sung CC, Liao MT, Lu KC, Wu CC. Role of vitamin D in insulin resistance. J Biomed Biotechnol 2012;2012:634195. 7. Weiss R, Dziura J, Burgert TS, Tamborlane WV, Taksali SE,
Yeckel CW, et al. Obesity and the metabolic syndrome in children and adolescents. N Engl J Med 2004;350:2362-74. 8. Eckel RH, Grundy SM, Zimmet PZ. The metabolic
syndrome. Lancet 2005;365:1415-28.
9. Steinberger J, Daniels SR; American Heart Association Atherosclerosis, Hypertension, and Obesity in the Young Committee (Council on Cardiovascular Disease in the Young); American Heart Association Diabetes Committee (Council on Nutrition, Physical Activity, and Metabolism). Obesity, insulin resistance, diabetes, and cardiovascular risk in children: an American Heart Association scientific statement from the Atherosclerosis, Hypertension, and Obesity in the Young Committee (Council on Cardiovascular Disease in the Young) and the Diabetes Committee (Council on Nutrition, Physical Activity, and Metabolism). Circulation 2003;107:1448-53.
10. Wortsman J, Matsuoka LY, Chen TC, Lu Z, Holick MF. Decreased bioavailability of vitamin D in obesity. Am J Clin Nutr 2000;72:690-3.
11. Martini LA, Wood RJ. Vitamin D status and the metabolic syndrome. Nutr Rev 2006;64:479-86.
12. Gordon CM, DePeter KC, Feldman HA, Grace E, Emans SJ. Prevalence of vitamin D deficiency among healthy adolescents. Arch Pediatr Adolesc Med 2004;158:531-7. 13. Baradaran A, Behradmanesh S, Nasri H. Association of
body mass index and serum vitamin D level in healthy Iranian adolescents. Endokrynol Pol 2012;63:29-33. 14. Matthews DR, Hosker JP, Rudenski AS, Naylor BA, Treacher
DF, Turner RC. Homeostasis model assessment: insulin resistance and beta-cell function from fasting plasma glucose and insulin concentrations in man. Diabetologia 1985;28:412-9.
15. Muniyappa R, Lee S, Chen H, Quon MJ. Current approa-ches for assessing insulin sensitivity and resistance in vivo: advantages, limitations, and appropriate usage. Am J Physiol Endocrinol Metab 2008;294:E15-26.
16. Cook S, Weitzman M, Auinger P, Nguyen M, Dietz WH. Prevalence of a metabolic syndrome phenotype in adole-scents: findings from the third National Health and Nutrition Examination Survey, 1988-1994. Arch Pediatr Adolesc Med 2003;157:821-7.
17. Vaccaro O, Riccardi G. Changing the definition of impaired fasting glucose: impact on the classification of individuals and risk definition. Diabetes Care 2005;28:1786-8.
18. Moon JS, Lee SY, Nam CM, Choi JM, Choe BK, Seo JW, et al. 2007 Korean National Growth Charts: review of developmental process and an outlook. Korean J Pediatr 2008;51:1-25.
19. Holick MF, Binkley NC, Bischoff-Ferrari HA, Gordon CM, Hanley DA, Heaney RP, et al. Evaluation, treatment, and prevention of vitamin D deficiency: an Endocrine
Society clinical practice guideline. J Clin Endocrinol Metab 2011;96:1911-30.
20. Lee SH, Kim SM, Park HS, Choi KM, Cho GJ, Ko BJ, et al. Serum 25-hydroxyvitamin D levels, obesity and the metabolic syndrome among Korean children. Nutr Metab Cardiovasc Dis 2013;23:785-91.
21. Reis JP, von Muhlen D, Miller ER 3rd, Michos ED, Appel LJ. Vitamin D status and cardiometabolic risk factors in the United States adolescent population. Pediatrics 2009;124:e371-9.
22. Ogden CL, Carroll MD, Kit BK, Flegal KM. Prevalence of obesity in the United States, 2009-2010. Atlanta, GA: US Department of Health and Human Services, Centers for Disease Control and Prevention, National Center for Health Statistics, 2012.
23. Kang JH, Kim SS, Moon SS, Kim WJ, Bae MJ, Choi BG, et al. Adiposity in the relationship between serum vitamin D level and insulin resistance in middle-aged and elderly Korean adults: The Korea National Health and Nutrition Examination Survey 2008. Endocrinol Metab (Seoul) 2013;28:96-102.
24. Kelly A, Brooks LJ, Dougherty S, Carlow DC, Zemel BS. A cross-sectional study of vitamin D and insulin resistance in children. Arch Dis Child 2011;96:447-52.
25. Chiu KC, Chu A, Go VL, Saad MF. Hypovitaminosis D is associated with insulin resistance and beta cell dysfunction. Am J Clin Nutr 2004;79:820-5.
26. Maestro B, Campion J, Davila N, Calle C. Stimulation by 1,25-dihydroxyvitamin D3 of insulin receptor expression and insulin responsiveness for glucose transport in U-937 human promonocytic cells. Endocr J 2000;47:383-91. 27. Pittas AG, Lau J, Hu FB, Dawson-Hughes B. The role of
vitamin D and calcium in type 2 diabetes. A systematic review and meta-analysis. J Clin Endocrinol Metab 2007; 92:2017-29.
28. Kim SH, Oh MK, Namgung R, Park MJ. Prevalence of 25-hydroxyvitamin D deficiency in Korean adolescents: association with age, season and parental vitamin D status. Public Health Nutr 2014;17:122-30.
29. Cashman KD. Vitamin D in childhood and adolescence. Postgrad Med J 2007;83:230-5.