한국정밀공학회 2013 년도 춘계학술대회논문집
1. 서론
반도체 및 미세소자 Device 들은 수백 단계 의 제조 공정을 거쳐 생산 되어지며, 각 단계 별 다수의 관리 대상 Output Parameter 가 주어 진다. 이 Output Parameter 의 Big Shift 현상을 효과적으로 Monitoring 하고 제어하기 위해 당사는 Shewhart 관리도를 채택하여 사용하고 있다. 그러나 반도체 공정에서는 Material 열화 에 따른 시계열적 Output 의 미세변동이 발생 하는 특성이 있으며(Fig. 1), 전통적 3Sigma Shewhart 관리도로는 검출이 불가하였다. 본 논 문에서는 미세변동에 대한 감지력 향상을 목적 으로 EWMA (Exponentially Weighted Moving Average) 로직을 적용하여 유효성을 검토하였 고, Logic 최적화를 통해 가성 Interlock 개선 사례를 소개하고자 한다. 1. 본론 2.1 EWMA 관리도의 해석 Shewhart 관리도는 공정에 이상이 없는 경 우 α Risk(False alram 발생 확률) 가 0.0027 로
Fig. 1 Variation of measured data according to the cumulative usage time of the material
매우 작아 안정적이고, Data 의 큰 Shift 발생을 재빨리 감지 한다. 그러나 현재의 Data 만을 고려하므로 Time Dependent Small Shift 는 검출 이 불가하다. 반면, EWMA 관리도는 식 (1) 과 같이 과거 시계열 Data 모두를 감안하며, 정 의된 Tatget 으로부터의 차이를 감지한다.
Zi = λyi + (1-λ)Zi-1 (1) Where, I = time index , yi = i 번째 실 data 값
Z0 = center line 평균, λ = 가중치 상수
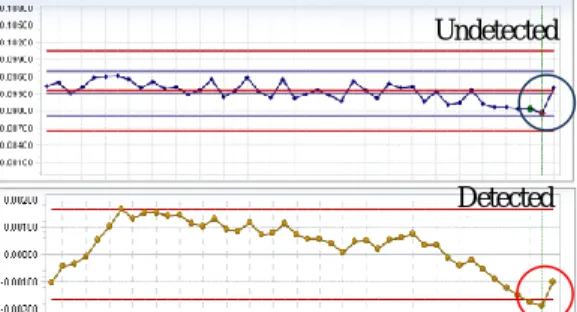
2.2 EWMA 관리도의 적용 및 유효성 검증 우리는 반도체 공정에서 EWMA 관리도 적 용시 유효성을 확인하고자 TEST 를 진행 하였 다. TEST 결과 Fig. 2 의 Upper Chart 같이 기존 에 검출 불가했던 미세변동이 EWMA 적용 후 Lower Chart 와 같이 효과적으로 검출되었다.
Fig. 2 Existing SPC Chart(Upper Chart) & Optimized EWMA Chart(Lower Chart)
EWMA 관리도 최적화를 통한 반도체 제조 공정의 설비
미세변동 감지력 향상에 관련 연구
A case study regarding improving fine variation detecting rate of
the machine through optimizing EWMA control charts in
semiconductor manufacturing process
*#김민철1, 변권현2, 김종규2
*#M. C. Kim1([email protected]), K. H. Byun2 , J. K. Kim2
1
삼성전자 공과대학 반도체 공학과, 2삼성전자 DS 부문 메모리 사업부
Key words : Exponentially Weighted Moving Average, Shewhart chart, Semiconductor
Undetected
Detected d
한국정밀공학회 2013 년도 춘계학술대회논문집 2.3 EWMA 관리도의 최적화 우리는 앞절에서 Material 의 열화에 따른 미세변동 검출에 있어 EWMA 가 보다 효과적 으로 검출함을 확인하였다. 추가로 다음과 같이 나타나는 가성 Data 에 대해 최적화를 진행 하였다.
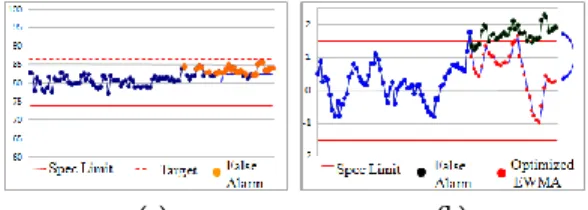
첫째, Fig 3-a 와 같이 Data 가 Target 근처에 서 작은 거동을 일으켜 발생되는 Interlock 은 불필요하다. 이를 개선하고자 Target 의 단방향 폭의 12.5% 까지를 Target Zone 으로 정의 하였다. 그리고 최근 9Point 값의 평균이 Target Zone 을 벗어나지 않을 경우 Interlock 에서 제외하도 록 식 (2) 와 같이 구현하였다. 적용 결과를 Fig 3-b 에 나타내었으며, 가성 Interlock 이 효과적으로 제거 되었다. If [Z(t)>UCL or Z(t)<LCL]
if TZ=9 then P_avg=avg (recent 9points) if [X(t)>Target + Tⅹ(USL-Target) or (2) X(t)<Target- Tⅹ(Target-LSL)]
Then “Interlock” else “Alarm” Where,
T(Allowance) : One-way width of the Target Zone TZ : The number of the points within the Target
Zone during the recent 9 points
(a) (b)
Fig. 3 Example of the False Alram(Left Chart) & Optimized Chart(Right Chart)
둘째, Fig 4-a 와 같이 Data 가 Target 에 수렴 하는 방향으로 변동하는 경우에도 Interlock 에서 제외할 필요가 있다. 이를 위해 최근 6point 중 Target 으로 수렴하는 Point 수를 이용하여 식(3) 과 같이 구현하였다. 적용 결과 를 Fig 4-b 에 나타내었으며, 가성 Interlock 이 효과적으로 제거 되었다.
If [Z(t)>UCL or Z(t)<LCL]
if TC=6 then P_avg=avg(last 6points)
if [(X(t)-Target) ⅹ Z(t) > 0] (3) then “Interlock” else “Alarm”
Where,
TC : The number of the convergent towards Target
(a) (b) Fig. 4 Example of the False Alram(Left Chart) & Optimized Chart(Right Chart)
4. 결론 우리는 반도체 공정에서의 미세변경 검출 력을 높이기 위해 EWMA 를 도입하였고, Logic 의 최적화를 통해 불필요한 가성 Interlock 을 개선한 사례를 소개 하였다. 이로써 고질 SPC Interlock 의 39% 가 감소함을 확인 할 수 있었 다. 검출력 유효성을 볼 때 본 공정과 유사한 공정에 대하여 확대 적용할 수 있다. 참고문헌
1. J.Stuart Hunter, “The Exponentially Weighted Moving Average,” Journal of Quality Technology, 1986.
2. J. M. Lucas and M. S. Saccucci, “EWMA Control Schemes:Properties and Enhancements,” Techno
metrics, 1990.
3. Nien Fan Zhang, “Astatistical control chart for stationary process data,” Technometrics, 1998. 4. Douglas C. Montgomery, “Introduction to
Statistical Quality Control,” 5th edition, WILEY.