R E S E A R C H A R T I C L E
Open Access
Discovering transnosological molecular basis of
human brain diseases using biclustering analysis
of integrated gene expression data
Kihoon Cha
1, Taeho Hwang
2, Kimin Oh
1, Gwan-Su Yi
1*From ACM Eighth International Workshop on Data and Text Mining in Biomedical Informatics
Shanghai, China. 7 November 2014
Abstract
Background: It has been reported that several brain diseases can be treated as transnosological manner
implicating possible common molecular basis under those diseases. However, molecular level commonality among those brain diseases has been largely unexplored. Gene expression analyses of human brain have been used to find genes associated with brain diseases but most of those studies were restricted either to an individual disease or to a couple of diseases. In addition, identifying significant genes in such brain diseases mostly failed when it used typical methods depending on differentially expressed genes.
Results: In this study, we used a correlation-based biclustering approach to find coexpressed gene sets in five neurodegenerative diseases and three psychiatric disorders. By using biclustering analysis, we could efficiently and fairly identified various gene sets expressed specifically in both single and multiple brain diseases. We could find 4,307 gene sets correlatively expressed in multiple brain diseases and 3,409 gene sets exclusively specified in individual brain diseases. The function enrichment analysis of those gene sets showed many new possible functional bases as well as neurological processes that are common or specific for those eight diseases.
Conclusions: This study introduces possible common molecular bases for several brain diseases, which open the opportunity to clarify the transnosological perspective assumed in brain diseases. It also showed the advantages of correlation-based biclustering analysis and accompanying function enrichment analysis for gene expression data in this type of investigation.
Background
It has been shown that various neurodegenerative dis-eases and even psychiatric disorders have a large extent of similarity in terms of neurological dysfunction [1]. In clinical practices in these diseases, transnosologically oriented treatments are often used based on the assump-tion of this similarity. Therefore, it seems important to find common molecular mechanisms of transnosological aspect of neurological diseases as well as the unique char-acteristics of individual diseases. The similarity among some representative brain diseases has been observed
and summarized at the phenotypic level. However, the molecular level commonality is yet largely uncharacter-ized due to the lack of the application of currently devel-oped method appropriate for this type of investigation.
Transcriptome analysis have been suggested for com-prehensive gene level interpretation of many diseases. Transcriptome data is also one of the most available resources for human brain study. Various methods for transcriptome analysis have been developed for identifi-cation of differentially expressed genes, correlated genes, and significant functional modules [2-7]. There have been several transcriptome analyses of human brain dis-eases using microarray [8]. Most of the previous studies focused on identifying differentially expressed genes under various neurodegenerative diseases such as
* Correspondence: [email protected]
1
Department of Bio and Brain Engineering, KAIST, Daejeon 305-701, South Korea
Full list of author information is available at the end of the article
© 2015 Cha et al.; licensee BioMed Central Ltd. This is an Open Access article distributed under the terms of the Creative Commons Attribution License (http://creativecommons.org/licenses/by/4.0), which permits unrestricted use, distribution, and reproduction in any medium, provided the original work is properly cited. The Creative Commons Public Domain Dedication waiver (http:// creativecommons.org/publicdomain/zero/1.0/) applies to the data made available in this article, unless otherwise stated.
Alzheimer’s disease [9-11]. Though they suggested sets of individual molecular players associated with brain dis-ease etiology, it has been recommended to investigate system-level transcriptomic changes by identifying gene sets that show coexpression under either brain disease or normal condition in order to get more comprehensive understanding on highly complex brain diseases [8,12]. Those previous approaches were, however, restricted to individual brain diseases so that identification of molecu-lar basis common to multiple brain diseases was difficult. Integrative analysis uses an integrated data of multiple microarray datasets via adjusting batch effects, or sys-tematic difference between datasets, which is promising approach to identify robust molecular basis associated to multiple brain diseases. In addition, biclustering analysis is a good candidate for searching coexpressed gene sets under specific subset of samples. Given that there are many brain diseases to be simultaneously investigated and it is unclear which brain disease combinations would have common molecular basis, a biclustering analysis is expected to provide efficient method to identify common coexpressed gene sets under various combinations of brain diseases. Both integrative approach and biclustering analysis showed its utility in studies of other transcrip-tome data for complex diseases such as cancers [13,14] but there have not been applied to investigate brain tran-scriptome data.
To this end, we used an integrative approach on three microarray datasets covering five neurodegenerative dis-eases, three psychiatric disorders and normal conditions to identify common molecular basis of various brain dis-ease combinations in a transnosological manner. Using a biclustering analysis and post-processing, we efficiently identified large number of gene sets that gained or lost correlation under all or specific combinations of brain diseases compared to the normal conditions. Large por-tion of those common gene sets were enriched for genes having known association with brain diseases, implicating system-level change of transcriptional organization to the multiple brain diseases. A function enrichment analysis on the identified gene sets showed that the common coexpressed gene sets were more enriched for the biolo-gical processes associated with neurolobiolo-gical processes compared to individual single disease-specific gene sets, indicating that they might serve as good starting points in studies discovering key targets of drug intervention of transnosological aspect.
Results
Identification of brain disease-specific coexpressed gene sets
We aimed to identify coexpressed gene sets either in brain diseases or in normal to find molecular mechan-isms potentially associated with brain diseases. Especially,
we focused on finding molecular mechanisms common to multiple brain diseases. We chose five neurodegenera-tive and three psychiatric disorders, covering Alzheimer’s disease, Parkinson’s disease, Huntington’s disease, multi-ple sclerosis, amyotrophic lateral sclerosis, schizophrenia, bipolar disorder, and autism along with controls. For an integrative gene expression analysis, we combined three microarray datasets into a single dataset by adjusting batch-specific effects using ComBat method [15]. As a result, we could get a microarray dataset with 6688 dis-tinct genes and 237 samples. We applied the biclustering method to the combined microarray dataset to efficiently get initial sets of biclusters in which at least genes show correlated expression values under arbitrary subset of samples with average Pearson’s correlation coefficients (PCC) equal or greater than 0.7 in a transnosological manner. We chose 0.7 as the threshold based on our empirical simulation result that the probability that an arbitrarily composed bicluster has average PCC equal or greater than 0.7 is statistically significantly rare (P = 1E-04). We selected only those biclusters containing all sam-ples from one or more of classes (e.g. all samsam-ples from multiple sclerosis class and all samples from Alzheimer’s disease class). We eliminated samples from each of the selected biclusters if the samples are just part of certain class. With the refined biclusters, we next determined whether the gene coexpression is substantially gained or lost in brain diseases compared to normal. For this pro-cess, we separately calculated average PCC of the genes included in each refined bicluster in included brain dis-eases and in normal, and got the difference in the average PCCs. We assigned p-values to the difference by using background distribution of difference of average PCCs between brain diseases and normal from 100,000 random gene groups. We finally identified coexpressed gene sets showing statistically significant gain or loss of coexpres-sion in brain.
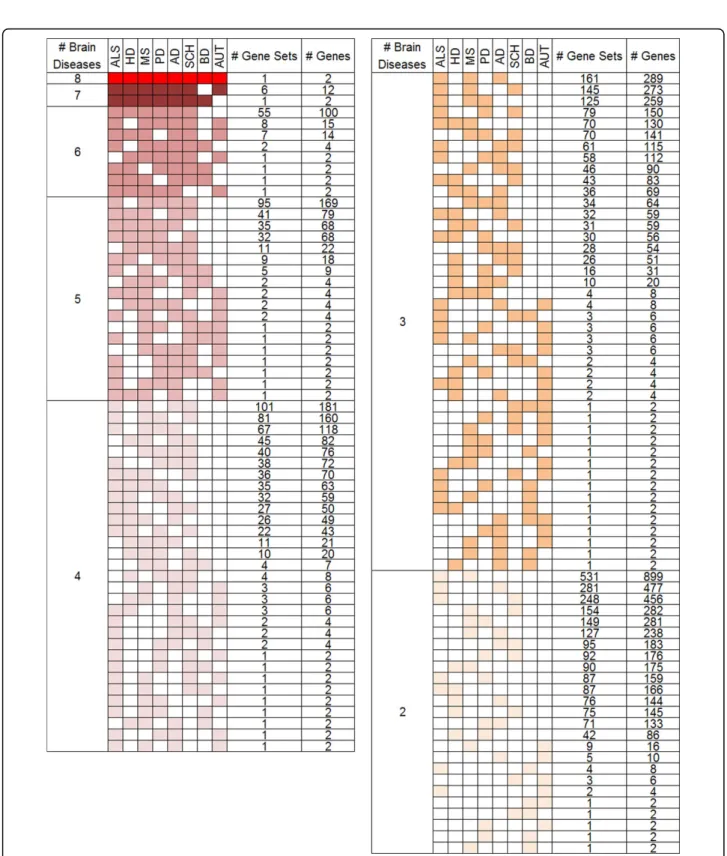
A total of 4,307 gene sets were identified to be coex-pressed in at least two brain diseases, implying that there might be large number of molecular mechanisms com-monly associated to multiple brain diseases with Benjamini corrected p-value of 0.005. Given that the number of coex-pressed gene sets specific to individual brain diseases is 3,409, our finding supports the hypothesis that there are huge similarity between the investigated brain diseases at molecular level for the first time. The numbers of shared coexpressed sets show degree of association among differ-ent combinations of brain diseases in Figure 1. We found the similarity group among brain diseases by the number of total coexpressed gene sets between all possible combi-nations of two brain diseases. ALS and MS is the most similar disease with 1,684 coexpression gene sets. Other brain diseases are listed with AD, SCH, PD, HD, AUT, and BD in the order of the number of shared gene sets. This
result shows shared mechanism of molecular level among neurodegenerative diseases. Particularly, SCH, classified by psychiatric disorder, highly correlated with neurodegenera-tive disease.
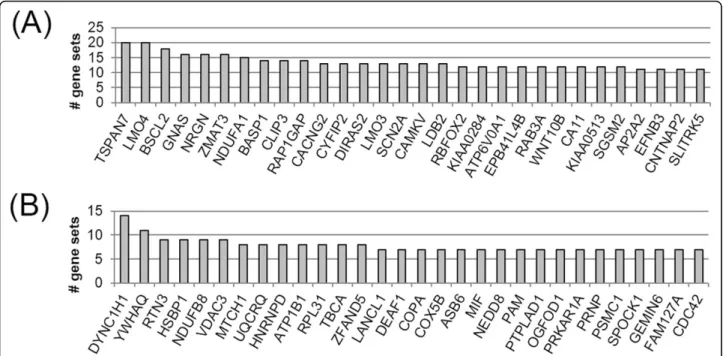
Figure 2 shows two types of top 30 genes in gene sets of single brain disease and at least two brain diseases. To discover the biological meaning and functions of each gene set from single and multiple brain disease,
function enrichment analysis of each gene list was performed using DAVID. As the results, the fourteen genes (RTN3, LANCL1, YWHAQ, COX5B, DYNC1H1, HNRNPD, MIF, NEDD8, PRKAR1A, PSMC1, RPL31, TBCA, VDAC3, and CDC42) in gene sets of one brain disease were significantly enriched only ‘acetylation’ term of SwissProt PIR Keyword with Benjamini cor-rected p-value of 0.006. The three genes (AP2A2, CACNG2, and RAB3A) in gene sets of at least two brain diseases were significantly enriched ‘synaptic transmission’ term of Reactome pathway with Benjamini corrected p-value of 0.022. This result shows that fre-quently found genes in gene sets sharing brain diseases are different from genes of only one brain disease in terms of cellular function. In particular, frequently observed genes in gene sets sharing multiple brain dis-eases are distributed the important pathway of neurolo-gical processes.
Coexpressed gene sets across multiple brain diseases are enriched for known disease-associated genes
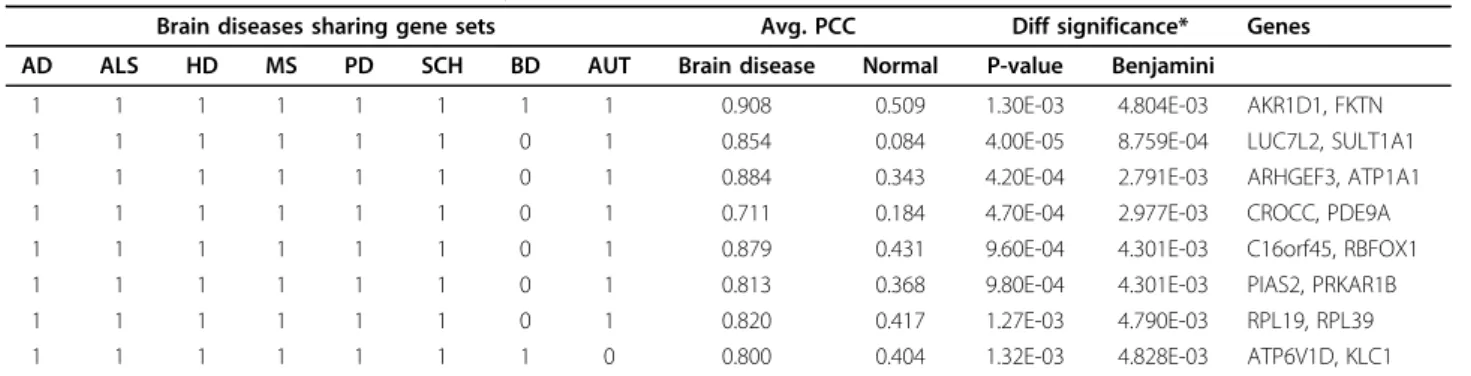
We could find 1 and 7 coexpressed gene sets shared by all and 7 different brain diseases, respectively in Table 1. To find association between the genes in 8 coexpressed sets and brain diseases, we checked genes in coex-pressed gene sets with known brain disease-associated genes by directly and first-order interacting proteins. First, we collected brain disease-associated genes using public available disease databases. The collected 2,697 genes comprising 1,310 for AD, 985 for SCH, 534 for
MS, 517 for BD, 352 for PD, 186 for AUT and 44 for HD are used. Second, we used our comprehensive pro-tein interaction database, ComBiCom [16], to find nonre-dundant protein interaction relationships. As the result, the three genes (ATP1A1 for BD, RBFOX1 for BD, and KLC1 for AD and PD) are directly related to brain dis-eases. Moreover, 10 genes (ATP1A1, ATP6V1D, C16orf45, CROCC, KLC1, LUC7L2, PIAS2, PRKAR1B, RBFOX1, and RPL19) interacts with at least one brain disease-associated gene. Our approach offers the poten-tial to discovery more reliable and accurate drug targets covering multiple brain diseases with shared molecular mechanisms. These genes are also associated with brain function, biological process or pathway, such as hormone synthesis, metabolic pathway, cell death, synaptic vesicle cycle, and nervous system development.
Functional characteristics of coexpressed gene sets shared by multiple brain diseases
As we observed previously, there might be functional dif-ference between the single brain disease-specific gene sets and shared gene sets. We further investigated the functional characteristics of the 4,299 shared gene sets in comparison with the 3,409 disease-specific gene sets. For this, we carried out a function enrichment analysis for each shared gene sets and single disease-specific gene sets using the Gene Ontology (GO) biological process at Benjamini corrected p-value of 0.01. We assigned each gene sets to one or more of the representative biological processes according to the enriched biological processes
Figure 2 Top 30 genes most frequently found in the coexpressed gene sets. (A) Gene sets shared by at least two brain diseases and (B) single brain disease-specific gene sets.
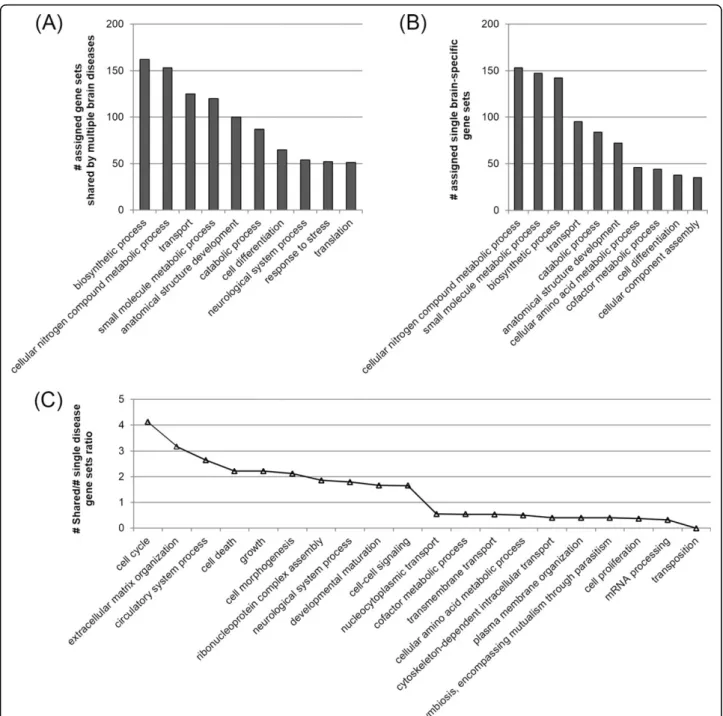
to identify the functional categories that are relatively overrepresented by the multiple brain disease gene sets compared to the single disease-specific gene sets. For fair comparison, we normalized the number of assigned gene sets by dividing the number of identified gene sets in each functional category by the total number of identified gene sets. Figure 3A and Figure 3B shows 10 functional categories of the highest counts in multiple brain disease-specific and single brain disease-disease-specific gene sets. In Figure 3C, we only showed 20 functional categories showing the highest and the lowest fold. While the single brain disease-specific gene sets were more frequently enriched for the metabolic processes, the functional cate-gories such as“cell cycle”, “neurological system process” and“cell-cell signaling” had nearly 2-fold greater repre-sentation among the shared gene sets. This is notable since the category“neurological system process” involves a wide variety of biological processes that directly regu-late or at least substantially affect neurological processes at the phenotypic level. The overrepresentation of“cell morphogenesis”, “cell death”, “developmental matura-tion”, and “cell-cell signaling”, indicates that the shared gene sets are more likely to have implications for brain cell development and degradation, and neuron-to-neuron or glia-to-neuron interaction, respectively. Taken together, our data suggests that the shared molecular bases among multiple brain diseases are more enriched in the functional categories that are associated with neurological function. This might reflect the fact that the multiple brain diseases in our study have great similarity in terms of neurological deficit even though the pathology or other symptoms vary greatly from disease to disease. Thus, identifying the shared gene sets rather than sing disease-specific gene sets might increase the chances of discovering more extensive and plausible molecular bases that are tightly associated with neurological impairment.
Conclusions
We carried out an integrative biclustering analysis of tran-scriptome data from multiple diseases that are known to
similarly neurological dysfunction. We demonstrated large number of potential molecular bases shared among multi-ple brain diseases and revealed high extent of heterogene-ity among samples in a disease, which collectively emphasize the benefits of our analysis for the identification of the novel molecular mechanisms underlying multiple brain diseases in a transnosological manner. Our analysis showed that the number of gene sets in multiple brain disease is substantially larger than that of single disease-specific gene sets, and that the shared gene sets are more likely to be associated with the pronounced biological pro-cesses underlying cognition. The results provide new type of information on the specific relationships among genes, gene sets, and combinations of brain diseases, which form a complex network that covers several known facts and suggests previously unknown relationships and character-istics. This study can be used as a promising strategy that efficiently maximize utilization of currently limited human brain transcriptome data for the extensive identification of potentially valuable molecular basis for neurological dys-function commonly in multiple brain diseases.
Methods
Collection of microarray data
Microarray data were derived from the NCBI GEO web site by keyword search using the names of the neurode-generative and psychiatric disorders. Since we are inter-ested in brain mechanisms, we focused only on the microarray data produced using postmortem human brain samples and tried to minimize the number of microarray data to be combined while trying to maximize the number of brain diseases. We selected 3 sets of microarray data: GSE26927, GSE5388, and GSE28521. The set GSE26927 included 11 samples with Alzheimer’s disease, 10 samples with amyotrophic lateral sclerosis, 10 samples with Huntington’s disease, 10 samples multiple sclerosis, 12 samples with Parkinson’s disease, 10 samples with schizophrenia, and 55 control samples extracted from the entorhinal cortex; this dataset is based on the Illumina humanRef-8 v2.0 expression beadchip. The
Table 1. Coexpressed gene sets shared by more than 7 brain diseases
Brain diseases sharing gene sets Avg. PCC Diff significance* Genes AD ALS HD MS PD SCH BD AUT Brain disease Normal P-value Benjamini
1 1 1 1 1 1 1 1 0.908 0.509 1.30E-03 4.804E-03 AKR1D1, FKTN 1 1 1 1 1 1 0 1 0.854 0.084 4.00E-05 8.759E-04 LUC7L2, SULT1A1 1 1 1 1 1 1 0 1 0.884 0.343 4.20E-04 2.791E-03 ARHGEF3, ATP1A1 1 1 1 1 1 1 0 1 0.711 0.184 4.70E-04 2.977E-03 CROCC, PDE9A 1 1 1 1 1 1 0 1 0.879 0.431 9.60E-04 4.301E-03 C16orf45, RBFOX1 1 1 1 1 1 1 0 1 0.813 0.368 9.80E-04 4.301E-03 PIAS2, PRKAR1B 1 1 1 1 1 1 0 1 0.820 0.417 1.27E-03 4.790E-03 RPL19, RPL39 1 1 1 1 1 1 1 0 0.800 0.404 1.32E-03 4.828E-03 ATP6V1D, KLC1
* Diff. significance: Statistical significance of the avg. PCC brain disease - avg. PCC normal empirically calculated based on the background distribution of 100,000 random gene groups.
GSE5388 dataset included 30 samples with bipolar disor-der and 31 control samples of the dorsolateral prefrontal cortex measured on the Affymetrix Human Genome U133A Array (Affymetrix Santa Clara, CA) [17]. Lastly, the GSE28521 data was for 29 autism patients and 29 controls and was based on the Illumina HumanRef-8 v3.0 expression beadchip [12]. We parsed the SOFT formatted files of 3 sets of microarray data using the GEOquery R package [18].
Combining microarray data
We transformed the GSE28521 data by inverting the log2-transformed expression data using the exponential function. Then, we applied quantile normalization to each of the 3 selected sets of microarray data using the functionalities in the limma R package [19]. Because all the selected microarray data have different platforms, we converted the probe IDs into Entrez Gene IDs using the biomaRt R package for the GSE5388 dataset and the
Figure 3 Functional distribution of the shared gene sets and the single brain disease-specific gene sets. The x-axis shows the representative functional categories (biological processes) selected. (A)(B) The number of assigned gene sets shared by multiple brain disease and single brain-specific gene sets in each functional category. (C) Ratio of the number of shared gene sets over single disease-specific gene sets
lumiHumanIDMapping R package for the GSE26927 and GSE28521 data sets in order to allow the different data-sets to possess a unified ID structure. After excluding probes whose expression values were missing in GSE28521, we identified probe IDs that were mapped to the same Entrez GeneIDs in each set of microarray data and collapsed their expression values by averaging them to make each microarray dataset contain non-redundant sets of genes. Then, we combined the 3 preprocessed sets of microarray data using ComBat [15], the batch effect adjusting method known to outperform other methods [20] implemented in the inSilicoMerging R package [21].
Identification of coexpressed gene sets
We used BICLIC, our recently developed biclustering method [5], to efficiently identify sets of genes that are correlated in individual or multiple combinations of non-normal (i.e. brain diseases) in an unsupervised manner. The BICLIC divides the clustering problem into indivi-dual sample clustering problems. In each sample, the ordered gene expression values were grouped into small sized clusters to efficiently identify initial seed biclusters by collecting samples in which clusters had the same genes. The seed biclusters had at least 2 genes and 3 sam-ples, in accordance with the minimum requirement for the normal calculation of the Pearson’s correlation coeffi-cient (PCC) as coexpression measurement. We expanded each seed bicluster in 2 ways by including genes and samples, while keeping the average PCC of the expanded bicluster that is higher than the designated correlation threshold, 0.7. We set the maximum number of genes in a bicluster at 50 in this analysis, but we did not set the maximum number of samples, in order to focus on the identification of molecular bases shared by as many brain diseases as possible. Once a seed bicluster is expanded in the gene direction and in the sample direction, separately, we can assume that this is a bicluster that contains all of the genes and samples needed to set a search space for identifying an optimal bicluster. Within the search space, we eliminated subsets of genes or samples until the aver-age PCC became larger than the correlation threshold for the first time, while maximizing the number of involved samples.
Function enrichment analysis
To identify functional meaning of discovered coex-pressed gene sets, we performed functional enrichment analysis by COFECO [22]. We selected the biological process of Gene Ontology terms with a corrected p-value of 0.005.
Collection of brain disease-associated genes
We collected disease-associated genes from six data-bases: OMIM (Online Mendelian Inheritance in Man),
Genetic Association Database [23], PharmGKB [24], KEGG DISEASE [25], and Huge Navigator [26]. Because the disease names vary among the source databases, we standardized the disease names by extracting the Unified Medical Language System (UMLS) [27] IDs using Meta-Map [28]. The UMLS IDs were converted once more into ICD-10-CM (International Classification of Dis-eases, 10th Revision, Clinical Modification) using the mapping information provided in the UMLS.
List of abbreviations
AD, Alzheimer’s disease; HD, Huntington’s disease; PD, Parkinson’s disease; ALS, amyotrophic lateral sclerosis; MS, multiple sclerosis; SCH, schizophrenia; BD, bipolar disorder; and AUT, autism.
Competing interests
The authors declare that they have no competing interests. Authors’ contributions
KC carried out the selection of microarray datasets, biclustering analysis, functional analysis, and drafted the manuscript. TH carried out the preprocessing and integration of microarray dataset. KO participated in the functional interpretations of coexpressed gene sets. GSY conceived of the study, participated in its design and coordination, functional interpretation, and drafted and reviewed the manuscript. All authors read and approved the final manuscript.
Acknowledgements
This work was supported by the Bio-Synergy Research Project (NRF-2012M3A9C4048759) of the Ministry of Science, ICT and Future Planning through the National Research Foundation, and the National Research Foundation of Korea (NRF) grant funded by the Korea government (MSIP) (No.2010-0028631)
Declaration
Publication costs for the article were sourced from the Bio-Synergy Research Project (NRF-2012M3A9C4048759) of the Ministry of Science and the National Research Foundation of Korea (NRF) grant funded by the Korea government (MSIP) (No.2010-0028631)
This article has been published as part of BMC Medical Informatics and Decision Making Volume 15 Supplement 1, 2015: Proceedings of the ACM Eighth International Workshop on Data and Text Mining in Biomedical Informatics. The full contents of the supplement are available online at http://www.biomedcentral.com/bmcmedinformdecismak/supplements/15/S1. Authors’ details
1
Department of Bio and Brain Engineering, KAIST, Daejeon 305-701, South Korea.2Department of Information and Communications Engineering, KAIST,
Daejeon 305-701, South Korea. Published: 20 May 2015 References
1. Millan MJ, Agid Y, Brune M, Bullmore ET, Carter CS, Clayton NS, Connor R, Davis S, Deakin B, DeRubeis RJ, et al: Cognitive dysfunction in psychiatric disorders: characteristics, causes and the quest for improved therapy. Nat Rev Drug Discov 2012, 11(2):141-168.
2. Kim KY, Kim BJ, Yi GS: Reuse of imputed data in microarray analysis increases imputation efficiency. BMC Bioinformatics 2004, 5:160. 3. Hwang T, Sun CH, Yun T, Yi GS: FiGS: a filter-based gene selection
workbench for microarray data. BMC Bioinformatics 2010, 11:50. 4. Yun T, Hwang T, Cha K, Yi GS: CLIC: clustering analysis of large microarray
datasets with individual dimension-based clustering. Nucleic acids research 2010, 38(Web Server):W246-253.
5. Yun T, Yi GS: Biclustering for the comprehensive search of correlated gene expression patterns using clustered seed expansion. BMC Genomics 2013, 14:144.
6. Subramanian A, Tamayo P, Mootha VK, Mukherjee S, Ebert BL, Gillette MA, Paulovich A, Pomeroy SL, Golub TR, Lander ES, et al: Gene set enrichment analysis: a knowledge-based approach for interpreting genome-wide expression profiles. Proceedings of the National Academy of Sciences of the United States of America 2005, 102(43):15545-15550.
7. Sun CH, Hwang T, Oh K, Yi GS: DynaMod: dynamic functional modularity analysis. Nucleic acids research 2010, 38(Web Server):W103-108. 8. Cooper-Knock J, Kirby J, Ferraiuolo L, Heath PR, Rattray M, Shaw PJ: Gene
expression profiling in human neurodegenerative disease. Nat Rev Neurol 2012, 8(9):518-530.
9. Duke DC, Moran LB, Kalaitzakis ME, Deprez M, Dexter DT, Pearce RK, Graeber MB: Transcriptome analysis reveals link between proteasomal and mitochondrial pathways in Parkinson’s disease. Neurogenetics 2006, 7(3):139-148.
10. Kudo LC, Parfenova L, Vi N, Lau K, Pomakian J, Valdmanis P, Rouleau GA, Vinters HV, Wiedau-Pazos M, Karsten SL: Integrative gene-tissue microarray-based approach for identification of human disease biomarkers: application to amyotrophic lateral sclerosis. Hum Mol Genet 2010, 19(16):3233-3253.
11. Simpson JE, Ince PG, Shaw PJ, Heath PR, Raman R, Garwood CJ,
Gelsthorpe C, Baxter L, Forster G, Matthews FE, et al: Microarray analysis of the astrocyte transcriptome in the aging brain: relationship to Alzheimer’s pathology and APOE genotype. Neurobiol Aging 2011, 32(10):1795-1807.
12. Voineagu I, Wang X, Johnston P, Lowe JK, Tian Y, Horvath S, Mill J, Cantor RM, Blencowe BJ, Geschwind DH: Transcriptomic analysis of autistic brain reveals convergent molecular pathology. Nature 2011, 474(7351):380-384.
13. Xu L, Tan AC, Winslow RL, Geman D: Merging microarray data from separate breast cancer studies provides a robust prognostic test. BMC Bioinformatics 2008, 9:125.
14. Dao P, Colak R, Salari R, Moser F, Davicioni E, Schonhuth A, Ester M: Inferring cancer subnetwork markers using density-constrained biclustering. Bioinformatics 2010, 26(18):i625-631.
15. Johnson WE, Li C, Rabinovic A: Adjusting batch effects in microarray expression data using empirical Bayes methods. Biostatistics 2007, 8(1):118-127.
16. Han Y, Sun CH, Kim MS, Yi GS: Combined Database System for Binary Protein Interaction and Co-complex Association. 2009, 538-542. 17. Ryan MM, Lockstone HE, Huffaker SJ, Wayland MT, Webster MJ, Bahn S:
Gene expression analysis of bipolar disorder reveals downregulation of the ubiquitin cycle and alterations in synaptic genes. Mol Psychiatry 2006, 11(10):965-978.
18. Davis S, Meltzer PS: GEOquery: a bridge between the Gene Expression Omnibus (GEO) and BioConductor. Bioinformatics 2007, 23(14):1846-1847. 19. Smyth GK: Limma: linear models for microarray data. In Bioinformatics and
Computational Biology Solutions using R and Bioconductor. New York: Spinger;Gentleman R, Carey V, Dudodit S, Irizarry R, Huber W 2005:397-420. 20. Chen C, Grennan K, Badner J, Zhang D, Gershon E, Jin L, Liu C: Removing
batch effects in analysis of expression microarray data: an evaluation of six batch adjustment methods. PLoS ONE 2011, 6(2):e17238.
21. Lazar C, Meganck S, Taminau J, Steenhoff D, Coletta A, Molter C, Weiss-Solis DY, Duque R, Bersini H, Nowe A: Batch effect removal methods for microarray gene expression data integration: a survey. Brief Bioinform 2012.
22. Sun CH, Kim MS, Han Y, Yi GS: COFECO: composite function annotation enriched by protein complex data. Nucleic acids research 2009, 37(Web Server):W350-355.
23. Becker KG, Barnes KC, Bright TJ, Wang SA: The genetic association database. Nature genetics 2004, 36(5):431-432.
24. Whirl-Carrillo M, McDonagh EM, Hebert JM, Gong L, Sangkuhl K, Thorn CF, Altman RB, Klein TE: Pharmacogenomics knowledge for personalized medicine. Clinical pharmacology and therapeutics 2012, 92(4):414-417. 25. Kanehisa M, Goto S, Furumichi M, Tanabe M, Hirakawa M: KEGG for
representation and analysis of molecular networks involving diseases and drugs. Nucleic acids research 2010, 38(Database):D355-360. 26. Yu W, Gwinn M, Clyne M, Yesupriya A, Khoury MJ: A navigator for human
genome epidemiology. Nature genetics 2008, 40(2):124-125. 27. Bodenreider O: The Unified Medical Language System (UMLS):
integrating biomedical terminology. Nucleic acids research 2004, 32(Database):D267-270.
28. Aronson AR, Lang FM: An overview of MetaMap: historical perspective and recent advances. Journal of the American Medical Informatics Association : JAMIA 2010, 17(3):229-236.
doi:10.1186/1472-6947-15-S1-S7
Cite this article as: Cha et al.: Discovering transnosological molecular basis of human brain diseases using biclustering analysis of integrated gene expression data. BMC Medical Informatics and Decision Making 2015 15(Suppl 1):S7.
Submit your next manuscript to BioMed Central and take full advantage of:
• Convenient online submission
• Thorough peer review
• No space constraints or color figure charges
• Immediate publication on acceptance
• Inclusion in PubMed, CAS, Scopus and Google Scholar
• Research which is freely available for redistribution
Submit your manuscript at www.biomedcentral.com/submit