DOI:
Original papers
DOI: 10.11152/mu-1138Motion effects on the measurement of stiffness on ultrasound shear
wave elastography: a moving liver fibrosis phantom study
Hyun Joo Shin
1, Myung-Joon Kim
1, Choon-Sik Yoon
2, Kwanseop Lee
3, Kwan Sik Lee
4,
Jong-Chul Park
5, Mi-Jung Lee
1, Haesung Yoon
11Department of Radiology and Research Institute of Radiological Science, Severance Children’s Hospital, Yonsei
University College of Medicine, 2Department of Radiology, Gangnam Severance Hospital, Yonsei University
Col-lege of Medicine, 3Department of Diagnostic Radiology, Hallym University Sacred Heart Hospital, Hallym
Univer-sity College of Medicine, 4Department of Gastroenterology and Hepatology, Gangnam Severance Hospital, Yonsei
University College of Medicine, 5Cellbiocontrol Laboratory, Department of Medical Engineering, Yonsei University
College of Medicine, Seoul, Korea
Received 14.06.2017 Accepted 17.09.2017 Med Ultrason
2018, Vol. 20, No 1, 14-20
Corresponding author: Myung-Joon Kim, MD, PhD
Department of Radiology and Research Institute of Radiological Science, Severance Children’s Hospital, Yonsei University College of Medicine 50-1Yonsei-ro, Seodaemun-gu,
Seoul 03722, Korea
Phone: 82-2-2228-7400, Fax: 82-2-393-3030 E-mail: [email protected]
Introduction
Ultrasound elastography is a widely used technique that measures the tissue stiffness in organs such as the liver, kidney, and spleen for various clinical condi-tions [1-4]. In addition, it is also used to evaluate tumor and to differentiate malignant from benign tumors using differences in cellular component and tissue stiffness
[5-7]. Ultrasound elastography has many benefits being noninvasive, simple to perform, and without risk of radi-ation exposure. However, measured values of ultrasound elastography can be affected by the type of machine or transducer chosen, the acquisition depth, and various clinical conditions of the patients themselves [8-10]. The motion of the patient is an important factor that influ-ences the ultrasound elastography examination results, especially for the abdominal organs [11,12]. Voluntary and especially involuntary motion, such as respiratory motion and cardiac or vascular pulsations, are more im-portant in pediatric patients, the respiratory or heart rates being normally higher in neonate and infants, compared to that of adults. For example, in the healthy pediatric population, the normal respiratory rate ranges from 30-60 breaths/min for infants, to 12-16 breaths/min for ado-lescents. In older patients or in patients with cardiac or
Abstract
Aims: To evaluate the differences between shear wave velocities (SWVs) measured with ultrasound elastography during
the continuous motion using liver fibrosis phantoms. Materials and methods: Elasticities were measured with convex and linear transducers of supersonic shear wave imaging (SSI) and acoustic radiation force impulse imaging (ARFI) using liver elasticity phantoms (3.0 and 16.9 kPa) at depths of 2, 3, 4, and 5 cm. Motion velocities were 30 and 60 rpm with the phantoms in an upright position on the Orbital shaker. To simulate different directional motion, the phantoms were laid on their side on the shaker. The values between moving and static status were compared, and the number of measurement failure was counted.
Results: In SSI, the convex transducer was less affected by motion at 30 rpm with the 3 kPa phantom. In the higher velocity
motion and in the higher stiffness phantom, most values from SSI were different comparing with static status, and there was a tendency for elasticity values to increase during movement. In ARFI, there were frequent measurement failures without stable results during the motion. Conclusions: Motion affected the measurement of elasticity differently in SSI and ARFI, according to the velocity, direction of the motion, and phantom stiffness. The convex transducer of SSI was less affected by motion in lower velocity motion and when using normal liver stiffness phantom.
respiratory diseases, difficulties in holding the breath during examination can contribute to limited utilization of the ultrasound elastography.
A recently published consensus recommended the breath-hold technique for ultrasound elastography exam-inations [13]. However, for infants and young children, and even sometimes for adults, it is usually not easy to maintain this recommendation during the examination. Therefore, to utilize the advantages of ultrasound elas-tography in these populations, it is essential to know how motion affects the measurement of shear wave velocities (SWVs). To our knowledge, only a few studies have been published which have focused on the effect of motion on the measurement of SWV [12,14,15]. However, most of the studies focused on the effects of specific breathing maneuvers after breath-holds but no study focused on the effect of continuous motion on two different ultrasound elastography techniques.
Therefore, the purpose of this study was to evaluate the effect of continuous motion on the measurement of SWV on ultrasound shear wave elastography (SWE) us-ing movus-ing liver fibrosis elastography phantoms.
Materials and methods Ultrasound SWE
To perform SWE, two different ultrasound machines with different techniques were used.
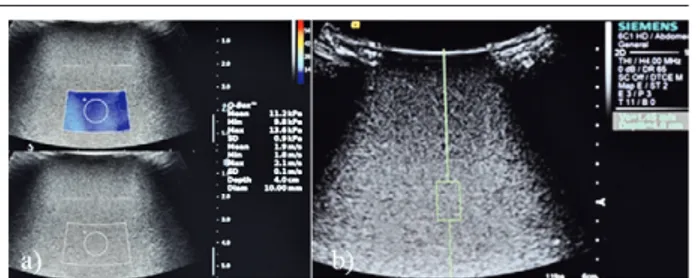
The first technique was supersonic shear wave im-aging (SSI, Aixplorer, SuperSonic Imagine, Aix-en-Provence, France) in which multiple acoustic radiation forces focusing at different depths in a large region-of-in-terest (ROI) generated a strong shear wave for measuring the stiffness quantitatively [10,16]. For SSI, 1-6 MHz low frequency convex and 2-10 MHz high frequency lin-ear transducers were used. SWVs were measured until 20 valid values were obtained, each at 2, 3, 4, and 5 cm depths and the median value was considered for analysis. When the color map was put in the target depth, around shaped ROI was drawn in the color map in the moment when the color became homogeneous without artifact. The mean stiffness value of the ROI was automatically presented in kPa as the representative value (fig 1a). The measurement failure was defined when the color did not appear continuously within the map or did not appear ho-mogeneously during the motion.
The second technique was virtual touch quantifica-tion (VTQ) technique of acoustic radiaquantifica-tion force impulse imaging (ARFI, ACUSON S3000, Siemens Healthcare, Erlangen, Germany). In VTQ technique of ARFI, one shear wave velocity (m/sec) was measured quantitatively in a small ROI using a single push beam [10]. We used
Fig 1. Elasticity measurements at 4 cm depth using convex
transducers in a 16.9 kPa phantom, velocity of 60 rpm, using (a) supersonic shear imaging (SSI) and (b) acoustic radiation force impulse imaging (ARFI) techniques.
1-6 MHz low frequency convex and 4-9 MHz high fre-quency linear transducers. For ARFI a small rectangular shaped ROI was put in the target depth without any color map. Measurements were also repeated until 20 valid values were obtained each for 2, 3, 4, and 5 cm depths and the median value was used. The value in m/sec was automatically presented in the ROI (fig 1b). The values in m/sec were then converted to values in kPa using the equation: E=3*(SWV)2, for which the E is Young’s
modulus in kPa, and SWV is in m/sec [8,10]. Failure was assumed when measured values appeared as X.XX m/ sec, instead of as any nominal values. The percentages of measurement failures during the obtaining of the 20 valid values were calculated in each condition.
Phantoms and motion simulation
Liver fibrosis elasticity phantoms (The Shear Wave Liver Fibrosis Phantom, model 039, CIRS, Norfolk, Vir-ginia, USA) of two known custom-made stiffness of 3.0 and 16.9 kPa were used. To simulate regular and con-tinuous motion, the Orbital Shaker (SH30, 11.8” X 11.8” Platform with Timer, FinePCR, Korea) was used. This shaker was used in laboratories to mix fluids, but we used it for this experiment because of its regular, horizontal and circular motion.
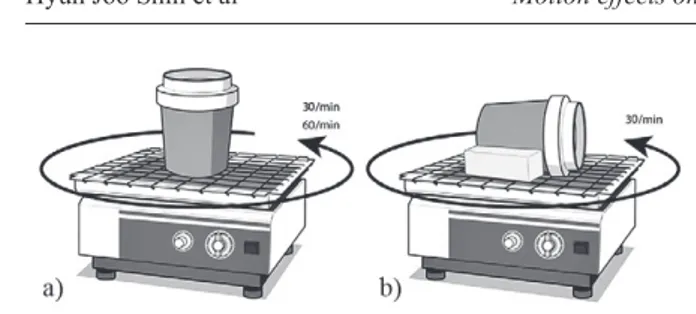
First, the phantom was put on the table of the shaker in upright position (1) at a velocity of 30 rpm, which is the lowest velocity of the Shaker. After that, the veloc-ity was (2) increased to 60 rpm with the phantom in the same position to replicate the diverse respiratory rates of young children. (3) Next, to simulate different antero-posterior directional motion toward the transducers, the phantom was laid on its side on the table of the shaker at a velocity of 30 rpm (fig 2). Because the phantoms were cylindrical in shape, two sponges were put on each side of the phantom to secure it during motion. This at-tempt to replicate different directional motion was made because when performing real-life SWE for the liver, not only supero-inferior directional motion, but also antero-posterior directional motion is applied toward the trans-ducers due to the diaphragmatic motion.
Statistical analysis
Statistical analysis was performed using SPSS ver-sion 20.0.0 (IBM Corp., Armonk, NY, USA). From the twenty measurements, median values with quartile 1 (Q1) and quartile 3 (Q3) were calculated. The Wilcoxon signed-rank test was used to compare the values between moving and static status for each depth. A p-value less than 0.05 was considered to be statistically significant.
Results
Comparison of the elasticities between moving and static status
With the phantoms in an upright position at the lowest velocity of 30 rpm, SWVs were not significantly
differ-Fig 2. To simulate a regular motion, the liver fibrosis elasticity
phantoms of 3 and 16.9 kPa were put on the table of the Orbital Shaker: a) the phantom was put in upright position at the veloc-ity of 30 rpm and 60 rpm, to measure the SWVs during horizon-tal circular motion in an effort to replicate the respiratory rates of children; b) the phantom was laid on its side to create differ-ent directional motion at the velocity of 30 rpm, in an effort to replicate different directional motion toward the transducers as is seen with respiration.
ent between the moving and static status when the convex transducer of SSI was used on the 3 kPa phantom. In 16.9 kPa phantom, the values were different between the mov-ing and static status usmov-ing the convex transducer of SSI. The linear transducer showed significant different results using both phantoms. In addition, the elasticities in mov-ing status tended to be higher than those in the static sta-tus on both phantoms using SSI. When using the convex transducer of ARFI, elasticity values were unexpectedly not obtained in 2 and 3 cm depths of the 3 kPa phan-tom, with repeated measurement failures. In addition, values were not obtained at 5 cm depth with the linear transducer, because the ROI box could not be positioned more than 4 cm depth. In 4 cm depth using the convex transducer of ARFI, the values were not significantly dif-ferent between the moving and static status, regardless of phantom stiffness. In addition, the values were not dif-ferent for the 2 cm depth of the 3 kPa phantom, with the linear transducer and the 2 cm depth of the16.9 kPa phan-tom, with the convex transducer of ARFI. There was no tendency for velocities to increase in the moving status compared to the static status using ARFI. Other values were all significantly different between the moving and static status (Table I).
When the velocity was increased to 60 rpm with the phantoms in an upright position most of the values from SSI were significantly different between the moving and static status, except for those attained at 3 cm depth of the 3 kPa phantom, with the linear transducer and at 2 cm depth of the 16.9 kPa phantom, with the convex trans-ducer. Using ARFI, the values were also not different between the moving and static status for the 2 cm depth Table I. Comparison of the elasticities between moving and static status in 30 rpm velocity of the motion
Phantom Transducer Depth
(cm) SSImoving static p-value ARFImoving static p-value
3 kPa Convex 2 2.1(1.9-2.5) 2.0(1.9-2.0) 0.064 3 2.2(1.9-2.6) 2.0(1.6-2.3) 0.140 4 2.3(2.1-2.7) 2.1(1.9-2.5) 0.154 1.8(1.6-2.2) 1.4(1.4-5.4) 0.198 5 2.5(1.7-3.0) 2.0(1.7-2.6) 0.148 1.8(1.5-2.7) 1.5(1.3-1.5) 0.002 Linear 2 2.2(2.1-2.9) 1.6(1.5-1.8) <0.001 1.8(1.6-2.1) 1.5(1.4-4.4) 0.717 3 2.3(2.1-2.7) 1.6(1.5-1.7) <0.001 1.6(1.3-1.9) 1.4(1.3-1.4) 0.006 4 2.8(2.3-3.5) 1.6(1.6-1.7) <0.001 2.1(1.6-2.6) 1.8(1.5-1.9) 0.021 5 5.0(3.6-6.0) 1.6(1.5-1.8) <0.001 16.9 kPa Convex 2 13.6(12.8-15.3) 12.1(12.0-12.2) 0.001 11.9(9.6-13.1) 12.0(11.9-12.1) 0.616 3 14.8(13.2-16.9) 10.8(10.7-11.0) <0.001 9.9(6.7-11.7) 12.0(11.9-12.5) 0.001 4 13.1(11.9-16.5) 10.8(10.8-10.9) 0.002 11.2(5.0-18.3) 13.1(13.0-13.2) 0.550 5 16.0(13.7-17.8) 10.2(10.2-10.4) <0.001 2.2(1.8-5.3) 12.4(11.9-12.6) <0.001 Linear 2 10.8(10.4-11.6) 9.8(9.8-9.8) <0.001 4.7(3.5-7.5) 9.6(9.5-9.7) <0.001 3 11.6(11.1-12.9) 9.9(9.9-9.9) <0.001 2.7(2.0-4.4) 9.5(9.2-9.7) <0.001 4 15.1(12.7-18.0) 10.3(10.2-10.3) <0.001 2.6(1.5-4.7) 5.4(5.2-6.2) 0.021 5 15.6(12.7-22.2) 10.3(9.7-11.1) <0.001
of the 3 kPa phantom, with the linear transducer and for the 2 cm depth of the 16.9 kPa phantom, with the convex transducer. There was no tendency for velocities to in-crease in the moving status compared to static status for both SSI and ARFI (Table II).
With the phantoms laid on their sides at the velocity of 30 rpm the values attained with the use of the convex transducer of SSI were not significantly different between the moving and static status in all depths of the 3 kPa phantom, as were the values found with the phantom in an upright position. In comparison, most of the values
found with SSI for the 16.9 kPa phantom were signifi-cantly different according to transducer and depth. Val-ues tended to be higher in the moving status, compared to those of the static status using SSI, similar to the trend observed when the phantoms were in an upright position. Using ARFI, the values were not significantly different for the 4 cm depth using the convex and linear transduc-ers on the 3 kPa phantom. In addition, the values were not different for the 2 cm depth of the 3 kPa phantom with the linear transducer, and for the 3cm depth of the 16.9 kPa phantom with the convex transducer in ARFI (Table III). Table II. Comparison of the elasticities between moving and static status in 60 rpm velocity of the motion
Phantom Transducer Depth
(cm) SSImoving static p-value ARFImoving static p-value
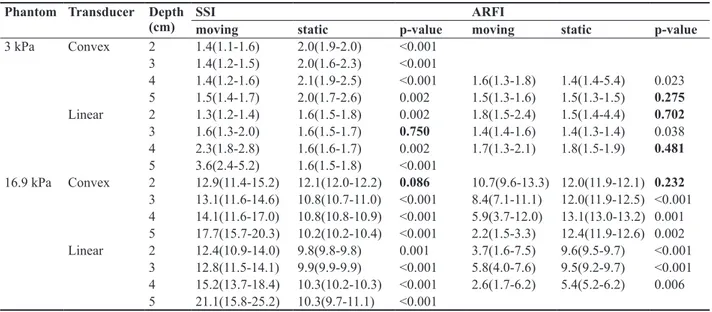
3 kPa Convex 2 1.4(1.1-1.6) 2.0(1.9-2.0) <0.001 3 1.4(1.2-1.5) 2.0(1.6-2.3) <0.001 4 1.4(1.2-1.6) 2.1(1.9-2.5) <0.001 1.6(1.3-1.8) 1.4(1.4-5.4) 0.023 5 1.5(1.4-1.7) 2.0(1.7-2.6) 0.002 1.5(1.3-1.6) 1.5(1.3-1.5) 0.275 Linear 2 1.3(1.2-1.4) 1.6(1.5-1.8) 0.002 1.8(1.5-2.4) 1.5(1.4-4.4) 0.702 3 1.6(1.3-2.0) 1.6(1.5-1.7) 0.750 1.4(1.4-1.6) 1.4(1.3-1.4) 0.038 4 2.3(1.8-2.8) 1.6(1.6-1.7) 0.002 1.7(1.3-2.1) 1.8(1.5-1.9) 0.481 5 3.6(2.4-5.2) 1.6(1.5-1.8) <0.001 16.9 kPa Convex 2 12.9(11.4-15.2) 12.1(12.0-12.2) 0.086 10.7(9.6-13.3) 12.0(11.9-12.1) 0.232 3 13.1(11.6-14.6) 10.8(10.7-11.0) <0.001 8.4(7.1-11.1) 12.0(11.9-12.5) <0.001 4 14.1(11.6-17.0) 10.8(10.8-10.9) <0.001 5.9(3.7-12.0) 13.1(13.0-13.2) 0.001 5 17.7(15.7-20.3) 10.2(10.2-10.4) <0.001 2.2(1.5-3.3) 12.4(11.9-12.6) 0.002 Linear 2 12.4(10.9-14.0) 9.8(9.8-9.8) 0.001 3.7(1.6-7.5) 9.6(9.5-9.7) <0.001 3 12.8(11.5-14.1) 9.9(9.9-9.9) <0.001 5.8(4.0-7.6) 9.5(9.2-9.7) <0.001 4 15.2(13.7-18.4) 10.3(10.2-10.3) <0.001 2.6(1.7-6.2) 5.4(5.2-6.2) 0.006 5 21.1(15.8-25.2) 10.3(9.7-11.1) <0.001
The values are presented as median (Q1-Q3) in kPa. SSI – supersonic shear wave imaging; ARFI – acoustic radiation force impulse.
Table III. Comparison of the elasticities between moving and static status in 30 rpm velocity with phantoms laid on its side.
Phantom Transducer Depth
(cm) SSImoving static p-value ARFImoving static p-value
3 kPa Convex 2 1.9(1.7-2.1) 2.0(1.9-2.0) 0.643 . . . 3 2.1(1.7-2.7) 2.0(1.6-2.3) 0.268 . . . 4 2.2(2.0-2.7) 2.1(1.9-2.5) 0.303 1.6(1.5-1.8) 1.4(1.4-5.4) 0.126 5 2.3(1.7-2.9) 2.0(1.7-2.6) 0.266 1.6(1.4-2.1) 1.5(1.3-1.5) 0.004 Linear 2 1.8(1.3-2.3) 1.6(1.5-1.8) 0.304 1.6(1.6-2.0) 1.5(1.4-4.4) 0.837 3 1.8(1.5-2.9) 1.6(1.5-1.7) 0.055 1.8(1.6-2.0) 1.4(1.3-1.4) <0.001 4 2.3(1.8-3.1) 1.6(1.6-1.7) <0.001 1.8(1.4-2.4) 1.8(1.5-1.9) 0.526 5 3.8(2.6-5.0) 1.6(1.5-1.8) <0.001 . . . 16.9 kPa Convex 2 12.8(11.2-14.1) 12.1(12.0-12.2) 0.117 9.0(7.9-11.9) 12.0(11.9-12.1) 0.008 3 13.2(12.8-14.4) 10.8(10.7-11.0) <0.001 10.9(9.8-13.2) 12.0(11.9-12.5) 0.279 4 15.8(14.3-17.1) 10.8(10.8-10.9) <0.001 7.9(4.7-14.1) 13.1(13.0-13.2) 0.021 5 19.2(15.3-22.0) 10.2(10.2-10.4) <0.001 9.8(2.7-13.9) 12.4(11.9-12.6) 0.067 Linear 2 11.1(10.4-11.9) 9.8(9.8-9.8) <0.001 3.5(1.7-7.8) 9.6(9.5-9.7) <0.001 3 13.1(11.3-14.5) 9.9(9.9-9.9) <0.001 5.0(3.8-8.6) 9.5(9.2-9.7) <0.001 4 15.7(13.2-18.1) 10.3(10.2-10.3) <0.001 2.1(1.6-5.0) 5.4(5.2-6.2) 0.006 5 19.1(15.0-25.8) 10.3(9.7-11.1) <0.001 . . .
Measurement failure
There was no measurement failure using SSI during the moving and static status. The nominal values were presented at each acquisition using SSI. However, when using ARFI, values were unexpectedly not obtained in 2 and 3 cm depths of the 3 kPa phantom with the convex transducer and higher failure rates were observed during the twenty repeat measurements of the acquisitions. In addition, there were frequent measurement failures using ARFI, especially in the moving status (Table IV).
Discussions
It is difficult to make pediatric patients hold their breath for even a brief amount of time during the ultra-sound examinations. Many adults also have difficulties in holding their breath during repeated measurements of elasticities. Therefore, to take advantage of the benefits of ultrasound elastography, it is crucial to know the ef-fects of the continuous motion, such as respiratory and cardiac motions, on elasticity measurement. In addition, knowledge on the effect of motion on different machines, transducers and acquisition depths is useful to fully un-derstand and interpret examination results.
There have been a few studies which have focused on the effect that the breathing method has on the measure-ment of tissue stiffness. Goertz et al [14] studied the in-fluence of specific breathing maneuvers while measuring liver elasticity using ARFI and concluded that there were no significant differences in liver elasticity during deep inspiration, deep expiration, and the Valsalva maneuver. Karlas et al [12] measured the spleen stiffness in two dif-ferent respiratory positions (breath-hold after expiration and deep inspiration). They found that deep inspiration increased spleen stiffness in both healthy and cirrhotic subjects and mentioned that the standardization of the respiratory position was necessary [12]. However, these two studies focused on the effects of specific breathing maneuvers after breath-holds. The Society of Radiolo-gists in Ultrasound stated that a shallow breath-hold was needed to obtain the best ultrasound elastography exami-nation results, which means that patients have to hold their breath for a few seconds [13].
In this study, we attempted to simulate respiratory motion by using different velocities and directions of mo-tion toward the transducers. Even though the combined circular motion of the Orbital Shaker was different from the pure respiratory motion, we tried to imitate the di-verse velocities and compound directions of continuous respiration as much as possible. Therefore, the effect of motion on elasticity measurement was different accord-ing to the machine. In SSI, when motion was applied on the lower stiffness phantom (3 kPa, which represented normal liver stiffness) at a lower velocity (30 rpm), the convex transducer of SSI was less affected by motion, regardless of the acquisition depth and the direction of the motion. Secondly, for the lower velocity motion, elastici-ty values showed a tendency to increase during the move-ment status than during the static status on SSI, regardless of the direction of the motion. Thirdly, most of the elastic-ity values changed in the moving status when the velocelastic-ity or stiffness was increased to 60 rpm or to 16.9 kPa (the phantom which represented fibrosis of the liver).
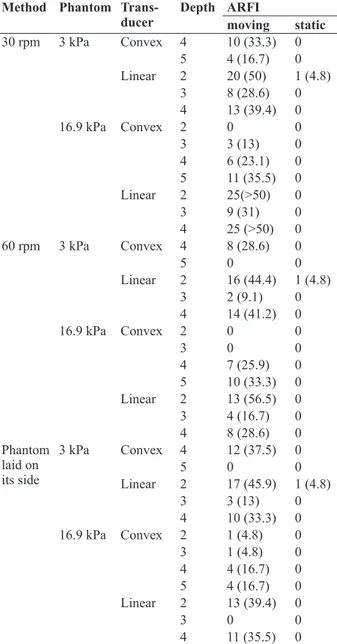
Table IV. Measurement failure during the twenty repeats of ac-quisition using ARFI
Method Phantom
Trans-ducer Depth ARFImoving static
30 rpm 3 kPa Convex 4 10 (33.3) 0 5 4 (16.7) 0 Linear 2 20 (50) 1 (4.8) 3 8 (28.6) 0 4 13 (39.4) 0 16.9 kPa Convex 2 0 0 3 3 (13) 0 4 6 (23.1) 0 5 11 (35.5) 0 Linear 2 25(>50) 0 3 9 (31) 0 4 25 (>50) 0 60 rpm 3 kPa Convex 4 8 (28.6) 0 5 0 0 Linear 2 16 (44.4) 1 (4.8) 3 2 (9.1) 0 4 14 (41.2) 0 16.9 kPa Convex 2 0 0 3 0 0 4 7 (25.9) 0 5 10 (33.3) 0 Linear 2 13 (56.5) 0 3 4 (16.7) 0 4 8 (28.6) 0 Phantom laid on its side 3 kPa Convex 4 12 (37.5) 0 5 0 0 Linear 2 17 (45.9) 1 (4.8) 3 3 (13) 0 4 10 (33.3) 0 16.9 kPa Convex 2 1 (4.8) 0 3 1 (4.8) 0 4 4 (16.7) 0 5 4 (16.7) 0 Linear 2 13 (39.4) 0 3 0 0 4 11 (35.5) 0
The percentages of failure measurements until obtaining 20 valid values are presented in the parenthesis. ARFI – acoustic radiation force impulse.
Therefore, we could assume that, in SSI, the convex transducer is more stable for slowly moving subjects with lower stiffness. Even though 30 rpm was the lowest velocity that was applied in this study, most respiratory motions are under 30 breaths/min for the general popu-lation, with neonates being the exception. So, we could conclude that most respiratory motion will not influence elasticity values when using the convex transducer of SSI on the lower stiffness phantom. In addition, when the values in the moving status were within normal range ac-cording to the liver fibrosis grade, the values in the static status were also within the normal range of liver fibrosis, because the values in the static status were lower than the values inthe moving status in SSI. However, the values in the moving status were significantly different in the higher velocity motion or in the stiff phantoms when us-ing SSI, even though the values were obtained without measurement failures. Gennisson et al [17] also men-tioned that SSI could be sensitive to motion because of its ultrafast imaging speed, despite the acquisition of the values being done in less than 30 milliseconds.
With ARFI, it was hard to define a specific transducer which was constantly stable during motion in various conditions. In addition, it was not easy to obtain nomi-nal values itself especially in the moving status due to the frequent measurement failures. Because ARFI uses a single push beam to measure SWV, it can be harder to measure values in the moving status comparing with SSI, which uses multiple axial beams in a wide ROI.
A recent study using only the convex transducer of SSI showed that the liver elasticities were similar be-tween free breathing and apnea status in homogeneous liver parenchyma of patients, and the values were not dif-ferent between the static and moving status using phan-tom [15]. These results were constant as in our study, us-ing the convex transducer of SSI in the lower stiffness phantom at the lower velocity motion. They found that the apnea could lead to increased elasticity values than in the moving status because a Valsalva maneuver during apnea status could lead to increased hepatic blood flow and increased hepatic stiffness consequently. However, in our study, elasticities in moving status tended to be higher than those in the static status on both phantoms using SSI. From these discrepancies, we could suggest that the elasticity measurement in forced breath-holding could lead to more inaccurate results than in the shallow regular breathing status by hepatic congestion during the Valsalva maneuver.
There are several limitations in this study. First, this study was an experimental phantom study. We used 3 and 16.9 kPa phantoms to represent the normal and fi-brotic range of liver stiffness. However, the
heterogene-ity of liver parenchyma can also affect the measurements of elasticity in the moving status, and these two specific values could not represent the entire normal and fibrotic range of liver stiffness. Secondly, we could not evalu-ate the diagnostic accuracy according to the phantom stiffness, because the shield above the phantom contents made the measured values differently from 3 and 16.9 kPa. We could only use the phantoms for its homoge-neity with known stiffness values to know the effect of motion on the measurement of elasticity in this study. In addition, the bias of stiffness in motion appeared dif-ferently according to the depth and velocity of the mo-tions as shown in interquartile ranges. Further studies to evaluate the diagnostic accuracy during the motion are needed. Third, there were limitations in using the shaker to simulate regular motion, such as respiration. It was not easy to find, or to make a machine that had move-ments identical to the respiratory motion. However, this study was meaningful because it was an initial attempt to evaluate the effect of continuous regular motion itself on the measurement of SWVs in different acquisition condi-tions. Further studies are needed to apply the results in actual clinical practice and to standardize the conditions of examinations.
Conclusion
Through this initiative experimental study, the con-vex transducer of SSI was found to be more stable for slowly moving subjects with the lower stiffness. How-ever, the values in moving status were different in the higher velocity motion or in a fibrotic background using SSI, even though the values were easily obtained with-out measurement failures. For ARFI, there were no spe-cific transducers with high stability during motion and frequent measurement failures were noted. This study showed that the motion affected the measurement of elasticity differently in SSI and ARFI. Therefore, differ-ent settings are required according to the condition of the patients to minimize the effect of motion during meas-urements of elasticities and for the wide application of ultrasound elastography in patients who have difficulties in holding their breath.
Acknowledgements
The authors would like to thank Dong-Su Jang, MFA, (Medical Illustrator, Medical Research Support Section, Yonsei University College of Medicine, Seoul, Korea) for his help with the illustrations.
References
1. Ferraioli G, Parekh P, Levitov AB, Filice C. Shear wave elastography for evaluation of liver fibrosis. J Ultrasound Med 2014;33:197-203.
2. Sohn B, Kim MJ, Han SW, Im YJ, Lee MJ. Shear wave velocity measurements using acoustic radiation force im-pulse in young children with normal kidneys versus hydro-nephrotic kidneys. Ultrasonography 2014;33:116-121. 3. Ferraioli G, Tinelli C, Lissandrin R, et al. Ultrasound point
shear wave elastography assessment of liver and spleen stiffness: effect of training on repeatability of measure-ments. Eur Radiol 2014;24:1283-1289.
4. Lee MJ, Kim MJ, Han KH, Yoon CS. Age-related changes in liver, kidney, and spleen stiffness in healthy children measured with acoustic radiation force impulse imaging. Eur J Radiol 2013;82:e290-e294.
5. Ozmen E, Adaletli I, Kayadibi Y, et al. The impact of share wave elastography in differentiation of hepatic hemangio-ma from hemangio-malignant liver tumors in pediatric population. Eur J Radiol 2014;83:1691-1697.
6. Liu BX, Xie XY, Liang JY, et al. Shear wave elastography versus real-time elastography on evaluation thyroid nod-ules: a preliminary study. Eur J Radiol 2014;83:1135-1143. 7. Lin P, Chen M, Liu B, Wang S, Li X. Diagnostic perfor-mance of shear wave elastography in the identification of malignant thyroid nodules: a meta-analysis. Eur Radiol 2014;24:2729-2738.
8. Wang CZ, Zheng J, Huang ZP, et al. Influence of measure-ment depth on the stiffness assessmeasure-ment of healthy liver with real-time shear wave elastography. Ultrasound Med Biol 2014;40:461-469.
9. Sporea I, Bota S, Gradinaru-Tascau O, Sirli R, Pope-scu A. Comparative study between two point Shear Wave
Elastographic techniques: Acoustic Radiation Force Im-pulse (ARFI) elastography and ElastPQ. Med Ultrason 2014;16:309-314.
10. Shin HJ, Kim MJ, Kim HY, Roh YH, Lee MJ. Compari-son of shear wave velocities on ultrasound elastography between different machines, transducers, and acquisition depths: a phantom study. Eur Radiol 2016;26:3361-3367. 11. Harper CJ, Shahgholi L, Cieslak K, Hellyer NJ, Strommen
JA, Boon AJ. Variability in diaphragm motion during nor-mal breathing, assessed with B-mode ultrasound. J Orthop Sports Phys Ther 2013;43:927-931.
12. Karlas T, Lindner F, Troltzsch M, Keim V. Assessment of spleen stiffness using acoustic radiation force impulse aging (ARFI): definition of examination standards and im-pact of breathing maneuvers. Ultraschall Med 2014;35:38-43.
13. Barr RG, Ferraioli G, Palmeri ML, et al. Elastography Assessment of Liver Fibrosis: Society of Radiologists in Ultrasound Consensus Conference Statement. Radiology 2015;276:845-861.
14. Goertz RS, Egger C, Neurath MF, Strobel D. Impact of food intake, ultrasound transducer, breathing maneuvers and body position on acoustic radiation force impulse (ARFI) elastometry of the liver. Ultraschall Med 2012;33:380-385. 15. Pellot-Barakat C, Chami L, Correas JM, Lefort M, Lu-cidarme O. Does motion affect liver stiffness estimates in shear wave elastography? Phantom and clinical study. Eur J Radiol 2016;85:1645-1650.
16. Jeong WK, Lim HK, Lee HK, Jo JM, Kim Y. Principles and clinical application of ultrasound elastography for diffuse liver disease. Ultrasonography 2014;33:149-160.
17. Gennisson JL, Deffieux T, Fink M, Tanter M. Ultrasound elastography: principles and techniques. Diagn Interv Im-aging 2013;94:487-495.