저작자표시-비영리-변경금지 2.0 대한민국 이용자는 아래의 조건을 따르는 경우에 한하여 자유롭게 l 이 저작물을 복제, 배포, 전송, 전시, 공연 및 방송할 수 있습니다. 다음과 같은 조건을 따라야 합니다: l 귀하는, 이 저작물의 재이용이나 배포의 경우, 이 저작물에 적용된 이용허락조건 을 명확하게 나타내어야 합니다. l 저작권자로부터 별도의 허가를 받으면 이러한 조건들은 적용되지 않습니다. 저작권법에 따른 이용자의 권리는 위의 내용에 의하여 영향을 받지 않습니다. 이것은 이용허락규약(Legal Code)을 이해하기 쉽게 요약한 것입니다. Disclaimer 저작자표시. 귀하는 원저작자를 표시하여야 합니다. 비영리. 귀하는 이 저작물을 영리 목적으로 이용할 수 없습니다. 변경금지. 귀하는 이 저작물을 개작, 변형 또는 가공할 수 없습니다.
Association between liver fibrosis and
appendicular skeletal muscle mass
during antiviral therapy in chronic
hepatitis B
Kyung Hyun Kim
Department of Medicine
The Graduate School, Yonsei University
[UCI]I804:11046-000000522236
[UCI]I804:11046-000000522236
Association between liver fibrosis and
appendicular skeletal muscle mass
during antiviral therapy in chronic
hepatitis B
Directed by Professor Seung Up Kim
The Master's Thesis submitted
to the Department of Medicine,
the Graduate School of Yonsei University
in partial fulfillment of the requirements for the degree
of Master of Medicine
Kyung Hyun Kim
This certifies that the Master's Thesis of
Kyung Hyun Kim is approved.
---
Thesis Supervisor : Seung Up Kim
---
Thesis Committee Member#1 : Dong Jin Joo
---
Thesis Committee Member#2 : Yong-Ho Lee
The Graduate School
Yonsei University
<TABLE OF CONTENTS>
ABSTRACT ··· 1
I. INTRODUCTION ··· 3
II. MATERIALS AND METHODS ··· 4
1. Patients ··· 4
2. Assessment of appendicular skeletal muscle mass using BIA ···· 5
3. Assessment of liver fibrosis using TE ··· 5
4. Definition··· 6
5. Statistical analysis ··· 7
III. RESULTS ··· 7
1. Baseline charateristics ··· 7
2. Comparison of the baseline characteristics between the subgroups
with and without AVT ··· 10
3. Change in ASM in the entire study population and the subgroups
with and without AVT ··· 10
4. Changes in laboratory parameters ··· 14
5. Comparison between sarcopenic and nonsarcopenic patients in the
entire study population ··· 16
6. Comparison between sarcopenic and nonsarcopenic patients in the
subgroups with and without AVT ··· 16
7. Change in ASM in AVT group according to sarcopenic status ·· 16
8. Independent predictors of the reduction in ASM(≥5% from the base
line) ··· 18
line) in AVT group ··· 20
IV. DISCUSSION ··· 22
V. CONCLUSION ··· 24
REFERENCES ··· 25
LIST OF FIGURES
Figure 1. Flow of selecting the study population ··· 8
Figure 2. Changes in appendicular skeletal muscle mass ···· 11
Figure 3. Changes in two variables with and without AVT ·· 15
Figure 4. Changes in appendicular skeletal muscle mass with
and without sarcopenia in AVT subgroup ··· 17
LIST OF TABLES
Table 1. Baseline characteristics of the study population ··· 9
Table 2. Comparison between patients with and without
sarcopenia ··· 13
Table 3. Independent predictors of ASM reduction (>5%) ···· 19
Table 4. Independent predictors of ASM reduction (>5%) in
ABSTRACT
Dynamic association between the change in liver fibrosis
and appendicular skeletal muscle mass during antiviral
therapy in patients with chronic hepatitis B
Kyung Hyun Kim
Department of Medicine
The Graduate School, Yonsei University
(Directed by Professor Seung Up Kim)
Sarcopenia is associated with significant liver fibrosis in patients
with chronic hepatitis B (CHB). We investigated the dynamic association
between hepatic fibrosis and changes in appendicular skeletal muscle
mass during antiviral therapy (AVT). Patients with CHB who underwent
paired liver stiffness measurements between 2015 and 2018, using
transient elastography to assess fibrotic burden and bioelectrical
impedance analysis to assess appendicular skeletal muscle mass
(ASMM), were recruited retrospectively. The mean time interval
between two bioelectrical impedance analyses was 19.0 months.
Significant liver fibrosis was defined as liver stiffness ≥ 8 kPa. The mean
age of the study population (252 men and 163 women) was 55.9 years.
Among all participants, 223 (53.7%) received AVT (AVT group),
whereas 192 (46.3%) did not receive AVT (no AVT group). During AVT,
ASMM decreased significantly in the AVT group (from mean 21.16 to
21.00 kg, P=0.01) but showed no significant change in the no AVT
group (from mean 20.77 to 20.64 kg, P=0.134). In the subgroup with
significant liver fibrosis (66 and 42 participants with and without AVT,
respectively), ASMM decreased significantly in the AVT group during
AVT (from mean 20.73 to 20.54 kg, P=0.037) but showed no significant
change in the no AVT group (from mean 21.39 to 21.07 kg, P=0.097).
ASMM was significantly decreased during AVT. Thus, efforts should be
made to maintain ASMM in patients with CHB receiving AVT.
Key words : appendicular skeletal muscle mass, chronic hepatitis B,
antiviral therapy.
Dynamic association between the change in liver fibrosis and
appendicular skeletal muscle mass during antiviral therapy in
patients with chronic hepatitis B
Kyung Hyun Kim
Department of Medicine
The Graduate School, Yonsei University
(Directed by Professor Seung Up Kim)
I. INTRODUCTION
Chronic hepatitis B virus (HBV) infection continues to be a major public health issue worldwide despite the availability of an effective vaccine and potent antiviral therapy (1). More than 350 million people have HBV infections worldwide, and nearly 1 million deaths occur each year because of HBV-related complications, such as liver cirrhosis and hepatocellular carcinoma (2). HBV infection is associated with a wide spectrum of clinical manifestations, ranging from acute or fulminant hepatitis to various forms of chronic infection, including asymptomatic carrier state, chronic hepatitis, liver cirrhosis, and hepatocellular carcinoma (HCC) (3).
Antiviral therapy (AVT) to suppress viral replication is the mainstay of HBV treatment. Effective AVT can stabilize hepatic necroinflammation due to HBV replication, which ultimately result in the reduced risk of developing HCC or cirrhosis-related complications in patients with CHB (4, 5). This favorable response is mainly due to the regression of liver fibrosis by appropriate AVT, which has been supported by recent studies. In a study by Chon YE, et al. (6), over the 5-year AVT treatment, liver fibrosis, as determined by LS value, progressively improved. The proportion of patients with LS-defined liver
cirrhosis was markedly decreased from 66.7% at baseline to 17.5% at year 5, and the proportion of patients with LS-defined mild or no fibrosis was significantly increased from 3.3% at baseline to 52.5% at year 5, resulting in the overall decrease in LS value in most patients (90.0% [n=108 of 120]) (6). Moreover, a recent study reported that sarcopenia is independently associated
with the degree of liver fibrosis in patients with CHB, especially in those with metabolically unhealthy status such as obesity, insulin resistance, metabolic syndrome, and liver steatosis (7). However, due to the cross-sectional nature of the study design, the longitudinal dynamic association between the progression or regression of liver fibrosis and changes in skeletal muscle mass, which would provide their causal relationship, could not be assessed (7).
Accordingly, based on the hypothesis that long-term AVT regresses liver fibrosis and sarcopenia is independently associated with significant liver fibrosis in patients with CHB, we investigated the dynamic association between the change in liver fibrosis and ASM during AVT in patients with CHB.
II. MATERIALS AND METHODS
1. Patients
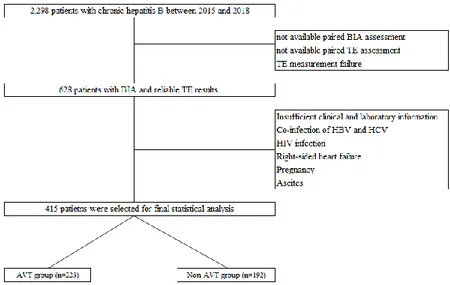
A retrospective review of database from Yonsei Liver Center, Severance Hospital, Yonsei University College of Medicine, Seoul, Korea, was performed. Between 2015 and 2018, patients with CHB who started or already under AVT using entecavir (ETV) or tenofovir (TDF) and received transient elastography (TE) to assess fibrotic burden in liver and bioelectrical impedance (BIA) analysis to assess appendicular skeletal muscle mass (ASM) were considered eligible. Exclusion criteria were as follows: 1) not available paired TE and BIA assessment; 2) TE or BIA measurement failure; 3) insufficient clinical and laboratory information; 4) co-infection with hepatitis C virus or HIV; 5) right-sided heart failure; 6) pregnancy; or 7) ascites (Figure 1).
The study protocol was in accordance with the ethics guidelines of the 1975 Declaration of Helsinki and the study procedure was approved by the Institutional Review Board of Severance Hospital. Written informed consent
was waived because of the retrospective nature of the study.
2. Assessment of appendicular skeletal muscle mass using BIA
As described previously (8), ASM was measured using BIA (InBody®,
InBody770, Seoul, Republic of Korea). In order to obtain the changes in ASM, two or more BIA were carried out in the same patients during the study period, with the mean interval between the first and last BIA assessment being 19.0 (interquartile range 11.8-25.4) months.
The InBody770 are produced from the same manufacturer. Each device utilizes hand-to-foot BIA that sends varying frequencies of alternating current through the body. These impedance values are then used to predict several analyses including Body Composition Analysis, Muscle-Fat Analysis, Obesity Analysis, Segmental Lean Analysis, ECW Ratio Analysis and Body Composition History. Before testing on each device the following protocols were employed: age, sex, and height were entered into the software for each participant (9). Before contact with the electrodes, participants cleansed their hands and feet with antibacterial tissue from the manufacturer (9). Standing in an upright position, the feet were then centered on the electrodes and the hand electrodes were grasped with arms being held wide enough so that there was no contact between the arms and torso (9). This position was held for the duration of the test (9). Once the assessment was completed, participants were prompted to return the hand electrodes and step off the device (9).
3. Assessment of liver fibrosis using TE
As described previously (10), the degree of liver fibrosis assessed using TE was expressed as liver stiffness (LS) value. In order to obtain the changes in LS value, two or more TE were carried out in the same patients during the study period. In our institute, BIA has been performed at the same time with TE. Accordingly, the mean interval between the first and last TE assessment was same as that of BIA 19.0 (interquartile range 11.8-25.4) months.
blinded to the clinical information of patients, performed the TE examinations. TE was performed on the right lobe of the liver through the intercostal space with the participant lying in the dorsal decubitus position with the right arm in maximal abduction. All TE examinations were performed at least 10 times, between the 5th and 7th intercostal spaces, at the mid-to-anterior axillary line (11). The TE results for the degree of liver fibrosis were expressed as kilopascals (kPa) for LS. The median value of successful measurements was selected as the representative LS value for a given participant. As an indicator of variability, the ratio of the interquartile range (IQR) to the median LS value was calculated. TE assessment failure was defined as the absence of valid shots (i.e., valid shots=0). A reliable LS value was defined by the following criteria: (i) at least 10 valid shots and (ii) an IQR 30% of the median LS value. Moreover, we collected data on the degree of liver steatosis which can be expressed as the controlled attenuation parameter (CAP) values. The CAP measures the ultrasonic attenuation by hepatic steatosis at 3.5 MHz using signals acquired by TE, and is simultaneously calculated with the LS value by using the same signals (12).
4. Definition
TE-defined significant liver fibrosis and fatty liver were defined as LS measurement >8 kPa (10) and controlled attenuation parameter >250 dB/m, respectively (13). Based on the criteria for the Asian Pacific region, subjects were considered obese when their body mass index was ≥25 kg/m2 (14). Liver
cirrhosis was diagnosed with abdominal ultrasonography. The sarcopenia index was calculated as follows: sarcopenia index = total appendicular skeletal muscle mass (kg)/body mass index (kg/m2); this was the official definition
provided by a recent consensus meeting known as the “Foundation for the National Institutes of Health Sarcopenia Project” (15). The Foundation for the National Institutes of Health Sarcopenia Project used 9 sources of community dwelling elderly cohorts to derive the recommendations for cutoff points of low lean mass in men and women. In this meeting, sarcopenia was defined using
cutoff points of SI<0.789 in men and <0.521 in women, which was also adopted for our study.
5. Statistical analysis
The characteristics of the study subjects were analyzed according to sarcopenia status or antiviral therapy status using Student’s t-tests for continuous variables and χ2 tests for categorical variables. Paired t -tests were
used to compare the assessment of ASM between the first and last BIA. Multivariable logistic binary regression analysis was applied to determine the independent association between appendicular skeletal muscle mass changes and other variables. In multivariable logistic binary regression analysis, we used the variables that univariate P values of whom were lower than 0.1.
P<0.05 was considered statistically significant. Statistical analyses were
performed using SPSS version 23.0 for Windows (IBM Corp., Armonk, NY, USA).
III. RESULTS
1. Baseline characteristics of the entire study population
Between 2015 and 2018, 2,298 patients with CHB who received TE and BIA assessment were considered eligible. After excluding 1,883 patients according to our exclusion criteria, 415 patients (252 men and 163 women) were finally selected and divided into two groups with or without AVT for the statistical analysis (Figure 1).
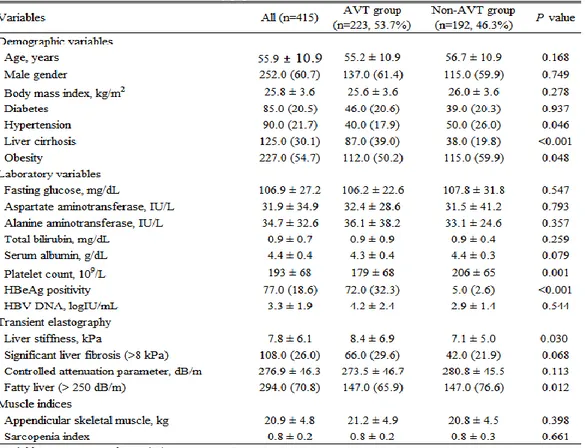
The baseline clinical characteristics of the study population are shown in
Table 1. The mean age of the entire study population was 55.9 years. Male
gender predominated (n=252, 60.7%). The mean BMI was 25.8 kg/m2. The
proportion of patients with diabetes, hypertension, liver cirrhosis, and obesity was 20.5, 21.7, 30.1, and 54.7%, respectively. The mean LS and CAP values were 7.8 kPa and 276.9 dB/m, respectively. Significant liver fibrosis and fatty liver were identified in 108 (26.0%) and 294 (70.8%) patients, respectively. The mean ASM was 20.9 kg.
2. Comparison of the baseline characteristics between the subgroups with and without AVT
When the study population was divided into two sub-groups with and without AVT and compared (Table 1), AVT group had significantly higher platelet count (mean 205.8 vs. 179.2 109/L) and LS value (mean 8.4 vs. 7.1 kPa) (all P<0.05). The proportion of liver cirrhosis and HBeAg positivity was
significantly higher than in Non-AVT group (all P<0.05). However, the proportion of hypertension, obesity and fatty liver was significantly lower than in Non-AVT group (all P<0.05).
3. Change in ASM in the entire study population and the subgroups with and without AVT
Based on the results of TE and BIA in the entire study population, ASM significantly decreased from the baseline (mean 20.98 → 20.83 kg, P=0.005) (Figure 2A). ASM significantly decreased in AVT group (n=223) (mean 21.16 → 21.00 kg, P=0.01), not in Non-AVT group (n=192) (mean 20.77 → 20.64 kg,
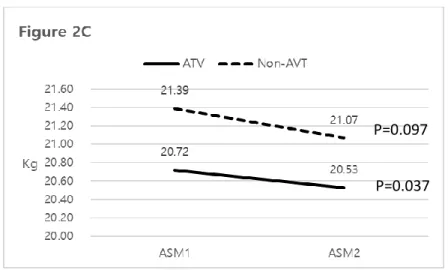
P=0.134) (Figure 2B). When 108 patients with significant liver fibrosis were
selected (n=66 in AVT group and n=42 in Non-AVT group), ASM significantly decreased only in AVT group (mean 20.72 → 20.53 kg, P=0.037), not in Non-AVT group (mean 21.39 → 21.07 kg, P=0.097) (Figure 2C).
P=0.005
P=0.01
Figure 2. Changes in appendicular skeletal muscle mass
P=0.097 P=0.037
4. Changes in laboratory parameters
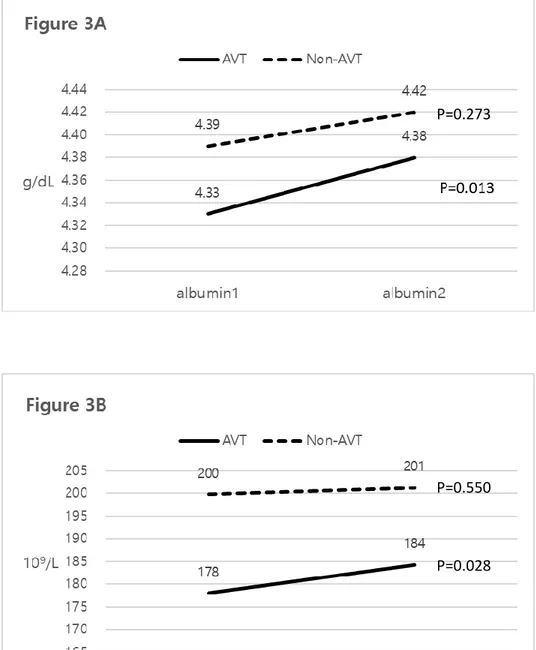
In AVT group, serum albumin (mean 4.33 → 4.38 g/dB, P=0.013) and platelet count (mean 178 → 184 109/L, P=0.028) significantly increased, whereas they
were similarly maintained in Non-AVT group (mean 4.39 → 4.42, P=0.273 for serum albumin; mean 200 → 201 109/L, P=0.550 for platelet count) (Figures
Figure 3. Changes in two variables with and without AVT
P=0.273
P=0.550
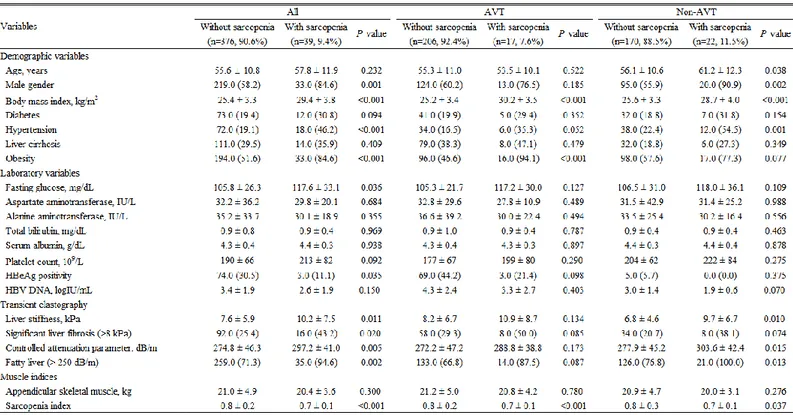
5. Comparison between sarcopenic and nonsarcopenic patients in the entire study population
Among the entire study population, 39 (9.4%) had sarcopenia (Table 2). When compared, sarcopenic patients had significantly higher BMI (mean 29.4 vs. 25.4 kg/m2) and fasting glucose (117.6 vs. 105.8 mg/dL) (all P<0.05), whereas they
had significantly lower sarcopenia index than non-sarcopenic patients (all
P<0.05). In addition, sarcopenic patients had significantly higher LS (mean 10.2
vs. 7.6 kPa) and CAP values (mean 297.2 vs. 274.8 dB/m) (all P<0.05). The proportion of male sex, hypertension, obesity, significant fibrosis, and fatty liver was significantly higher than in non-sarcopenic patients (all P<0.05).
6. Comparison between sarcopenic and nonsarcopenic patients in the subgroups with and without AVT
In AVT group, 17 (7.6%) patients had sarcopenia, whereas 22 (11.5%) patients had sarcopenia in Non-AVT group. When compared in AVT group, sarcopenic patients had significantly higher BMI (mean 30.2 vs. 25.2 kg/m2), whereas they
had significantly lower sarcopenia index than non-sarcopenic patients (all
P<0.05). The proportion of obesity was significantly higher than in
non-sarcopenic patients (all P<0.05).
When compared in Non-AVT group, sarcopenic patients had significantly higher BMI (mean 28.7 vs. 25.6 kg/m2) and age (mean 61.2 vs. 56.1 years), whereas they had significantly lower sarcopenia index than non-sarcopenic patients (all P<0.05). In addition, sarcopenic patients had significantly higher LS (mean 9.7 vs. 6.8 kPa) and CAP values (mean 303.6 vs. 277.9 dB/m) (all P<0.05). The proportion of male sex, hypertension and fatty liver was significantly higher than in non-sarcopenic patients (all P<0.05).
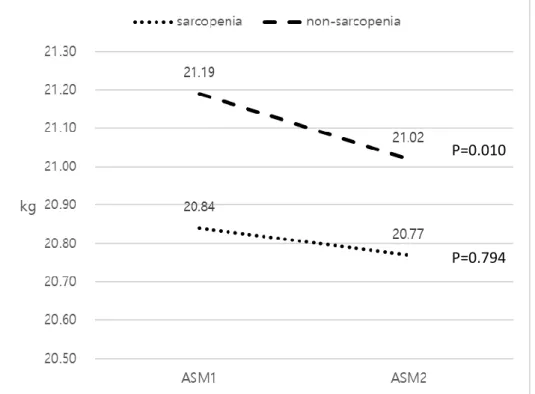
7. Change in ASM in AVT group according to sarcopenic status
Due to the significant reduction of ASM in AVT group, the change in ASM according to sarcopenic status was assessed (Figure 4). ASM significantly decreased in the nonsarcopenic patients (mean 21.19 → 21.02 109/L, P=0.010),
not in the sarcopenic patients (mean 20.84 → 20.77 109/L, P=0.794).
Figure 4. Changes in appendicular skeletal muscle mass with and without
sarcopenia in AVT subgroup
P=0.010
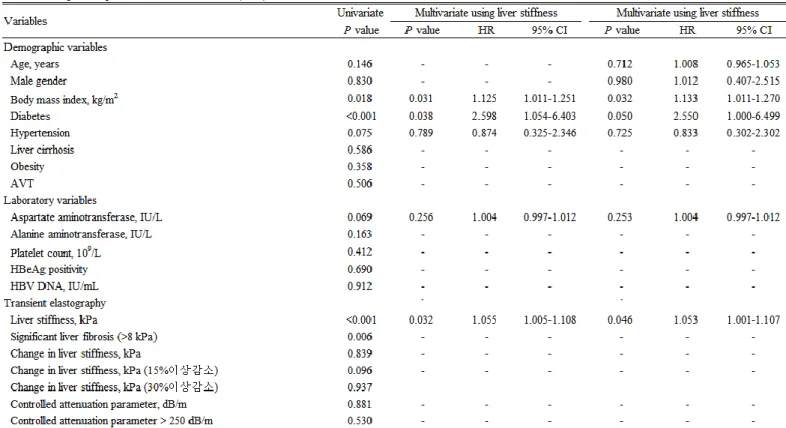
8. Independent predictors of the reduction in ASM (≥ 5% from the baseline) Univariate and subsequent multivariate analyses to identify the independent predictors of the reduction in ASM are shown in Table 3. In univariate analysis, BMI, diabetes, total bilirubin, serum albumin, LS, and significant liver fibrosis significantly predicted the risk of ASM reduction (P<0.05). After adjustment using LS value, higher BMI (OR=1.133, 95% CI, 1.011-1.270), diabetes (OR=2.550, 95% CI, 1.000-6.499), and higher LS value (OR=1.053, 95% CI, 1.001-1.107) were independently associated with an increased risk of ASM reduction (all P<0.05). However, the changes in LS value and CAP were not significantly associated with the risk of ASM reduction (all P>0.05). When age and gender, well-known influencing factors for ASM, were additionally adjusted, similar findings were observed (Table
6. Independent predictors of the reduction in ASM (≥ 5% from the baseline) in AVT group
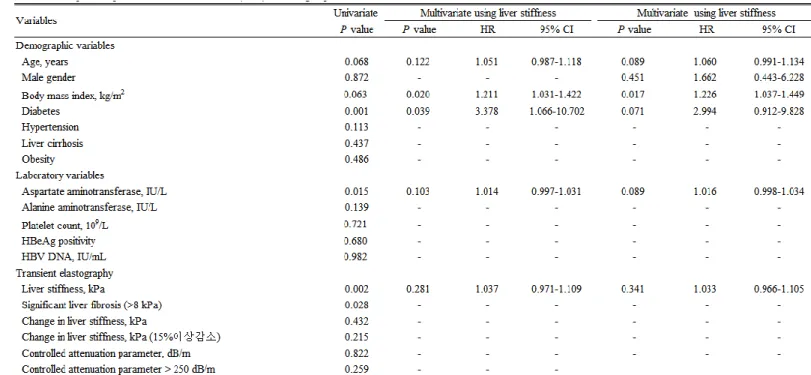
Univariate and subsequent multivariate analyses to identify the independent predictors of ASM reduction in AVT group are shown in Table 4. In univariate analysis, diabetes, AST, LS, and significant liver fibrosis were significantly associated with the increased risk of ASM reduction (P<0.05). After adjustment using LS value, higher BMI (OR=1.211, 95% CI 1.031-1.422) and diabetes (OR=3.378, 95% CI 1.066-10.702) were independently associated with an increased risk of ASM reduction (all P<0.05), whereas the statistical significance of LS value was attenuated (P=0.281). When gender, well-known influencing factor for ASM, were additionally adjusted, only higher BMI was independently associated with the increased risk of ASM reduction (OR=1.226, 95% CI 1.037-1.449, P=0.017), whereas older age (P=0.089), diabetes (P=0.071), and higher AST level (P=0.089) tended to be associated with the increased risk of ASM reduction (Table 4).
IV. DISCUSSION
According to current literature, fibrotic burden frequently decreases during AVT in patients with CHB (6). In addition, it has been confirmed that the high probability of having low ASM is associated with high fibrotic burden in liver in patients with CHB (7). Accordingly, we hypothesized that fibrotic burden would decrease and ASM would increase during AVT. However, our current study failed to show the longitudinal association between the changes in fibrotic burden and ASM during AVT. Unexpectedly, we found that ASM was significantly decreased in our entire cohort, especially in patients receiving AVT, and that older age, higher BMI and diabetes, which have been already known as influencing factors on ASM (16), were associated with the increased risk of ASM reduction during AVT.
Our study has several clinical implications and strengths. First, this is the first study to show the changes in ASM measured by BIA in association with fibrotic burden change during AVT in patients with CHB. Although we failed to prove the primary end-point, the results of our study might be informative for designing the following prospective studies to reveal the confirmatory association between long-term AVT and the change in ASM in patients with CHB. However, because our study found that the reduction in ASM was identified in the subgroup with AVT, it might be suggested that medical efforts to increase or maintain ASM, such as exercise, high-protein diets, and administration of BCAA, might be required during AVT (17).
Second, we found a significant ASM reduction in the entire cohort (mean 0.15 kg during the mean follow-up period of 19.0 months). When compared to the already known the ASM reduction speed as the subjects are getting older (-0.25 kg/year in the Japanese men in their 50s and -0.31 kg/year in the Japanese women in their 50s), the ASM reduction in our entire cohort seems relatively lower (18). The changes in ASM are generally associated with multi-factors within complex interactions (19). Indeed, in our study, older age, higher BMI, and diabetes, not the AVT status, were independently associated with the increased risk of the reduction in ASM in the entire cohort. This might mean that medical intervention, such as
exercise to reduce BMI and strict sugar control to manage diabetes, to maintain the amount of ASM is required for patients with CHB and metabolically unhealthy status.
Third, in contrast to our hypothesis, the longitudinal association between the changes in fibrotic burden and ASM was not identified in the entire cohort. Although the exact reason for this unexpected phenomenon is still unclear, this can be explained in several ways. First, single factor of AVT status might be insufficient in proving the influence of AVT on ASM, because other powerful factors such as age and gender might have attenuated the influence of AVT. Second, changes in ASM itself were extremely small compared to the baseline amount of ASM. Thus, the small changes in ASM might not be sufficient to show the association with the change in fibrotic burden during AVT. Third, the relatively small sample size of our study population might have resulted in the false negative results. However, when considering that the significant improvement in serum albumin level and platelet count after AVT, it might be questionable that the influence of AVT did not work during the study period.
Fourth, ASM was significantly decreased in the subgroup with AVT, not in the subgroup without AVT. Although no difference in ASM was identified between AVT and Non-AVT groups, the proportion of patients with liver cirrhosis was higher, platelet count was lower, and liver stiffness value was higher in AVT group, all of which might be associated with the inadequate protein metabolism to compensate the losing ASM during AVT. Unlike our study, in a study by Iwasa, et
al. (20), no significant change in the area of the psoas major muscle was seen in
the patients with hepatitis B virus given entecavir. And, they found that an improvement in low muscle mass may thus be expected from AVT for viral liver disease, especially in patients with cachexia and a positive correlation was seen for the amount of change in the psoas muscle and the amount of change in serum albumin (20). Similarly, in another recent study by Sugimoto, et al. (21), skeletal muscle mass significantly increased, associated with an elevation of serum albumin levels and/or body weight or reduction in visceral fat area, but only in patients who presented with low skeletal muscle before direct antiviral agent
therapy in hepatitis C virus infection. To resolve this controversial issue, prospective study with large sample size are strongly required.
Fifth, ASM significantly decreased in non-sarcopenic patients, not in sarcopenic patients. This might indicate that the probability of ASM reduction might be low in the subgroup with already low ASM, whereas there is a large room for AVT to reduce ASM in the subgroup with larger ASM. This finding might provide two-way management strategy. First, medical interventions should be required for sarcopenic CHB patients to increase ASM. Second, prophylactic interventions not to lose ASM is strongly required to maintain ASM for non-sarcopenic CHB patients. To resolve issue, prospective interventional studies are warranted.
Despite several strengths of our study, we are also aware of several issues that remained unresolved. First, because of the retrospective, single center study, selection bias may exist. Only those who received paired TE and BIA were included in the study and our institute also conducted TE in hepatitis B patients with regular progress, but BIA may not have implemented relatively thin patients. This might be the reason why our study has shown a high rate of fatty liver and obesity. Second, although the overall sample size of our study is quite similar or larger than those of previous studies (20), it is still relatively insufficient. This is because BIA assessment for patients with chronic liver diseases started in 2015 in our institute. Third, the time interval between paired TE and BIA assessment is relatively narrow (mean 19.0 months for TE and BIA). Thus, the result of study might be subject to the false negativity. As the degree of liver fibrosis persists even after several years, this might be the one of the reasons why AVT status did not influence on ASM change.
V. CONCLUSION
ASM significantly decreased in the entire population with or without AVT. However, this phenomenon was apparent in the subgroup with AVT. Thus, medical interventions to maintain ASM should be considered in patients with CHB under prolonged AVT
REFERENCES
1. Schweitzer A, Horn J, Mikolajczyk RT, Krause G, Ott JJ. Estimations of worldwide prevalence of chronic hepatitis B virus infection: a systematic review of data published between 1965 and 2013. The Lancet. 2015;386(10003):1546-55.
2. Allain J-P, Opare-Sem O. Screening and diagnosis of HBV in low-income and middle-income countries. Nature Reviews Gastroenterology & Hepatology. 2016;13(11):643.
3. Chung WK. Chronic hepatitis in Korea. Progress in liver diseases. 1986;8:469.
4. Choi H, Kim Y, Park K, Lee S, Moon Y, Kang J, et al. Clinical study on distribution of hepatitis B virus markers in Korean population. Korean J Gastroenterol. 1983;15:163-71.
5. Chen D-S. From hepatitis to hepatoma: lessons from type B viral hepatitis. Science. 1993;262(5132):369-71.
6. McMahon BJ, Alberts SR, Wainwright RB, Bulkow L, Lanier AP. Hepatitis B–related sequelae: prospective study in 1400 hepatitis B surface antigen–positive Alaska native carriers. Archives of internal medicine. 1990;150(5):1051-4.
7. Weissberg JI, Andres LL, Smith CI, Weick S, Nichols JE, Garcia G, et al. Survival in chronic hepatitis B: an analysis of 379 patients. Annals of internal medicine. 1984;101(5):613-6.
8. Fattovich G. Natural course and prognosis of chronic hepatitis type B. Viral Hep Rev. 1996;2:263-76.
9. Marcellin P, Gane E, Buti M, Afdhal N, Sievert W, Jacobson IM, et al. Regression of cirrhosis during treatment with tenofovir disoproxil fumarate for chronic hepatitis B: a 5-year open-label follow-up study. The Lancet. 2013;381(9865):468-75.
10. Chang TT, Liaw YF, Wu SS, Schiff E, Han KH, Lai CL, et al. Long‐term entecavir therapy results in the reversal of fibrosis/cirrhosis and continued histological improvement in patients with chronic hepatitis B.
Hepatology. 2010;52(3):886-93.
11. Dasarathy S. Consilience in sarcopenia of cirrhosis. Journal of cachexia, sarcopenia and muscle. 2012;3(4):225-37.
12. O'Brien A, Williams R. Nutrition in end-stage liver disease: principles and practice. Gastroenterology. 2008;134(6):1729-40.
13. Elkina Y, von Haehling S, Anker SD, Springer J. The role of myostatin in muscle wasting: an overview. Journal of cachexia, sarcopenia and muscle. 2011;2(3):143-51.
14. Springer J, Adams V, Anker SD. Myostatin: regulator of muscle wasting in heart failure and treatment target for cardiac cachexia. Am Heart Assoc; 2010.
15. Lee Yh, Kim SU, Song K, Park JY, Ahn SH, Lee BW, et al. Sarcopenia is associated with significant liver fibrosis independently of obesity and insulin resistance in nonalcoholic fatty liver disease: Nationwide surveys (KNHANES 2008‐2011). Hepatology. 2016;63(3):776-86.
16. Studenski SA, Peters KW, Alley DE, Cawthon PM, McLean RR, Harris TB, et al. The FNIH sarcopenia project: rationale, study description, conference recommendations, and final estimates. J Gerontol A Biol Sci Med Sci. 2014;69(5):547-58.
17. McLester CN, Nickerson BS, Kliszczewicz BM, McLester JR. Reliability and agreement of various InBody body composition analyzers as compared to dual-energy X-ray absorptiometry in healthy men and women. Journal of Clinical Densitometry. 2018.
18. Kim SU, Kim JK, Park JY, Ahn SH, Lee JM, Baatarkhuu O, et al. Variability in liver stiffness values from different intercostal spaces. Liver Int. 2009;29(5):760-6.
19. Chon YE, Jung KS, Kim SU, Park JY, Park YN, Kim DY, et al. Controlled attenuation parameter (CAP) for detection of hepatic steatosis in patients with chronic liver diseases: a prospective study of a native Korean population. Liver Int. 2014;34(1):102-9.
Clinical and molecular hepatology. 2012;18(2):163-73.
21. Carvalhana S, Leitão J, Alves AC, Bourbon M, Cortez‐Pinto H. How good is controlled attenuation parameter and fatty liver index for assessing liver steatosis in general population: correlation with ultrasound. Liver International. 2014;34(6):e111-e7.
22. Oh SW. Obesity and metabolic syndrome in Korea. Diabetes & metabolism journal. 2011;35(6):561-6.
23. Iwasa M, Sugimoto R, Yoshikawa K, Miyachi H, Mifuji-Moroka R, Tanaka H, et al. Change in skeletal muscle mass after administering entecavir in patients with hepatitis B. Nutrition. 2015;31(9):1173-4.
24. Sugimoto R, Iwasa M, Hara N, Tamai Y, Yoshikawa K, Ogura S, et al. Changes in liver function and body composition by direct‐acting antiviral therapy for hepatitis C virus infection. Hepatology Research. 2018;48(5):337-44.