저작자표시-비영리-변경금지 2.0 대한민국 이용자는 아래의 조건을 따르는 경우에 한하여 자유롭게 l 이 저작물을 복제, 배포, 전송, 전시, 공연 및 방송할 수 있습니다. 다음과 같은 조건을 따라야 합니다: l 귀하는, 이 저작물의 재이용이나 배포의 경우, 이 저작물에 적용된 이용허락조건 을 명확하게 나타내어야 합니다. l 저작권자로부터 별도의 허가를 받으면 이러한 조건들은 적용되지 않습니다. 저작권법에 따른 이용자의 권리는 위의 내용에 의하여 영향을 받지 않습니다. 이것은 이용허락규약(Legal Code)을 이해하기 쉽게 요약한 것입니다. Disclaimer 저작자표시. 귀하는 원저작자를 표시하여야 합니다. 비영리. 귀하는 이 저작물을 영리 목적으로 이용할 수 없습니다. 변경금지. 귀하는 이 저작물을 개작, 변형 또는 가공할 수 없습니다.
Effects of Sirtuin 2 on Hepatitis B
Virus Replication
Ajou University Graduate School
Department of Biomedical Sciences
Effects of Sirtuin 2 on Hepatitis B
Virus Replication
by
Zahra Zahid Piracha
A Dissertation Submitted to the Graduate School of Ajou
University in Partial Fulfillment of the Requirement for the
Degree of
DOCTOR OF PHILOSOPHY
Supervised by
Kyongmin Kim, Ph.D.
Department of Biomedical Sciences
Ajou University Graduate School
Acknowledgements
First of All, I am thankful to Allah Almighty who blessed me with strength, will, knowledge and determination to complete this PhD’s degree.
I am thankful to my supervisor Kim Kyongmin for guiding me throughout this period and providing me with the direction and information needed for the research. She gave me opportunity to pursue this degree under her supervision and mentored my thinking process and research skills. Her kindness and insightful remarks were essential for successful completion of my degree here at Ajou University.
I am also grateful to my committee members for their support throughout this period and their insightful comments. I also thank my lab mates seniors, friends, teachers, colleagues and mentors for their help and belief in me.
I would like to express my sincere thanks to my husband, parents and siblings. Without their prayers and encouragement, I would not be able to complete this degree. They gave me motivation to achieve my goal to study abroad and it would be impossible without their support and love.
I
Sirtuin 2 (Sirt2), a NAD+-dependent protein deacetylase, is
overexpressed in many hepatocellular carcinomas (HCCs) and can deacetylate many proteins, including tubulins and AKT prior to AKT activation. Here, we found that endogenous Sirt2 was upregulated in hepatitis B virus (HBV) WT-replicating cells, leading to tubulin deacetylation; however, this was not the case in HBV replication-deficient mutant-transfected cells and 1.3mer HBV WT-transfected plus reverse transcriptase inhibitor (entecavir or lamivudine) treated cells but all HBV proteins are expressed. In HBV WT-replicating cells, upregulation of Sirt2 induced AKT activation, which consequently downregulated glycogen synthase kinase (GSK-3β) and increased β-catenin levels; however, downregulation of Sirt2 in HBV non-replicating cells impaired AKT/GSK-3β/β-catenin signaling. Overexpression of Sirt2 isoform 1 stimulated HBV transcription and consequently HBV DNA synthesis, which in turn activates AKT and consequently increases β-catenin levels, possibly through physical interactions with Sirt2 and AKT. Knockdown of Sirt2 by shRNAs or inhibition by AGK2 or dominant-negative mutant expression inhibited HBV replication, reduced AKT activation, and decreased β-catenin levels. The deacetylase inactive isoform 5 of Sirt2 (Sirt2.5) also showed inhibited HBV replication from transcription and failed to activate AKT/GSK-3β/β-catenin signaling. Both the Sirt2.1 and Sirt2.5 are recruited to cccDNA but Sirt2.5 showed more recruitment. Through HBV infection, we demonstrated that Sirt2 knockdown inhibited HBV replication from transcription. Although HBx itself activates AKT and upregulates β-catenin,
II
Sirt2-mediated signaling and upregulated HBV replication were HBx-independent. Since constitutively active AKT inhibits HBV replication, the results suggest that upregulated Sirt2 and activated AKT may balance HBV replication to prolong viral replication, eventually leading to development of HCC. Also, the results indicate that Sirt2 inhibition may be a new therapeutic option for controlling HBV infection and preventing HCC.
Key words: Sirt2, isoforms of Sirt2, HBV replication, AKT, GSK-3β, β-catenin, cccDNA
III
Abstract ... I
Table of contents ... III
List of figures ... VII
List of tables ... IX
Introduction ... 1
Materials and Methods ... 5
A. Vector construction ... 5
B. Cell culture, DNA transfection, and core particle
immunoblotting ... 8
C. Stable cell lines ... 10
D. Northern, Southern, and nucleic acid blotting ... 11
E. SDS-PAGE and Western blotting ... 12
IV
G. Entecavir and lamivudine treatment ... 13
H. Reverse transcriptase (RT)-PCR ... 14
I. Co-immunoprecipitation ... 14
J. HBV preparation and infection ... 15
K. Fractionation of Sirt2 isoforms and HDAC6 ... 16
L. Luciferase reporter assay ... 17
M. cccDNA extraction ... 17
N. cccDNA chromatin immunoprecipitation ... 18
O. Statistical analysis ... 20
Results ... 21
A. HBV replication upregulates endogenous Sirt2, leading to
deacetylation of α-tubulin ... 21
B. Overexpression of Sirt2 isoform 1 upregulates HBV
replication ... 29
C. Overexpression of Sirt2.1 increases HBV transcriptional
activity ... 35
D. HBV replication is downregulated when Sirt2 is inhibited or
knocked down ... 39
V
F. Expression of replication-deficient mutant HBV impairs Sirt2
activity ... 46
G. Increased expression of Sirt2 in HBV-replicating cells
activates the AKT/GSK-3β/β-catenin signaling pathway
via the AKT/Sirt2 interaction ... 51
H. Sirt2-mediated upregulation of HBV replication is
independent of HBx ... 55
I. AKT/GSK-3β/β-catenin signaling is downregulated in HBV
replication-deficient mutant-transfected, entecavir-treated,
Sirt2 DN mutant-overexpressing, and Sirt2-inhibited
cells ... 60
J. Overexpression of Sirt2.5 downregulates HBV replication ... 67
K. Overexpression of Sirt2.5 decreases HBV transcriptional
activity ... 71
L. Sirt2.5 was inactive for activating AKT/GSK-3β/β-catenin
signaling pathway ... 77
M. Sirt2.5-mediated downregulation of HBV replication is
VI
N. Nuclear export sequence and catalytic domains of Sirt2.1 are
important for increasing HBV replication ... 83
O. Sirt2.1 and Sirt2.5 are recruited to HBV cccDNA ... 89
Discussion ... 92
VII
Title of Figure
page no
Figure 1. Sirt2 is upregulated and α-tubulin is deacetylated in HBV
WT-replicating cells but not in HBV replication-deficient
mutant-expressing cells. ... 25
Figure 2. Overexpression of Sirt2.1 increases HBV replication . 31
Figure 3. Transcription of HBV RNA increases upon
overexpression of Sirt2.1 ... 36
Figure 4. Inhibition or knockdown of Sirt2 reduces HBV
replication ... 42
Figure 5. Replication of HBV WT is inhibited by overexpression
of a Sirt2.1 dominant-negative (DN) mutant, and HBV
replication-deficient mutant expression impairs Sirt2
activity ... 48
Figure 6. HBV replication increases Sirt2-mediated
AKT/GSK-3β/β-catenin signaling via the AKT/Sirt2 interaction ... 53
Figure 7. Sirt2-mediated upregulation of HBV replication is
VIII
Figure 8. AKT/GSK-3β/β-catenin signaling is downregulated in
HBV non-replicating, Sirt2 knockdown, Sirt2
DN-overexpressing, or Sirt2 inhibited cells ... 62
Figure 9. Overexpression of Sirt2.5 decreases HBV replication . 68
Figure 10. Transcription of HBV RNA decreases upon
overexpression of Sirt2.5. ... 73
Figure 11. HBV replication decreases Sirt2.5-mediated
AKT/GSK-3β/β-catenin signaling ... 79
Figure 12. Nuclear export signal and catalytic domain are
important for increasing HBV replication ... 85
Figure 13. Sirt2.1 and Sirt2.5 are recruited to HBV cccDNA ... 90
Figure 14. Model of Sirt2.1 and Sirt2.5 interaction with AKT and
effects on HBV replication and cccDNA synthesis ... 96
IX
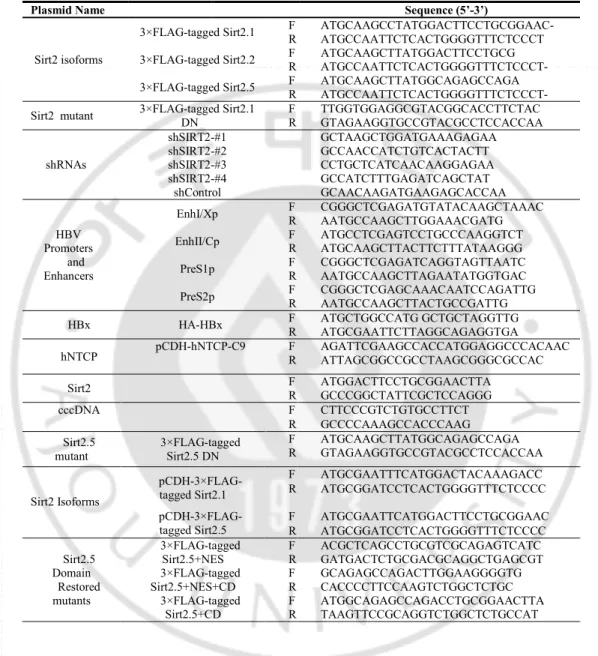
Table 1. The primer sequences used for the vector construction and
PCR. ... 7
1
Introduction
Hepatitis B virus (HBV) infection can cause acute and chronic hepatitis, cirrhosis, and primary hepatocellular carcinoma (HCC). Chronic infection with HBV is a major health problem worldwide, even though an effective vaccine is available. HBV belongs to the Hepadnaviridae family and has a 3.2 Kbp partially double-stranded relaxed circular (RC) DNA genome (Summers et al., 1982). The virus has a specific tropism for liver cells, i.e., it is hepatotropic. The HBV life cycle has been studied extensively, but the host factors involved in HBV replication and the mechanisms underlying HBV-associated HCC are not completely understood. During the HBV life cycle, viral infection of hepatocytes occurs through binding to heparan sulfate, followed by the sodium taurocholate co-transporting polypeptide (NTCP) receptor for virion entry (Yan et al., 2012). This is followed by uncoating of the envelope and transport of the core particle (capsid or nucleocapsid) through microtubules to the perinuclear region and finally to the nuclear pore complex (NPC) (Kann et al., 2007). Upon reaching the NPC, the core particle dissociates and releases the partially double-stranded RC DNA genome, which is then converted to covalently closed circular DNA (cccDNA) (Köck et al., 2010). The cccDNA acts as a minichromosome and as a template for transcription of viral genes. Viral transcripts, mainly 3.5, 2.4, 2.1, and 0.7 kb in size, are produced from this viral minichromosome and then transported to the cytoplasm where they are translated to produce viral proteins, namely, viral
2
surface (HBs, S), core (HBc, C), viral polymerase (P), and X (HBx) proteins (Locarnini 2004). HBs includes large HBs (LHBs), middle HBs (MHBs), and small HBs (SHBs). HBx, a HBV oncoprotein, plays a role in development of HCC (Ringelhan et al., 2015).
The histone deacetylase (HDAC) superfamily comprises a vast array of enzymes in prokaryotes and mammals; these enzymes regulate post-translational modification. Mammalian HDACs are classified into four families: class I, IIa, IIb, and IV. In addition to these classical HDACs, there is another group of HDACs, called sirtuins (Sirts), which are sometimes classified as atypical class III HDACs (de Ruijter al., 2003). The mammalian Sirt family proteins (Sirt1 to Sirt7) are homologs of the yeast silent information regulator 2 (Sir2) protein and require nicotinamide adenine
dinucleotide (NAD+) as a cofactor (co-substrate) for their protein deacetylase
activity at acetylated lysine residues (Finnin et al., 2001; North et al., 2004). In yeast, Sir2 regulates aging by maintaining transcriptional silencing of the mating-type loci, the ribosomal DNA locus, and the telomeres (Blander et al., 2004). Among seven Sirts, Sirt1, Sirt2, and Sirt3 are closely related and classified as class I Sirts; they are localized mainly to the nucleus, cytoplasm, and mitochondria, respectively (Frye 2000). Sirt1, Sirt2, and Sirt3 are involved in HBV infection: Sirt1 is recruited to the HBV cccDNA minichromosome to increase HBV transcription and replication (Ren et al., 2014), whereas Sirt3 inhibits HBV replication by reducing cellular levels of reactive oxygen species (Ren et al., 2016). Sirt2 proteins aggravate post-ischemic liver injury (Wang et al., 2017), may induce hepatic fibrogenesis through the Sirt2/ERK/c-myc pathway (Arteaga et al., 2016), and are overexpressed in many HCCs (Chen et al., 2013, Xie et al., 2011). Recently, it has been reported that HBx
3
upregulates Sirt2 expression and Sirt2 has a positive role in HBV replication and HBV-induced HCC (Cheng et al., 2018).
Sirt2 substrates include α-tubulin, histone H4K16, p53, FOXO3, and
p65 (North et al., 2004, Rothgiesser et al., 2010, Wang et al., 2012,
Bosch-Presegué et al., 2011). Sirt2 is active mainly in the cytoplasm where it
deacetylates α-tubulin in microtubules (North et al., 2003). Deficiency of Sirt2
causes mitotic cell death and a high tendency toward development of gender-specific tumors (Kim et al., 2011). Also, Sirt2 expression is downregulated in gliomas (Hiratsuka et al., 2003). These contradictory roles in different tumors suggest that Sirt2 may have a dual function as a tumor suppressor (Kim et al., 2011, Hiratsuka et al., 2003) and progressor (Chen et al., 2013, Xie et al., 2011).
Sirt2 interacts physically with AKT (protein kinase B, PKB), which is critical for complete activation of AKT (Ramakrishnan et al., 2014). For complete AKT activation, deacetylation by Sirt2 is also required (Chen et al., 2013). AKT, a downstream target of phosphatidylinositol 3-kinase (PI3K), is a main component in the signal transduction pathway that regulates a number of cellular processes, including proliferation, differentiation, and survival (Boyault et al., 2007). The PI3K/AKT pathway is regulated by growth factors that activate PI3K, which in turn phosphorylates phosphatidylinositol-4,5-bisphosphate (PIP2) to form phosphatidylinositol-3,4,5-trisphosphate (PIP3). PIP3 acts as a docking site for AKT and facilitates the subsequent phosphorylation of AKT at threonine 308 (pT308) by phosphoinositide-dependent kinase 1. Complete activation of AKT also requires phosphorylation at serine 473 (pS473) (Courtney et al., 2010, Engelman et al., 2009). It is generally believed that activation of the PI3K-AKT pathway by
4
viruses inhibits apoptosis and promotes survival of infected cells to favor viral replication (Rawat and Bouchard, 2015, Cooray 2004).
Even though it has been shown that Sirt2 increases HBV replication (Cheng et al., 2018), the underlying signaling mechanism and the effects of HBV expression and/or DNA synthesis on Sirt2 expression have not been investigated in detail. Here, we examined the effects of Sirt2 isoform 1 on HBV transcription and replication. The results showed that HBV replication upregulates Sirt2.1, but replication-deficient HBV mutant expression impairs Sirt2 activity. We also demonstrated that overexpression of Sirt2.1 further promotes HBV transcription and replication, which are independent of HBx, and that inhibition or knockdown of Sirt2 inhibits HBV transcription and replication. Next, we examined the effects of Sirt2 isoform 5 (Sirt2.5) on HBV transcription and replication. The results showed that HBV replication downregulates when Sirt2.5 is overexpressed. Compare to Sirt2.1, Sirt2.5 recruited at significantly higher levels to cccDNA. Furthermore, the results highlight the importance of the Sirt2-mediated AKT/glycogen synthase kinase (GSK-3β)/β-catenin signaling pathway for HBV replication. Finally, we suggest that Sirt2 may be a new therapeutic target for controlling HBV infection and preventing progression to HCC.
5
Materials and Methods
A. Vector Construction
A HBV WT plasmid from subtype adwR9 was used, in which transcription of pgRNA is controlled by the CMV IE promoter (Kim et al., 2004). Also, HBV replication-deficient TP-Y65F (priming reaction-deficient) and RT-YMHA (RT reaction-deficient) mutants (Kim et al., 2004) were used. Subtype ayw, a replication-competent 1.3mer from HBV WT, and HBx-deficient mutant plasmids were kind gifts from Dr. Ryu WS (Yonsei University, South Korea). Human NTCP-C9 construct in pcDNA6.1 was a kind gift from Dr. Li W (Yan et al., 2012). From this construct, pCDH-hNTCP-C9 was generated using the primers listed in Table 1. The GFP-tagged Sirt2.1 and Myc-tagged HDAC6 plasmids were kindly provided by Dr. Lee KW (Chonnam National University, South Korea) (Han et al., 2008). The 3×FLAG-tagged Sirt2.1 construct was generated from GFP-tagged Sirt2.1 using the primers listed in Table 1. The 3×FLAG-tagged Sirt2.2 and 2.5 constructs were generated from the 3×FLAG-tagged Sirt2.1 construct using the primers listed in Table 1. To construct a DN mutant of Sirt2.1, the codon encoding the catalytic histidine (CAC) at position 187 was mutated to tyrosine (TAC) by PCR-based site-directed mutagenesis using mutagenic primers (see Table 1). To generate short hairpin RNA (shRNA) containing constructs targeting the SIRT2 gene, four optimal 21mer RNAs were selected from
6
human SIRT2 and one 21mer RNA (random RNA) was selected as a control. The sequences of shSIRT2-#1, shSIRT2-#2, shSIRT2-#3, shSIRT2-#4, and control shRNA are listed in Table 1. To perform the luciferase reporter assay to examine HBV transcription, luciferase reporter vectors containing respective enhancers and/or promoters were constructed. The primers used to amplify respective enhancers and/or promoters from the HBV (adwR9) backbone are listed in Table 1. HA-HBx WT was constructed by PCR generated amplification of a HBx sequence (Table 1). To construct a DN mutant of Sirt2.5, the codon encoding the catalytic histidine (CAC) at position 117 was mutated to tyrosine (TAC) by PCR-based site-directed mutagenesis using mutagenic primers (see Table 1). For the restoration of Nuclear Export Signal (NES), NES and Catalytic Domain (CD), and CD in 3×FLAG-tagged Sirt2.5, primers used are enlisted in table 1. Lentiviral vectors encoding 3×FLAG-tagged Sirt2.1 and 3×FLAG-tagged Sirt2.5 were generated by inserting EcoRI/BamHI-digested 3×FLAG-tagged Sirt2.1 DNA and 3×FLAG-tagged Sirt2.5 DNA fragments into linearized pCDH-CMV-MCS-EF1-Puro (System Biosciences, CD510B-1), yielding pCDH-3×FLAG-tagged Sirt2.1 and pCDH-3×FLAG-pCDH-3×FLAG-tagged Sirt2.5. All constructs were sequenced to confirm the presence of specific mutations and the absence of extraneous mutations.
7
Table 1. The primer sequences used for the vector construction and PCR
Plasmid Name Sequence (5’-3’)
Sirt2 isoforms
3×FLAG-tagged Sirt2.1 F R ATGCAAGCCTATGGACTTCCTGCGGAAC- ATGCCAATTCTCACTGGGGTTTCTCCCT 3×FLAG-tagged Sirt2.2 F R ATGCAAGCTTATGGACTTCCTGCG ATGCCAATTCTCACTGGGGTTTCTCCCT- 3×FLAG-tagged Sirt2.5 F R ATGCAAGCTTATGGCAGAGCCAGA ATGCCAATTCTCACTGGGGTTTCTCCCT- Sirt2 mutant 3×FLAG-tagged Sirt2.1 DN F R TTGGTGGAGGCGTACGGCACCTTCTAC GTAGAAGGTGCCGTACGCCTCCACCAA
shRNAs shSIRT2-#1 GCTAAGCTGGATGAAAGAGAA shSIRT2-#2 GCCAACCATCTGTCACTACTT shSIRT2-#3 CCTGCTCATCAACAAGGAGAA shSIRT2-#4 GCCATCTTTGAGATCAGCTAT shControl GCAACAAGATGAAGAGCACCAA HBV Promoters and Enhancers
EnhI/Xp F R CGGGCTCGAGATGTATACAAGCTAAAC AATGCCAAGCTTGGAAACGATG EnhII/Cp F R ATGCCTCGAGTCCTGCCCAAGGTCT ATGCAAGCTTACTTCTTTATAAGGG
PreS1p F R CGGGCTCGAGATCAGGTAGTTAATC AATGCCAAGCTTAGAATATGGTGAC PreS2p F R CGGGCTCGAGCAAACAATCCAGATTG AATGCCAAGCTTACTGCCGATTG HBx HA-HBx F R ATGCTGGCCATG GCTGCTAGGTTG ATGCGAATTCTTAGGCAGAGGTGA
hNTCP pCDH-hNTCP-C9 F R AGATTCGAAGCCACCATGGAGGCCCACAAC ATTAGCGGCCGCCTAAGCGGGCGCCAC Sirt2 F R ATGGACTTCCTGCGGAACTTA GCCCGGCTATTCGCTCCAGGG
cccDNA F CTTCCCGTCTGTGCCTTCT
R GCCCCAAAGCCACCCAAG Sirt2.5
mutant 3×FLAG-tagged Sirt2.5 DN
F R ATGCAAGCTTATGGCAGAGCCAGA GTAGAAGGTGCCGTACGCCTCCACCAA Sirt2 Isoforms pCDH-3×FLAG-tagged Sirt2.1 F ATGCGAATTTCATGGACTACAAAGACC R ATGCGGATCCTCACTGGGGTTTCTCCCC
pCDH-3×FLAG-tagged Sirt2.5 F R ATGCGAATTCATGGACTTCCTGCGGAAC ATGCGGATCCTCACTGGGGTTTCTCCCC Sirt2.5 Domain Restored mutants 3×FLAG-tagged Sirt2.5+NES 3×FLAG-tagged Sirt2.5+NES+CD 3×FLAG-tagged Sirt2.5+CD F R F R F R ACGCTCAGCCTGCGTCGCAGAGTCATC GATGACTCTGCGACGCAGGCTGAGCGT GCAGAGCCAGACTTGGAAGGGGTG CACCCCTTCCAAGTCTGGCTCTGC ATGGCAGAGCCAGACCTGCGGAACTTA TAAGTTCCGCAGGTCTGGCTCTGCCAT
8
B. Cell culture, DNA transfection, and core particle
immunoblotting
Huh7, HepG2, HepG2-hNTCP-C9, and HEK293T cells were maintained in Dulbecco’s modified Eagle’s medium supplemented with 1% penicillin-streptomycin, and 10% fetal bovine serum (FBS, Gibco BRL) in a
humidified atmosphere (37°C/5% CO2). HEK293T cells were passaged every
second day, and other cells were passaged every third day. HepG2.2.15 cells were grown as described above, with the addition of G418 (0.5 mg/ml) for selection. HepAD38 cells (a kind gift of Dr. Seeger C, Fox Chase Cancer Center) were grown as described above, with the addition of tetracycline (1 µg/ml). Tetracycline was then removed to induce HBV transcription. To produce HBV inoculum for infection experiment, HepAD38 cells were cultured, as described previously (Watashi et al., 2013). To examine the effects
of Sirt2.1 and Sirt2.5 on cccDNA levels, 3 × 10⁶ stable
HepAD38-3×FLAG-Sirt2.1 or –3×FLAG-Sirt2.5 stable cells were plated in 6 cm dishes, the medium was replaced with fresh medium without tetracycline the next day, and the cells were harvested at the indicated times.
For transfection into Huh7 and HEK293T cells, 4 µg of plasmid construct was mixed with 24 µg/µl polyethylenimine (PEI, Polysciences) and
200 µl of Opti-MEM (Gibco) and poured into 1×10⁶ Huh7 or HEK293T cells
(in 6 cm plates) 24 h after cell seeding. For co-transfection into Huh7 (1×10⁶)
cells in 6 cm culture plates, 4 µg of 3×FLAG-Sirt2.1 or DN mutant construct and/or 4 µg of 3×FLAG-Sirt2.5 or DN mutant construct and/or 4 µg of HBV WT or HBV mutant (TP-Y65F and RT-YMHA) under the control of the CMV IE promoter, or the 1.3mer from HBV WT, were mixed with 24 µg/µl PEI (Polysciences) and 200 µl of Opti-MEM (Gibco) and poured onto the cells 24
9
h after seeding. For co-transfection into HepG2 (3×10⁶) cells (in 6 cm culture
plates), 4 µg of Sirt2.1 or DN mutant and/or 4 µg of 1.3mer from HBV WT or the HBx-deficient mutant, and/or 4 µg of Sirt2.5 and/or 4 µg of 1.3mer from HBV WT or the HBx-deficient mutant were mixed with 32 µg/µl PEI and 200 µl of Opti-MEM. To examine the effects of Sirt2 isoforms and domain restored mutants of Sirt2.5 on HBV replication, Huh7 cells were co-transfected (in 6 cm plates) with 4 µg of either Sirt2.1, Sirt2.2, Sirt2.5, Sirt2.5+NES, Sirt2.5+NES+CD or Sirt2.5+CD (3×FLAG-tagged) and 4 µg of 1.3mer from HBV WT were mixed with 24 µg/µl PEI and 200 µl of Opti-MEM. pcDNA3 was used to adjust the amount of transfected DNA. At 24 h post-transfection, cell culture medium containing transfected DNA was refreshed, and cells were harvested at 72 h post-transfection. Cells were lysed using 0.2% NP-40 (IGEPAL, Sigma-Aldrich)-TNE (10 mM Tris-HCl [pH 8.0], 50 mM NaCl, 1 mM EDTA) buffer as described previously (Kim et al., 2004). Then, 4% of the total lysate was electrophoresed in 1% native agarose gels and resolved core particles were transferred to polyvinylidene fluoride (PVDF) membranes (Millipore). Immunoblotting to visualize core particles was performed using a polyclonal rabbit anti-HBc primary antibody (1:1,000 dilution) (generated in-house) (Jung et al., 2014), followed by a horseradish peroxidase-conjugated anti-rabbit secondary antibody (1:5,000 dilution) (Thermo Fisher Scientific). Bound secondary antibodies were visualized using enhanced chemiluminescence (ECL Western blotting detection reagent; Amersham). The relative intensities of core particles were measured using ImageJ. 1.46r.
10
C. Stable cell lines
HepG2-hNTCP-C9 stable cells were generated following the previously reported methods (Nkongolo et al., 2014). A lentiviral expression system was utilized to generate Huh7- , HepG2-, and HepG2-hNTCP-C9 derived Sirt2 knockdown cells. Briefly, HEK293T cells were seeded on 6 cm plates and transfected with 0.5 µg of pVSV-G, 1.5 µg of pGAG-Pol, and 2 µg of the corresponding H1-Puro-shSIRT2 (shSIRT2-#1–4) or pSIH1-H1-Puro-shControl in 12 µg/µl PEI and 200 µl of Opti-MEM. One day after transfection, the medium was changed and cells were incubated for a further 36 h. The supernatant containing pseudoviral particles and shRNAs was harvested at 2 days post-transfection, and 2 ml of supernatant and 2 ml of fresh culture medium were mixed and used to infect Huh7, HepG2, or HepG2-hNTCP-C9 cells using 10 µg of polybrene (Hexadimethrine bromide, Sigma-Aldrich). Media were changed at 24 h post-infection, and infected cells were reseeded onto new culture plates for selection using 2 µg/ml puromycin (Sigma-Aldrich) (for 72 h); this generated Sirt2 knockdown Huh7-shSIRT2-#1–4 and Huh7-shControl cells, HepG2-shSIRT2-Huh7-shSIRT2-#1–4 and HepG2-shControl cells, and shSirt2-#2–3 and HepG2-hNTCP-C9-shControl cells. To generate HepAD38 cells stably overexpressing 3×FLAG-tagged Sirt2.1 or 3×FLAG-3×FLAG-tagged Sirt2.5 cells were transfected as above, except that 2 μg of tagged Sirt2.1or 2 μg of pCDH-3×FLAG-tagged Sirt2.5 replaced the knockdown constructs. Pseudoviral particles containing 3×FLAG-tagged Sirt2.1 or 3×FLAG-tagged Sirt2.5 RNAs were inoculated into HepAD38 cells. Selection of cells was performed as described above.
11
D. Northern, Southern, and nucleic acid blotting
To analyze HBV RNA expression by Northern blotting, total RNA was extracted from Huh7 and HepG2 cells using Trizol reagent (Ambion, Invitrogen #15596026), according to the manufacturer’s instructions. Total RNA (20 µg) was denatured at 65°C for 10 min and electrophoresed on 1.2% agarose gels (Ultrapure Agarose, Invitrogen #16500500) containing formaldehyde (Sigma-Aldrich #F8775) and 1× MOPS buffer (200 mM MOPS, 10 mM EDTA, 50 mM sodium acetate pH 7). RNA was then transferred to a nylon membrane (Roche, Sigma-Aldrich #11417240001) and
hybridized at 68°C for 4 h to a 32P-labeled random-primed probe specific for
the full length HBV sequence. Sirt2 RNA expression was also analyzed by
Northern blotting using a 32P-labeled random-primed probe specific for the
Sirt2 sequence. To analyze HBV DNA synthesis by Southern blotting, HBV DNA extracted from isolated core particles was separated on agarose gels, transferred to nylon membranes (Whatman #10416296), and hybridized to a
32P-labeled random-primed probe specific for full length HBV, as described
previously (Kim et al., 2004). To analyze nucleic acid inside core particles of HBV, nucleic acid blotting was performed on the same PVDF membranes used for detection of core particles. Briefly, the PVDF membranes were treated for 10 s with 0.2 N NaOH and quickly washed with distilled water.
Membranes were then dried and hybridized with a 32P-labeled random-primed
12
E. SDS-PAGE and Western blotting
Equal quantities (measured in a Bradford Assay) of cell lysate (0.2% NP-40 (IGEPAL, Sigma-Aldrich)-TNE (10 mM Tris-HCl [pH 8.0], 50 mM NaCl, 1 mM EDTA) were subjected to sodium dodecyl sulfate-polyacrylamide gel electrophoresis (SDS-PAGE) on 10% gels. Resolved proteins were then transferred to PVDF membranes and incubated with the appropriate primary antibodies (rabbit polyclonal anti-HBc [1:1,000], rabbit polyclonal HBs [1:1,000] (Virostat Inc. #1811), mouse monoclonal anti-FLAG M2 [1:1,000] (Sigma #F1804), polyclonal rabbit anti-Sirt2 (H-95) [1:1,000] (Santa Cruz #sc-20966), rabbit polyclonal anti-HDAC6 [1:1,000] (Santa Cruz #sc-11420), mouse monoclonal anti-GAPDH [1:5,000] (Santa Cruz #sc-32233), mouse monoclonal anti-α-tubulin (TU-02) [1:5,000] (Santa Cruz #sc-8035), monoclonal anti-acetylated α-tubulin clone 6-11B-1 [1:1,000] (Sigma-Aldrich #T 6793), rabbit polyclonal anti-H3 [1:5,000] (Abcam #ab1791), mouse monoclonal anti-HA (HA.C5) [1:1,000] (Abcam #ab18181), mouse monoclonal anti-GSK-3β [1:1,000] (Santa Cruz #11B9), rabbit monoclonal anti-phospho-GSK-3β (Ser 9) [1:1,000] (Cell Signaling Technology #9336), rabbit monoclonal anti-β-catenin [1:1,000] (Cell Signaling Technology #D10A8), rabbit monoclonal anti-phospho-β-catenin (S552) [1:1,000] (Cell Signaling Technology #D8E11), rabbit polyclonal anti-AKT [1:1,000] (Cell Signaling Technology #9272S), rabbit phospho-AKT (T308) [1:1,000] (Cell Signaling Technology #9275S), rabbit anti-phospho-AKT (S473) [1:1,000] (Cell Signaling Technology #9271S), or mouse anti-rhodopsin monoclonal anti-C9 [1:1,000] (Millipore#MAB5356), followed by anti-rabbit secondary antibodies coupled to horseradish peroxidase (1:5,000 dilution) (Thermo Fisher Scientific) or anti-mouse
13
secondary antibodies coupled to horseradish peroxidase (1:5,000 dilution) (Thermo Fisher Scientific). The blots were then visualized by ECL. The relative band intensities were measured using ImageJ. 1.46r.
F. AGK2 treatment
To examine the effects of a Sirt2 inhibitor on HBV replication, AGK2 (Sigma-Aldrich #A8231) (Outeiro et al., 2007) was dissolved in DMSO. In brief, Huh7 or HepG2 cells were seeded onto 6 cm plates, and transiently transfected with the 4 µg of 1.3mer HBV WT (ayw) or 4 µg of 1.3mer HBV WT (ayw) plus 4 µg of 3×FLAG-Sirt2.1 construct (as described above). Cells were exposed to 10 µM AGK2 at the time of transfection. Lysates were prepared at both 72 h post-transfection and post-treatment. Cytotoxic effects of AGK2 were determined in an MTT assay, as described previously (Jung et al., 2015).
G. Entecavir and lamivudine treatment
To examine the endogenous Sirt2 expression upon HBV DNA synthesis, the RT inhibiting nucleoside analogs entecavir (Sigma-Aldrich #SML1103) and lamivudine (Sigma-Aldrich #L1295) were dissolved in PBS. HepG2 cells onto 6 cm plates were transiently transfected with the 4 µg of 1.3mer HBV WT (ayw) (as described above). At 24 h post-transfection, the cells were treated with 1 µM entecavir or 5 µM lamivudine for 48 h. Lysates were prepared at 72 h post-transfection. HepG2-hNTCP-C9 cells seeded on the 6 well plates and infection was performed as described in ‘HBV
14
preparation and infection’. Cells were treated with 1 µM entecavir at the day
of infection or one day post-infection.
H. Reverse transcriptase (RT)-PCR
To analyze Sirt2 mRNA expression by RT-PCR, total RNA was extracted as described above in ‘Northern, Southern, and nucleic acid
blotting’. cDNA was synthesized from the extracted RNA (1 µg) using oligo
dT and RevertAid RT (Fermentas, #EP0739) and then PCR was performed using Sirt2 primers (Table 1), amplifying 420 bp of Sirt2 DNA fragment. Amplified DNA amount was analyzed by Quantity One software (BioRad) and ImageJ. 1.46r.
I. Co-immunoprecipitation
Huh7 cells were transfected with pcDNA3 and the 3×FLAG-tagged Sirt2.1 construct or with the 1.3mer HBV WT (ayw) plus the 3×FLAG-tagged Sirt2.1 construct. Cells were harvested 3 days after transfection. To determine the physical interaction between AKT and Sirt2, cell lysates were immunoprecipitated with mouse monoclonal anti-FLAG M2 and immunoblotted with rabbit polyclonal anti-AKT antibodies. Mouse normal IgG (Merck Millipore #12-371) was used as a negative control for immunoprecipitation. The lysates were subjected to SDS-PAGE on 10% gels and then transferred to PVDF membranes for immunoblotting with primary antibodies (Flag M2, GAPDH, and AKT), followed by anti-mouse or anti-rabbit secondary antibodies coupled to horseradish peroxidase. Immunoblots were visualized by enhanced chemiluminescence (ECL Western
15
blotting detection reagent; Amersham). To examine the interaction between 3×FLAG-tagged Sirt2.5 and AKT in HEK293T cells, cells were transfected with pcDNA3 and the 3×FLAG-tagged Sirt2.1 construct or with pcDNA3 and 3×FLAG-tagged Sirt2.5. Cells were harvested 3 days after transfection and immunoprecipitated as above.
J. HBV preparation and infection
The HBV inoculum for infection was harvested from HepAD38 cells as described previously with minor modifications (Watashi et al., 2013, Ko et al., 2014). Briefly, cells were grown in Glutamax DMEM supplemented with 10% FBS, 0.5 mg/ml G418, 50 µM hydrocortisone hemisuccinate, 5 µg/ml insulin, 1% penicillin-streptomycin. Culture supernatant collected every third day from day 10 to 31 was concentrated through a 20–60% discontinuous sucrose gradient ultra-centrifugation (Beckman Coulter Optima L-90K). HBV DNA in the precipitant was quantitated by Southern blotting. For HBV
infection, 2×10⁵ of HepG2, C9-shControl,
HepG2-hNTCP-C9-shSirt2-#2, and HepG2-hNTCP-C9-shSirt2-#3 cells were seeded in collagen-coated (Corning#354249) 6-well plates and infected with HBV at
1.7×10³ genome equivalents (GEq) per cell in the medium containing 4%
polyethylene glycol (Affymetrix#25322-68-3), as described previously (Ni et al., 2014). One day after infection, the cells were washed thoroughly with PBS to remove the residual HBV and were maintained in the same medium containing 2.5% dimethyl sulfoxide, as described previously (Ni et al., 2014). The medium was changed every other day. For Northern blot analysis, total cell lysates were prepared at 5 days post-infection. Lysates were prepared at 9
16
days post-infection and subjected to SDS-PAGE and immunoblotting, core particle immunoblotting, and Southern blot analysis as described above.
K. Nuclear and cytoplasmic fractionation
HEK293T cells were transfected with 4 µg of the respective Sirt2 isoforms or a HDAC6-encoding vector as described above in ‘Cell culture,
DNA transfection, and core particle immunoblotting’. At 24, 36, and 72 h
post-transfection, cells were harvested and resuspended in 200 µl of cold harvest buffer (10 mM HEPES pH 7.9, 50 mM NaCl, 0.5 M sucrose, 0.1 mM EDTA, 0.5% Triton X-100, 10 mM NaF, and freshly added 1 mM DTT). The cytoplasmic and nuclear fractions were prepared according to the Genetex protocol “Fractionation of membrane / cytoplasmic and nuclear proteins”. Briefly, pelleted nuclei from total cell lysates were prepared by centrifugation at 1,200 g in a swinging bucket rotor for 10 min. The supernatant was transferred to a new tube and cleared at 13,000 rpm for 15 min to obtain cytoplasmic and membrane proteins. Next, 4 volumes of buffer C (10 mM HEPES pH 7.9, 500 mM NaCl, 0.1 mM EDTA, 0.1 mM EGTA, 0.1% NP-40) were added to the nuclei pellet and vortexed for 15 min at 4°C, and the nuclei was pelleted at 13,000 rpm for 10 min at 4°C. The supernatant from the nuclear extract was transferred to a new tube. For making the fractions of HEK293T cells were transfected with 4 µg of the respective Sirt2 isoforms and Sirt2 isoform 5 different domains restored mutants and harvested at 72 h post-transfection.
17
L. Luciferase reporter assay
HepG2 or Huh7 cells were co-transfected with luciferase report vectors (2 µg) pGL3-null, pGL3-EnhI/Xp, pGL3-EnhII/Cp, pGL3-PreS1p, or pGL3-PreS2p plus 2 µg of or pcDNA3 or Sirt2.1 or 3×FLAG-Sirt2.5. pGL3-EnhI/Xp, pGL3-EnhII/Cp, pGL3-PreS1p, or pGL3-PreS2p was transfected into shSIRT2-#2 and shSIRT2-#3 KD Huh7 cells. After 72 h, cells were lysed using luciferase cell culture lysis 5× reagent (Promega #E153A) and luciferase activity was analyzed using luciferin (Promega) and a luminometer (Molecular Devices).
M. cccDNA extraction
To examine the effect of Sirt2.1 and Sirt2.5 on HBV cccDNA formation, cccDNA was extracted through Hirt protein-free DNA extraction procedure, as described previously (Cai et al., 2013) with minor modifications. Briefly, HepAD38-3×FLAG Sirt2.1/Sirt2.5 stable cells at approximate 100 % confluence in collagen-coated 6-well plates with tetracycline containing medium were replaced with tetracycline depleted medium at 24 h post-seeding, incubated for 10 days, lysed with 0.6% SDS-TE buffer (10 mM Tris-HCl [pH 7.5], 10 mM EDTA) for 30 min at room temperature. The lysates
were treated with 5 M NaCl to final 1 M concentration for 16 h at 4°C and
centrifuged at 14,500 g for 30 min. Supernatant was subjected to two times of phenol extraction followed by one time of phenol/chloroform extraction, precipitated with ethanol, and analyzed by Southern blotting.
18
N. cccDNA chromatin immunoprecipitation
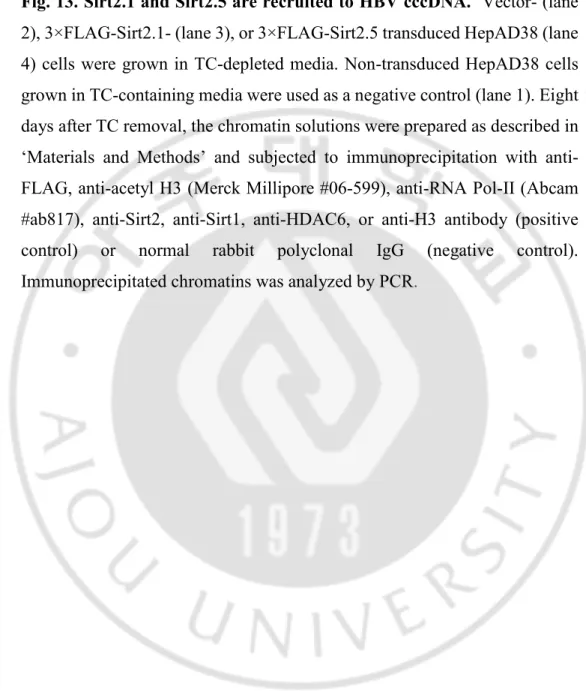
HBV cccDNA ChIP was performed as described previously (Belloni
et al., 2009) with minor modifications. Briefly, 1×10⁷ HepAD38 or
HepAD38-3×FLAG-Sirt2.1 or HepAD38-3×FLAG-Sirt2.5 stable cells were seeded on collagen-coated 10 cm plates with tetracycline containing medium and replaced with tetracycline depleted medium. Cells were maintained for 8 more days and lysed with 1 ml lysis buffer (0.5% NP-40, 50 mM Tris-HCl [pH 8.0], 100 mM NaCl, 1 mM EDTA). The lysates were centrifuged at 16,000 g for 2 min and the nuclear pellet was fixed with 1 ml of 1% formaldehyde containing buffer (20 mM Tris-HCl [pH 8.0], 20 mM KCl, 3
mM MgCl2, 1×protease inhibitor cocktail) for 30 min at 4℃. Fixed pellet
was subjected for centrifugation at 16,000 g for 2 min and lysed with 1 ml of SDS lysis buffer (1% SDS, 50 mM Tris-HCl [pH 8.1], 10 mM EDTA,
1×protease inhibitor cocktail). This chromatin solutions were sonicated
(Sonics & Materials Vibra-Cell VCX 400) for 5 cycles at an amplitude of
50% at 0.5 second (s) pulse during 45 s and place them for 45 s on ice (Pollicino et al., 2006). The sonicated chromatin solutions were centrifuged and 1/10 of that supernatants were diluted 1:10 with dilution buffer (1.1% Triton X-100, 0.01% SDS, 16.7 mM Tris-HCl [pH 8.1], 167 mM NaCl, 1.2 mM EDTA, 1×protease inhibitor cocktail), incubated with 50 μl of protein A/G-plus agarose beads for 1 h at 4℃ to reduce nonspecific bindings, and immunoprecipitated with 3 μg of anti-Sirt2, anti-Flag, anti-HDAC6, anti-H3
(for positive control), anti-AcH3 (Merck Millipore #06–599), anti-Sirt1
(Santa Cruz #sc-74465) or anti-RNA Pol-II antibodies (Abcam #ab817), or normal mouse or rabbit IgG (negative controls) overnight at 4°C, and centrifuged at 1,000 g for 5 min at 4°C to recover the immunoprecipitated
19
protein–DNA complexes in the pellet. The pellet was washed once with low salt buffer (1% Triton X-100, 0.1% SDS, 20 mM Tris-HCl [pH 8.1], 150 mM NaCl, 2 mM EDTA), three times with high salt buffer (as above, except with 500 mM NaCl), three times with LiCl buffer (1% deoxycholic acid, 1% NP-40, 10 mM Tris-HCl [pH 8.1], 1 mM EDTA, 0.25 M LiCl), and then twice with TE buffer. To elute protein–DNA complexes, elution buffer (1% SDS, 0.1 M NaHCO3) was added, vortexed, and incubated for 15 min at room temperature with rotation. To free DNA from protein–DNA complexes, reverse cross-linking was performed by adding 5 M NaCl to a final concentration of 1 M; the sample was then vortexed and incubated at 60°C for 4 h. Immunoprecipitated DNA was purified by proteinase K (Sigma-Aldrich #P2308) treatment, phenol–chloroform extraction, and ethanol precipitation, and then dissolved in nuclease-free water (Fermentas #R0581). Input samples were prepared separately from sonicated chromatin solutions. The input samples were treated with proteinase K (20 mg/ml) (Sigma-Aldrich #P2308), and then heated with shaking at 65°C for 4 h to reverse the cross-links. Input DNA was extracted with phenol–chloroform followed by ethanol precipitation in the presence of glycogen (5 mg/ml) and re-suspended in nuclease-free water. DNA concentration was adjusted to 50 µg after measurement of the OD260. Immunoprecipitated chromatin was analyzed by PCR (Applied Biosystems, GeneAmp PCR system 2700) using cccDNA-specific primers (Table 1) as specified by the manufacturer (Merck Millipore EZ ChIP #17-371).
20
O. Statistical analysis
Data were expressed as the mean ± standard deviation. Mean values were compared using Student’s t-test. P-values < 0.05 were considered statistically significant.
21
Results
A. HBV replication upregulates endogenous Sirt2, leading to
deacetylation of α-tubulin
Viruses modify the host environment to suit their own requirements and complete the life cycle. Viruses control the cellular gene transcription machinery either to activate genes that help them or to repress those that are hostile. Acetylation is an important phenomenon that controls gene transcription; hence it is speculated that viruses control this signaling pathway (Caron et al., 2003). Several viral proteins interact with histone acetyltransferases and histone deacetyltransferases to disrupt cellular acetylation signaling pathways (Caron et al., 2003). Similarly, acetylation of α-tubulin is linked to early fusion of HIV (Jeng at al., 2015). HDAC6 inhibits influenza virus replication by negatively regulating the assembly of viral components at the site of replication via acetylated microtubules (Husain et al., 2014). For efficient infection, as well as for early steps of HCV infection, a dynamic microtubule structure is required (Roohvand et al., 2009).
To determine the acetylation status of α-tubulin during the HBV life cycle, we examined α-tubulin acetylation in HBV-replicating HCC cells (i.e., stable HBV-expressing HepAD38 (Ladner et al., 1997) and HepG2.2.15 (Sells et al., 1987) cells), and in Huh7 cells transiently transfected with HBV WT in which replicative intermediate (RI) DNAs, including HBV RC,
double-22
stranded linear (DL), and single-stranded (SS) DNAs, are synthesized (Fig. 1A, bottom panel, lanes 2, 4, and 6). Acetylation of α-tubulin in cells containing replicating HBV was lower than that in respective non-replicating or mock controls (Fig. 1A, top panel, lane 1 vs. 2, lane 3 vs. 4, and lane 5 vs. 6). Of note, the α-tubulin level was constant (Fig. 1A, second panel). Since Sirt2 is a cytoplasmic α-tubulin deacetylase (North et al., 2003), endogenous Sirt2 mRNA and protein expressions were examined by Northern and Western blot analyses, respectively. The results showed that Sirt2 mRNA and protein expressions were upregulated when HBV was replicating (Fig. 1A, third and seventh panels, lanes 2, 4, and 6,).
To determine whether α-tubulin deacetylation and upregulated Sirt2 expression are linked to HBV DNA synthesis or HBV expression, we transfected Huh7 cells with HBV WT or replication-deficient TP-Y65F or RT-YMHA mutants. HBV TP-Y65F, a protein-priming reaction-deficient mutant, initiates minus-strand DNA without a primer, thereby synthesizing the short oligomers TGAA or GAA (the nascent minus-strand DNA); however, oligomer translocation and HBV minus-strand DNA elongation cannot occur, making the virus replication-deficient (Kim et al., 2004). Presence of HBV RT-YMHA, the conserved reverse transcriptase (RT) active YMDD motif in YMHA mutants, results in a RT-deficient, dead virus that does not support HBV DNA synthesis in vivo (Kim et al., 2004, Chang et al., 1990). Hence, TP-Y65F and RT-YMHA mutants show HBV RNA (Fig. 1B, eighth panel) and HBc protein expression (Fig. 1B, fourth panel), core particle formation (Fig. 1B, fifth panel), and pregenomic RNA (pgRNA) encapsidation (Fig. 1B, sixth panel), but cannot synthesize HBV RI DNAs (Fig. 1B, seventh panel, compare lane 2 vs. 3 and 4) (Kim et al., 2004). It should be mentioned here
23
that HBV pgRNAs of WT and replication-deficient mutants are expressed under the control of cytomegalovirus immediate early (CMV IE) promoter and subgenomic mRNAs are expressed under the control of their authentic promoters (Fig. 1B, eighth panel) (Kim et al., 2004). Consistent with Figure 1A (third panel), Sirt2 mRNA and protein expressions were upregulated markedly when HBV DNA was synthesized in HBV WT-transfected cells (Fig. 1B, third and bottom panels, lane 2); however, Sirt2 mRNA and protein levels were downregulated markedly in HBV replication-deficient mutant-transfected cells (Fig. 1B, third and bottom panels, lanes 3 and 4). Accordingly, α-tubulin was deacetylated in HBV WT-transfected cells when HBV DNA was synthesized (Fig. 1B, top panel, lane 2), whereas α-tubulin was deacetylated to a lesser extent in HBV replication-deficient mutant-transfected cells than in mock-mutant-transfected cells (Fig. 1B, top panel, lane 1 vs. 3 and 4). Of particular note, replication-deficient mutant-transfected cells have more decreased S mRNA levels than that of HBV WT-transfected cells (Fig. 1B, eighth panel, compare lane 2 vs. 3 and 4).
To further strengthen the above observation that α-tubulin deacetylation and upregulated Sirt2 expression are associated with HBV DNA synthesis, 1.3mer HBV WT-transfected HepG2 cells were treated with RT inhibitor, entecavir (1 µM) or lamivudine (5 µM), to inhibit HBV DNA synthesis from 24 to 72 h post-transfection (Fig. 1C, bottom panel, compare lane 2 vs. 3 and 4) (Doong et al., 1991, Abdelhamed et al., 2003). The results of an MTT
(3-[4,5-dimethylththiazol-2-yl]-2,5-diphenyltetrazolium bromide) assay has
revealed that neither entecavir nor lamivudine was cytotoxic (data not shown). Consistent with Figure 1B, Sirt2 expression was markedly
24
or lamivudine-treated cells than in mock-transfected cells (Fig. 1C, top panel and third panels, lane 1 vs. 3 and 4). This demonstrates that HBV replication increases Sirt2 expression, leading to α-tubulin deacetylation; however, HBV expression or RT inhibitor treatment without DNA synthesis inhibits Sirt2 expression, leading to α-tubulin acetylation.
26
27
Fig. 1. Sirt2 is upregulated and α-tubulin is deacetylated in HBV WT-replicating cells but not in HBV replication-deficient mutant-expressing cells. (A) Association between α-tubulin deacetylation and Sirt2 expression in
HBV-replicating stable HepAD38, HepG2.2.15, and HBV WT (4 µg)-transfected Huh7 cells. HepAD38 and tetracycline-removed HepAD38 cells (lanes 1 and 2), newly plated HepG2 and HepG2.2.15 cells (lanes 3 and 4), and transiently mock- and HBV WT-transfected Huh7 cells (lanes 5 and 6) were cultured for 72 h. (B) α-tubulin deacetylation and Sirt2 expression in HBV WT- and replication-deficient mutant-transfected Huh7 cells. At 72 h post-transfection, lysates were prepared from mock- (lane 1), HBV WT- (lane 2), TP-Y65F mutant- (lane 3), and RT-YMHA mutant-transfected Huh7 cells (lane 4). (C) α-tubulin deacetylation and Sirt2 expression in RT inhibitor-treated HBV WT-transfected HepG2 cells. 1.3mer HBV WT transfected HepG2 cells were treated with mock- (lane 2), 1 µM of entecavir (lane 3), or 5 µM of lamivudine (lane 4) at 24h post-transfection for 48 h. Lane 1 was mock-transfected HepG2 cell. SDS-PAGE and Western blotting (first–fourth panels), and native agarose gel electrophoresis and Western blotting (fifth panel), were performed to detect proteins and core particle formation, respectively (A–C). In situ nucleic acid blotting (B and C, sixth panel) was performed to detect all of the nucleic acids inside core particles. Southern and Northern blot analyses were performed to reveal HBV DNA synthesis (A–C, bottom, seventh, and bottom panels, respectively), HBV total RNA (B, eighth and bottom panels), and Sirt2 RNA level (Fig. A, seventh and bottom panels, lanes 5 and 6), respectively. Acetylated α-tubulin and α-tubulin, endogenous Sirt2, and HBc proteins were detected using monoclonal anti-acetylated tubulin clone 6-11B-1 [1:1,000] (Sigma-Aldrich #T 6793), mouse monoclonal
28
anti-α-tubulin (TU-02) [1:5,000] (Santa Cruz #sc-8035), polyclonal rabbit Sirt2 (H-95) [1:1,000] (Santa Cruz #sc-20966), and polyclonal rabbit anti-HBc [1:1,000] (Jung et al., 2012) antibodies, respectively. Tubulin was used as a loading control. For core particle formation, core particles on PVDF membranes were incubated with a polyclonal rabbit anti-HBc [1:1,000] (Jung et al., 2012) antibody. For Southern blotting, HBV DNA extracted from isolated core particles was separated, transferred to a nylon membrane,
hybridized with a random-primed 32P-labeled full length HBV-specific probe,
and subjected to autoradiography. HBV replicative intermediate, single-stranded, double-stranded linear, and partially double-stranded relaxed circular DNAs are marked as HBV RI DNA, SS, DL, and RC, respectively. For in situ nucleic acid blotting, isolated core particles on PVDF membranes were treated with 0.2 N sodium hydroxide, hybridized, and subjected to autoradiography. For Northern blotting, 20 µg of total RNA was separated by 1% formaldehyde gel electrophoresis, transferred to nylon membranes, hybridized, and subjected to autoradiography as described above for Southern blotting. The 3.5 kb pgRNA and the 2.1 and 2.4 kb mRNAs encoding the S protein are indicated. For Sirt2 mRNA level, RT-PCR was performed. Relative levels of acetylated α-tubulin, endogenous Sirt2, and 2.4 and 2.1kb S mRNA were measured using ImageJ. 1.46r. Data represent the mean level of acetylated α-tubulin, Sirt2, and S mRNA from three independent experiments.
Statistical significance was evaluated using Student’s t-test. *p < 0.05 and **p
29
B. Overexpression of Sirt2 isoform 1 upregulates HBV
replication
Figure 1 shows that HBV DNA synthesis is closely related to upregulation of Sirt2 and deacetylation of α-tubulin. Five splice variants of the human SIRT2 gene were identified (NP_036369, NP_085096, NP_001180215, NR_034146.1, and KF032391). Among these, transcript variants 1 and 2 encode proteins of physiological relevance, so-called isoforms 1 (Sirt2.1) and 2 (Sirt2.2), respectively (Fig. 2A) (North et al., 2007). Sirt2 isoform 5 (Sirt2.5) (Fig. 2A) is localized to the nucleus and lacks deacetylase activity toward known Sirt2 substrates (Rack et al., 2014). Since both Sirt2 and HDAC6 have α-tubulin deacetylase activity (North et al., 2003), we obtained cytoplasmic and nuclear fractions from lysates of HEK293T cells transfected with constructs containing isoforms of Sirt2 or HDAC6 (Fig. 2B). Sirt2.1, Sirt2.2, and Sirt2.5 (3×FLAG-tagged) and HDAC6 (MYC-tagged) were identified by SDS-PAGE and Western blotting at 72 h post-transfection. Since HDAC6 is an exclusively cytoplasmic protein (Hubbert et al., 2002), it was detected only in the cytoplasmic fraction (Fig. 2B, lane 5 vs. 10). Sirt2.1 was expressed mostly in the cytoplasm (even at 72 h post-transfection); however, Sirt2.2 and Sirt2.5 accumulated in the cytoplasm and nucleus (Fig. 2B and data not shown) (Rack et al., 2014). Given that Sirt2 is overexpressed in HBV-replicating cells, leading to α-tubulin deacetylation (Fig. 1), and Sirt2.1 is a major cytoplasmic protein (Fig. 2B) (Rack et al., 2014, Dryden et al., 2003), we focused on Sirt2.1 in this study.
To examine the effects of Sirt2.1 on HBV replication, we transiently co-transfected HepG2 (Fig. 2C, lanes 1–3) and Huh7 (Fig. 2C, lanes 4–6) cells
30
with a 1.3mer HBV WT or with Sirt2.1 plus a 1.3mer HBV WT. Consistent with the results shown in Figure 1, transfection of cells with the 1.3mer HBV WT resulted in a marked reduction in α-tubulin acetylation (Fig. 2C, top panel, lanes 2 and 5). When Sirt2.1 was overexpressed, α-tubulin was deacetylated to an even greater extent (Fig. 2C, top panel, lanes 3 and 6). Also, HBs (LHBs, MHBs, and SHBs) protein levels, HBc protein levels, core particle formation, and HBV DNA synthesis in cells co-transfected with Sirt2.1 and the 1.3mer HBV WT, were significantly higher than those in cells transfected with the 1.3mer HBV WT (Fig. 2C, lane 2 vs. 3 and lane 5 vs. 6), demonstrating that overexpression of Sirt2.1 upregulates HBV replication.
33
Fig. 2. Overexpression of Sirt2.1 increases HBV replication. (A) Schematic
diagram of the three isoforms of Sirt2 obtained through splicing of the Sirt2 primary transcript. Residues are numbered according to isoform 1. The nuclear export signal (NES [dotted]), the catalytic domain (black), the nuclear localization signals (NLSs [gray]), and the catalytically active H187 residue in the catalytic domain are indicated. Alternative splicing of Sirt2 pre-mRNA yields three distinct proteins: isoforms 1, 2, and 5. Sirt2 isoform 2 is 37 amino acid residues shorter than isoform 1. In the case of isoform 5, amino acids 6 to 76 are spliced out and replaced by an arginine (CGT) residue, resulting in removal of the NES. (B) Three isoforms of Sirt2 obtained from cytoplasmic and nuclear fractions. HEK293T cells were transiently mock-transfected (lanes 1 and 6), or transfected with 4 µg of plasmid encoding 3×FLAG-tagged Sirt2 isoforms 1 (lanes 2 and 7), 2 (lanes 3 and 8), or 5 (lanes 4 and 9), or HDAC6 (lanes 5 and 10). Cytoplasmic and nuclear fractions were prepared according to the manufacturer’s instructions (Genetex). The cytoplasmic (lanes 1–5) and nuclear (lanes 6–10) fractions were examined by SDS-PAGE and Western blotting with respective anti-FLAG, anti-HDAC6, anti-GAPDH, and anti-H3 antibodies. The purity of the cytoplasmic fraction was examined by testing for the presence of GAPDH and the absence of histone H3, and that of the nuclear fraction was examined by testing for the absence of GAPDH and presence of histone H3. Monoclonal anti-FLAG M2 [1:1,000] (Sigma #F1804), rabbit polyclonal anti-H3 [1:5,000] (Abcam #ab1791), rabbit polyclonal anti-HDAC6 [1:1,000] (Santa Cruz #sc-11420), and mouse monoclonal anti-GAPDH [1:5,000] (Santa Cruz #sc-32233) were utilized. (C) Overexpression of Sirt2.1, an α-tubulin deacetylase, increases HBV replication. HepG2 (lanes 1–3) and Huh7 (lanes 4–6) cells were
mock-34
transfected (lanes 1 and 4) or transiently transfected with 4 µg of 1.3mer HBV WT (ayw) (lanes 2 and 5) or with 4 µg of 1.3mer HBV WT (ayw) plus 4 µg of 3×FLAG-Sirt2.1 construct (lanes 3 and 6), and lysates were prepared at 72 h post-transfection. The amount of transfected DNA was adjusted using pcDNA3. Rabbit polyclonal anti-HBs [1:1,000] (Virostat Inc. #1811) was utilized. SDS-PAGE and Western blotting of proteins (first–fifth panels), native agarose gel electrophoresis and Western blotting of core particles (sixth panels), and Southern blotting for HBV DNA (bottom panel) were performed as described in Figure 1. Relative levels of acetylated α-tubulin, LHBs, MHBs, and SHBs proteins, HBc protein, core particle, and HBV DNA were measured using ImageJ. 1.46r. Data are presented as mean values from three independent experiments. Statistical significance was evaluated using
35
C. Overexpression of Sirt2.1 increases HBV transcriptional
activity
We reasoned that upregulated expression of HBc and HBs proteins in Sirt2.1-overexpressing cells was due to increased transcriptional activity of HBV, because all HBV mRNAs, including the pgRNA, are expressed under the control of their authentic promoters in 1.3mer HBV WT-transfected cells. Therefore, to examine the effect of Sirt2.1 overexpression on HBV promoter activity, we performed a luciferase reporter assay in Huh7 and HepG2 cells (Fig. 3A). Upon Sirt2.1 overexpression, the promoter activity of all HBV enhancers and promoters (EnhI/Xp, EnhII/Cp, preS1p, and preS2p) was upregulated (Fig. 3A).
Since Sirt2.1 overexpression increases HBV promoter and enhancer activity (Fig. 3A), we performed Northern blotting of Huh7 or HepG2 cells co-transfected with the 1.3mer HBV WT or Sirt2.1 plus the 1.3mer HBV WT (Fig. 3B). HBV pgRNA and subgenomic S mRNA levels increased significantly in cells co-transfected with Sirt2.1 plus 1.3mer HBV WT (Fig. 3B, lanes 3 and 6), demonstrating that Sirt2.1 overexpression upregulates HBV transcription, thereby increasing HBV replication.
38
Fig. 3. Transcription of HBV RNA increases upon overexpression of Sirt2.1. (A) Luciferase reporter assays to detect HBV enhancer and promoter
activity upon overexpression of Sirt2. Huh7 (first row) or HepG2 (second row) cells were transiently transfected with 2 µg of the indicated luciferase reporter vectors in the presence or absence of 3×FLAG-Sirt2.1 (2 µg). The amount of transfected DNA was adjusted using pcDNA3. At 72 h post-transfection,
lysates were prepared (Promega #E153A) and luciferase activity was
measured. Luciferase activity relative to the respective control luciferase reporter vector is presented. Data are expressed as the mean luciferase activity from four independent experiments. (B) Northern blotting to show increased expression of HBV mRNAs upon overexpression of Sirt2.1. Huh7 (lanes 1– 3) and HepG2 (lanes 4–6) cells were transiently mock-transfected (lanes 1 and 4) or transfected with 4 µg of 1.3mer HBV WT (ayw) (lanes 2 and 5) or 4 µg of 1.3mer HBV WT (ayw) plus 4 µg of 3×FLAG-Sirt2.1 construct (lanes 3 and 6), and total RNA was harvested at 72 h post-transfection. The amount of transfected DNA was adjusted using pcDNA3. Northern blotting was performed as described in Figure 1B. Data are presented as mean relative HBV mRNA levels from four independent experiments. Statistical significance was evaluated using Student’s t-test. Exact p-values relative to the respective control are shown.
39
D. HBV replication is downregulated when Sirt2 is inhibited or
knocked down
Since Sirt2.1 overexpression upregulates HBV replication via increased transcription of HBV pgRNA and mRNA (Fig. 3), we further examined whether inhibiting Sirt2 downregulates HBV replication. To examine the effect of Sirt2.1 inhibition on HBV replication, we exposed 1.3mer HBV WT-transfected Huh7 (Fig. 4A) and HepG2 (data not shown, Fig. 8C) cells to the potent Sirt2 inhibitor AGK2 (10 µM) (Outeiro et al., 2007) from the time of transfection up until 72 h post-transfection. The results of an MTT assay revealed that AGK2 was not cytotoxic (data not shown). HBc protein expression, core particle formation, and HBV DNA synthesis fell significantly (Fig. 4A, lane 3). Inhibition by the AGK2 inhibitor was fully effective even in Sirt2.1-overexpressing cells (Fig. 4A, lane 5). The amount of α-tubulin deacetylation also fell accordingly (Fig. 4A, top panel, lanes 3 and 5).
Since AGK2 treatment reduced HBV replication (Fig. 4A), we also examined the effect of knocking down Sirt2 (using a lentiviral shRNA system) on HBV replication. Huh7 and HepG2 cells transduced with lentiviral control shRNA or Sirt2 shRNAs (shSIRT2-#1–4) were transfected with the 1.3mer HBV WT (Fig. 4B, lane 3 vs. 4–7 and lane 10 vs. 11–14). Sirt2 knockdown cells showed reduced Sirt2 expression (Fig. 4B, third panel, lanes 4–7 and 11– 14); thus levels of acetylated α-tubulin were higher than those in control mock-transduced or control shRNA-mock-transduced Huh7 and HepG2 cells (Fig. 4B, top panel, lanes 2 and 3 vs. 4–7 and lanes 9 and 10 vs. 11–14). Upon Sirt2
40
knockdown, HBV HBc protein expression, core particle formation, and HBV DNA synthesis fell markedly (Fig. 4B).
Next, we examined the effect of Sirt2 knockdown on HBV enhancer and promoter activity using a luciferase reporter assay. Mock-, control shRNA-, shSIRT2-#2-, or shSIRT2-#3-transduced Huh7 cells were transfected with pGL3 empty or pGL3-EnhI/Xp (Fig. 4C, top), pGL3 empty or pGL3-EnhII/Cp (Fig. 4C, second), pGL3 empty or pGL3-PreS1p (Fig. 4C, third), and pGL3 empty or pGL3-PreS2p (Fig. 4C, bottom). The HBV enhancer and promoter (EnhI/Xp, EnhII/Cp, preS1p, and preS2p, respectively) activity in Sirt2 knockdown cells was lower than that in mock- and control shRNA-transduced Huh7 cells (Fig. 4C).
To validate the Sirt2 effect on HBV replication, we employed HBV infection experiment using HepG2-hNTCP cells which are susceptible to HBV infection. Following infection to HepG2-hNTCP-C9 cells that had been transduced with lentiviral control shRNA or Sirt2 shRNAs (shSIRT2-#2 or #3), we detected markedly reduced HBV pgRNA and subgenomic RNAs, HBc protein expression, core particle formation, and HBV DNA synthesis in Sirt2 knockdown cells than control shRNA-transduced cells (Fig. 4D, fifth–eighth panels, lane 3 vs. 4 and 5). Sirt2 knockdown cells showed reduced Sirt2 RNA and protein expression (Fig. 4D, third and tenth panels, lane 3 vs. 4 and 5), thus the levels of acetylated α-tubulin were higher than that in control shRNA-transduced HepG2-hNTCP-C9 cells (Fig. 4D, top panel, lane 3 vs. 4 and 5). Since the HepG2 cell is not susceptible to HBV infection, mock-infected and HBV infected HepG2 cells showed comparable Sirt2 expression (Fig. 4D, third panel, lanes 1 and 2) and acetylated α-tubulin level (Fig. 4D, top panel, lanes 1 and 2).
41
In order to examine the effect on Sirt2 by entecavir in infection system, HBV infected HepG2-hNTCP-C9 cells were treated with entecavir (1 µM) at the time of infection (lane 8) or one day post-infection (lane 9). As expected, endogenous Sirt2 level was higher in HBV infected HepG2-hNTCP-C9 cells compare to mock-infected control HepG2-hNTCP-C9 cells (Fig. 4D, third pane, lane 6 vs. 7). Also, endogenous Sirt2 level was markedly reduced in entecavir treated HBV infected HepG2-hNTCP-C9 cells (Fig. 4D, third panel, lane 6 vs. 8 and 9). Accordingly, Sirt2 mRNA level fell significantly upon entecavir treatment (Fig. 4D, bottom panel, lane 6 vs. 8 and 9). Since entecavir treated HepG2-hNTCP-C9 cells showed reduced Sirt2 expression, acetylated α-tubulin were higher in entecavir treated, HBV infected cells than in HBV infected cells (Fig. 4D, top panel, lane 7 vs. 8 and 9).
44
Fig. 4. Inhibition or knockdown of Sirt2 reduces HBV replication. (A)
Treatment with AGK2, a potent Sirt2 inhibitor, reduces HBV replication. Huh7 cells were mock-transfected (lane 1) or transfected with 4 µg of 1.3mer HBV WT (ayw) (lanes 2 and 3) or with 4 µg of 1.3mer HBV WT (ayw) plus 4 µg of 3×FLAG-Sirt2.1 construct (lanes 4 and 5). Lanes 3 and 5 were treated for 72 h with AGK2 (10 µM) at the time of transfection. (B) HBV replication decreased when Sirt2 was knocked down by shRNAs. Huh7 (lanes 1–7) and HepG2 (lanes 8–14) cells were transduced with lentivirus-like particles containing control shRNA (shControl) (lanes 3 and 10) or SIRT2-targeting shRNAs (shSIRT2-#1, shSIRT2-#2, shSIRT2-#3, and shSIRT2-#4) (lanes 4– 7 and lanes 11–14). The control (lanes 2 and 9) and the transduced Huh7 (lanes 3–7) and HepG2 (lanes 10–14) cells were transiently transfected with 4 µg of 1.3mer HBV WT (ayw) and lysed 72 h later. Lanes 1 and 8 are mock-transfected controls, which were adjusted with pcDNA3. (C) Promoter activity of EnhI/Xp, EnhII/Cp, PreS1p, and PreS2p decreased upon Sirt2 knockdown. Freshly plated shControl-, shSIRT2-#2- or shSIRT2-#3-transduced Huh7 cells were transfected with 2 µg of the indicated luciferase reporter vector containing null, EnhI/Xp, EnhII/Cp, PreS1p, or PreS2p regions. Lysates were prepared at 72 h post-transfection, and luciferase activity was measured. Luciferase activity relative to that in control shRNA-transduced cells is presented. Data are presented as the mean luciferase activity from four independent experiments. (D) Effects of Sirt2 knockdown or entecavir in HBV
infected cells. 2×10⁵ of HepG2 (lane 2), HepG2-hNTCP-C9-shControl (lane
3), HepG2-hNTCP-C9-shSIRT2-#2 (lane 4), HepG2-hNTCP-C9-shSIRT2-#3 (lane 5) cells, and HepG2-hNTCP-C9 cells (lanes 7–9) in 6 well plates were
45
For Northern blotting (D, eighth panel), lysates were prepared at 5 days post-infection. Lanes 1 (HepG2) and 6 (HepG2-hNTCP-C9) were mock-infected. SDS-PAGE and Western blotting of proteins (A and D, first–fifth panels; B, first–fourth panels), native agarose gel electrophoresis and Western blotting of core particles (A and D, sixth panels; B, fifth panels), Southern blotting of HBV DNA (A and B, bottom panels; D, seventh panel), and RT-PCR for Sirt2 mRNA (D, bottom panel) were performed as described in Figure 1. Relative levels of acetylated α-tubulin, core particles, HBV RI DNA and HBV mRNA were measured using ImageJ. 1.46r. Data are presented as mean values from three independent experiments. Statistical significance was evaluated using
Student’s t-test. *p < 0.05, **p < 0.005, and ***p < 0.0005 (A and D) or exact
46
E. Overexpression of a Sirt2 dominant-negative mutant
impairs HBV replication
Since HBV replication was impaired by Sirt2 inhibition or knockdown (Fig. 4), we next investigated whether Sirt2 activity affects the HBV life cycle. A Sirt2 dominant-negative (DN) mutant was constructed by exchanging the catalytically active histidine 187 (CAC) in Sirt2 for tyrosine (TAC), thereby inactivating Sirt2 deacetylase activity (North et al., 2007). Upon expression of the inactive Sirt2 DN mutant, acetylated α-tubulin levels increased (Fig. 5A, top panel, lanes 4 and 8). HBc protein expression, HBV core particle formation, and HBV DNA replication in Sirt2 DN-expressing cells were lower than those in Huh7 and HepG2 cells transfected with the 1.3mer HBV WT (Fig. 5A, lane 2 vs. 4 and lane 6 vs. 8).
F. Expression of replication-deficient mutant HBV impairs
Sirt2 activity
Since Sirt2 expression and α-tubulin deacetylation increased in HBV WT-replicating cells (Fig. 1A, lanes 2, 4, and 6, Fig. 1B and 1C, lanes 2), but fell in replication-deficient HBV mutant-transfected and RT inhibitor-treated cells (Fig. 1B and 1C, lanes 3 and 4), we compared the effect of Sirt2 WT and the Sirt2 DN mutant in HBV WT-replicating and replication-deficient mutant-expressing Huh7 cells. As expected, Sirt2 WT- or Sirt2 DN-transfected Huh7 cells showed elevated α-tubulin deacetylation or elevated α-tubulin acetylation, respectively (Fig. 5B, top panel, lane 3 vs. 4). Consistent with Figure 5A, HBV WT plus Sirt2 WT co-transfected cells showed higher α-tubulin deacetylation and HBV replication than HBV WT-transfected cells
47
(Fig. 5B, top and bottom panels, lane 5 vs. 6) and HBV WT plus Sirt2 DN co-transfected cells showed lesser α-tubulin deacetylation and HBV replication than HBV WT-transfected cells (lane 5 vs. 7). Surprisingly, replication-deficient HBV-expressing cells showed greater elevation of α-tubulin acetylation, although Sirt2 WT was overexpressed (Fig. 5B, top panel, lanes 9 and 12), as did Sirt2 DN-overexpressing cells (lanes 10 and 13), indicating that replication-deficient mutant HBV impairs Sirt2 activity.
50
Fig. 5. Replication of HBV WT is inhibited by overexpression of a Sirt2.1 dominant-negative (DN) mutant, and HBV replication-deficient mutant expression impairs Sirt2 activity. (A) A Sirt2 DN mutant inhibits HBV
replication. Huh7 (lanes 1–4) or HepG2 (lanes 5–8) cells were mock-transfected (lanes 1 and 5), or mock-transfected with 4 µg of 1.3mer HBV WT (ayw) (lanes 2 and 6), or co-transfected with 4 µg of 3×FLAG-Sirt2.1 WT (lanes 3 and 7) or 3×FLAG-Sirt2.1 DN mutant (lanes 4 and 8) along with 4 µg of 1.3mer HBV WT (ayw). (B) In HBV replication-deficient mutant-expressing cells, Sirt2 activity is impaired, with no deacetylation of α-tubulin (as in Sirt2 DN-expressing cells). Huh7 cells were mock-transfected (lane 1), or transiently co-transfected with 4 µg of 3×FLAG-Sirt2.1 WT (lanes 3, 6, 9, and 12) or 4 µg of 3×FLAG-Sirt2.1 DN (lanes 4, 7, 10, and 13) along with mock (lanes 2–4), HBV WT (lanes 5–7), or replication-incompetent TP-Y65F (lanes 8–10) or RT-YMHA (lanes 11–13) mutants. Lysates were prepared at 72 h post-transfection. The amount of transfected DNA was adjusted using pcDNA3. SDS-PAGE and Western blotting of proteins (first–fourth panels), native agarose gel electrophoresis and Western blotting of core particles (fifth panels), and Southern blotting of HBV DNA (bottom panel) were performed as described in Figure 1. Relative levels of acetylated α-tubulin, core particles, and HBV RI DNA were measured by ImageJ. 1.46r. Data are presented as mean values from three independent experiments. Statistical significance was
evaluated using Student’s t-test. The exact p-values (A) or *p < 0.05 and **p <