Initial Pressure Effect of the Quenching Mesh for an Equipment Protection
S. W. Hong, J. H. Song, H. D. Kim
Korea Atomic Energy Research Institute, P. O. Box 105, Yusong, Daejon, KOREA, 305-600, [email protected] 1. Introduction
One of the most important elements in the evaluation of an equipment’s survivability is the temperature impact appearing during a hydrogen combustion. It is possible to damage several equipments because the gas temperate during a hydrogen burn is much higher than the equipment survivability temperature[1]. The objective of this paper is to test the model equipment survivability during a hydrogen burn when quenching mesh is installed around the model equipment.
2. Experiments 2.1 Test Facility
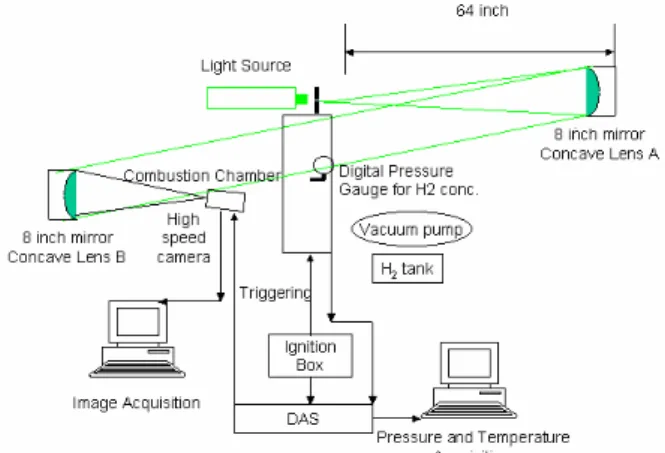
Fig. 1 shows the test facility which consists of the visualization system, the combustion chamber, the data acquisition system and the electric spark igniter system. The visualization system is equipped to capture the flame propagation images for a hydrogen burn. The combustion chamber consists of three compartments with dimensions of 300x300x300mm. Each compartment is connected in parallel. Quartz windows of 180x180 mm are installed on both sides of the center compartment for an optical transparency. A data acquisition system (Agilent Technologies Inc., HP E1419A, HP E1564A) is used to measure the variation of the temperatures and pressures in the combustion chamber during a hydrogen burn. The ignition node is installed at the end-center of the first compartment. The gap of the ignition node is about 2mm.
Fig. 1 Schematic of Experimental Apparatus
When the quenching mesh with a 0.3 mm quenching distance surrounds the model equipment (10x10x10cm), the role of the quenching mesh was experimentally examined. Fig. 2 shows the model equipment, the quenching mesh to surround it, and the picture after surrounding it using the mesh. The distance from the model surface to the mesh is 20mm. Four thermocouples are installed at a 10mm distance from the model equipment surface. Thermocouples are located at the flame propagation face, the parallel face with LENS-A, the parallel face with LENS-B and the upper face of the model compartment. The model equipment is located at the center of the second compartment. The tests were conducted for the cases without/with the quenching mesh around the model equipment.
Fig. 2 Model Equipment, Quenching Mesh, and Picture after surrounding the model equipment
2.2 Test Results
Fig. 3 shows the temperatures at the second window where the model equipment is located for the cases without/with the mesh surrounding the model equipment. For the case without the mesh, the gas temperature in the first compartment is the greatest and the temperatures around the model equipment appear to have large values in sequence for the front face, the upper face and the side faces of the model equipment. The front face of the model equipment is first contacted with the flame. And then, the upper face temperature is also high because the flame approaches from the left upper corner. Ideally, the side temperatures should be symmetric, but the flame does not propagate symmetrically. The gas temperatures remained between 200 ˚ C and 350 ˚ C as a maximum for 2 seconds. If the design temperature of the equipment is less than 200 ˚ C , the equipment could be damaged. In the case where the combustion chamber lies vertically, similar trends appeared.
For the case with the mesh, the gas temperatures at the four surfaces appeared to be less than 100 °C. In the case where the combustion chamber lies vertically, similar
Transactions of the Korean Nuclear Society Autumn Meeting Busan, Korea, October 27-28, 2005
trends appeared. Fig. 4 shows the flame images for the cases without/with the mesh. The flame surrounds the model equipment when the mesh is not provided. However, it is not impossible to obtain a clear flame image for the case with the mesh because the flame front is broken due to it contacting with the mesh.
0 2000 4000 6000 8000 10000 0 100 200 300 400 500 T em per at ur e[ oC] Time[msec] Mirror-I Face(H2=10.43%) Flame Propagation Face Mirroe-II Face Upper Face First Compartment 0 2000 4000 6000 8000 10000 0 100 200 300 400 500 Tem per at ire[ oC] Time[msec] Mirror-I Face(H2=10.19%) Flame Propagation Face Mirror-II Face Upper Face First Compartment
Fig. 3 Temperatures at the model equipment surfaces
Fig. 4 Flame images
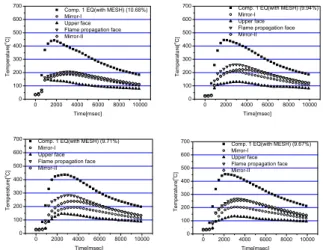
The initial pressure effects on the quenching mesh performance were tested. The ignition is started at the center of the first compartment. Fig. 5 shows the temperatures at the model equipment surfaces for various pressures. The surface temperatures of the model equipment increase with the initial pressure rise.
0 2000 4000 6000 8000 10000 0 100 200 300 400 500 600 700 T em per a tu re[ oC] Time[msec] Comp. 1 EQ(with MESH) (10.68%) Mirror-I
Upper face Flame propagation face Mirror-II 0 2000 4000 6000 8000 10000 0 100 200 300 400 500 600 700 T em per a tu re[ oC] Time[msec] Comp. 1 EQ(with MESH) (9.94%) Mirror-I
Upper face Flame propagation face Mirror-II 0 2000 4000 6000 8000 10000 0 100 200 300 400 500 600 700 T empe ratur e[ oC] Time[msec] Comp. 1 EQ(with MESH) (9.71%) Mirror-I
Upper face Flame propagation face Mirror-II 0 2000 4000 6000 8000 10000 0 100 200 300 400 500 600 700 Tem per at ur e[ oC] Time[msec] Comp. 1 EQ(with MESH) (9.67%) Mirror-I
Upper face Flame propagation face Mirror-II
Fig. 5 Temperatures at the model equipment surfaces for various pressures
The initial pressure effects were tested when the flame acceleration device in front of the first compartment is provided. The flame speed increases by about 15 %. As
expected, the surface temperatures of the model equipment increase with the initial pressure rise. In addition, the temperatures depending on the location of the model equipment are relatively uniform when compared with the case that the ignition is started at the center of the first compartment.
0 2000 4000 6000 8000 10000 0 100 200 300 400 500 600 T em per at ur e[ oC] Time[msec] Comp. 1(1.4Bar) Mirror-I Upper face Flame propagation face Mirror-II 0 2000 4000 6000 8000 10000 0 100 200 300 400 500 600 T em per at ur e[ oC] Time[msec] Comp. 1(1.6Bar) Mirror-I Upper face Flame propagation face Mirror-II 0 2000 4000 6000 8000 10000 0 100 200 300 400 500 600 Tem per at ur e[ oC] Time[msec] Comp. 1(1.8Bar) Mirror-I Upper face Flame propagation face Mirror-II 0 2000 4000 6000 8000 10000 0 100 200 300 400 500 600 Tem pera ture[ oC] Time[msec] Comp. 1(2.0Bar) Mirror-I Upper face Flame propagation face Mirror-II
Fig. 6 Temperatures at the model equipment surfaces with the flame acceleration device before the first compartment
3. Conclusion
Equipment survivability during a hydrogen combustion was carried out by using mesh surrounding the model equipment which was a kind of the square box and located at the center passage of the flame. The verification temperature of the equipment which is operated during severe accidents, is 190-240 °C [2]. Equipment can survive at a low initial pressure for a 10% hydrogen concentration with a dry air. However, equipment can be damaged at a high pressure. The effect of the distance from the model to the mesh should be studied to decrease the temperatures at the surface of the model.
ACKNOWLEDGMENTS
This work has been carried out under the Nuclear R&D Program by MOST, Korea.
REFERENCES
[1] Kim, J. T., Hong, S. W., Kim, S. B., Kim, H. D., J. of Korea Nuclear Society, Vol. 36, No.1, (2004) 24-35. [2] KOPEC, Report for Equipment Survivability Evaluation, (2001).