Correspondence to: Jaeyong Shin
Department of Preventive Medicine, Yonsei University College of Medicine, 50-1 Yonsei-ro, Seodaemun-gu, Seoul 03722, Korea
Tel: +82-2-2228-1881, Fax: +82-2-392-8133, E-mail: [email protected] Received: February 8, 2021, Accepted after revision: March 8, 2021
© Korean Academy of Health Policy and Management ◯㏄ This is an open-access article distributed under the terms of the Creative Commons Attribution Non-Commercial License (http://creativecommons.org/licenses/by-nc/4.0) which permits unrestricted non-commercial use,
distribution, and reproduction in any medium, provided the original work is properly cited.
개인의 사회경제적 수준과 지역의 사회경제적 수준의
상호작용이 제2형 당뇨 환자에서 당뇨합병증 발생 및 당뇨와
관련된 입원에 미치는 영향: 2002–2013년 국민건강보험공단
표본 코호트 자료를 활용하여
장지은1ㆍ주영준2ㆍ이두웅3ㆍ이상아4ㆍ오소연5ㆍ최동우3ㆍ이현지3ㆍ신재용6 1연세대학교 약학대학 제약산업학협동과정, 2아주대학교 의과대학 예방의학교실, 3연세대학교 일반대학원 보건학과, 4국민건강보험 일산병원 연구분석팀, 5이화여자대학 교 목동병원 태아 알코올 증후군 예방 연구소, 6연세대학교 의과대학 예방의학교실Interaction Effects between Individual Socioeconomic Status and Regional
Deprivation on Onset of Diabetes Complication and Diabetes-Related
Hospitalization among Type 2 Diabetes Patients: National Health Insurance
Cohort Sample Data from 2002 to 2013
Jieun Jang1, Yeong Jun Ju2, Doo Woong Lee3, Sang Ah Lee4, Sarah Soyeon Oh5, Dong-Woo Choi3, Hyeon Ji Lee3, Jaeyong Shin6
1
Graduate Program of Industrial Pharmaceutical Science, College of Pharmacy, Yonsei University, Seoul; 2Department of Preventive Medicine and Public Health, Ajou University School of Medicine, Suwon; 3Department of Public Health, Graduate School, Yonsei University, Seoul; 4Research and Analysis Team, National Health Insurance Corporation Ilsan Hospital, Goyang; 5Fetal Alcohol Syndrome Prevention Center, Ewha Womans University Mokdong Hospital; 6
Department of Preventive Medicine, Yonsei University College of Medicine, Seoul, Korea
Background: In this study, we aimed to investigate the interaction effects of individual socioeconomic status and regional deprivation on the onset of diabetes complications and diabetes-related hospitalization among type 2 diabetes patients.
Methods: Korean National Health Insurance Service National Sample Cohort data from 2002 to 2013 were used. A total of 50,954 patients newly diagnosed with type 2 diabetes from 2004 to 2012 and aged 30 years or above were included. We classified patients into six groups according to individual income level and neighborhood deprivation: ‘high in advantaged,’ ‘high in disadvantaged,’ ‘middle in advantaged,’ ‘middle in disadvantaged,’ ‘low in advantaged,’ and ‘low in disadvantaged.’ We calculated hazard ratios (HR) of onset of diabetes complication and diabetes-related hospitalization using the Cox proportional hazard model, with the reference group as diabetes patients with high income in advantaged regions.
Results: In terms of the interaction effects of individual income level and regional socioeconomic level, even with the same low individual income level, the group with a high regional socioeconomic level (low in advantaged) showed low HRs for the onset of diabetes complication (HR, 1.04; 95% confidence interval [CI], 1.00–1.08) compared to the ‘low in disadvantaged’ group (HR, 1.10; 95% CI, 1.05–1.16). In addition, the ‘high in advantaged’ group showed slightly higher HRs for the onset of diabetes complication (HR, 1.06; 95% CI, 1.00–1.11) compared to the ‘low in advantaged’ and it appeared to be associated with slight mitigation of the risk of diabetes complication. For the low-income level, the patients in disadvantaged regions showed the highest HRs for diabetes-related hospitalization (HR, 1.29; 95% CI, 1.19–1.41) compared to the other groups.
Conclusion: Although we need to perform further investigations to reveal the mechanisms that led to our results, interaction effects individual socioeconomic status and regional deprivation might be associated with on onset of diabetes complications and diabetes-related hospitalization among type 2 diabetes patients.
서 론
당뇨는 유병률이 높은 만성질환 중 하나이며, 개인적으로도 국가적 으로도 질환관리를 위해 상당한 경제적 부담을 초래하는 질환으로 알 려져 있다[1]. 2018년 국민건강영양조사 결과에 따르면 우리나라 당 뇨병 유병률은 성인의 10명 중 약 1명인 10.4%에 이른다[2]. 당뇨로 인 한 진료비 규모는 2010년 13,516억 원에서 2017년 22,239억 원으로 연 평균 약 7.4%의 증가추세를 보이고 있다[3]. 높은 유병률과 사회적 비 용 측면에서 주요한 보건문제로 부각되고 있는 당뇨는 합병증 발생위 험과 입원 등의 심각한 예후를 예방하고 지연하기 위해 적극적인 혈 당조절과 체계적인 관리가 매우 중요한 질환이다[4]. 한편, 개인의 소득수준은 당뇨와 같은 만성질환관리와 건강결과를 결정하는 중요한 요소로 알려져 있다[5-7]. 낮은 소득수준의 계층은 만성질환의 높은 발생률, 높은 유병률, 합병증 발생 및 입원과 같은 부 정적 결과를 가질 가능성이 높은 것으로 확인되었다[8-11]. 또한 정확 한 메커니즘이 밝혀지지는 않았지만, 동일한 소득 계층이더라도 개 인의 건강결과는 사회경제적 수준이 높은 지역에 거주하는지 여부에 따라 다른 것으로 알려져 있다. 일반적으로 높은 지역박탈 수준은 부 정적 건강결과와 높은 관련성이 확인되었다[11,12]. 이 연구의 목적은 개인의 소득수준 및 거주지역의 사회경제적 수준 의 상호작용이 제2형 당뇨 신환자에서 당뇨합병증 발생 및 당뇨로 인 한 입원위험에 미치는 영향을 분석하는 것이다.방 법
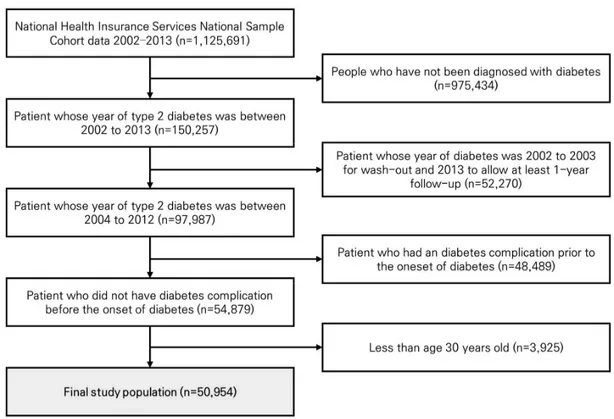
이 연구는 전 국민의 2%가 표본 샘플링 되어 대표성을 지닌 국민건 강보험공단 표본 코호트 2002년부터 2013년 자료를 활용하였다. 연 구대상자는 1,125,691명의 대상자 중 2002년부터 2013년까지 제2형 당뇨로 요양기관을 방문하지 않은 대상자(n=975,434)를 제외하였다. 당뇨 신환자를 연구대상자로 포함하고 최소한 1년 이상의 추적관찰 기간을 포함하기 위하여 2002년부터 2003년까지 제2형 당뇨로 요양 기관을 방문하거나 2013년 새로 제2형 당뇨가 진단된 사람 (n=52,720)을 제외하였다. 제2형 당뇨는 주상병 또는 부상병으로 ‘E11,’ ‘E12,’ ‘E13,’ ‘E14’ Korean Standard Classification of Diseases-7 (KCD-7) 코드가 진단된 환자로 정의하였다[13]. 2004년부터 2012년 까지 당뇨 신환자 중 당뇨 발생 이전 당뇨합병증이 발생한 자 (n=48,489), 30세 미만인 자(n=3,925)를 제외하고 최종적으로 50,954 명이 포함되었다(Figure 1).흥미변수는 개인의 소득수준과 지역의 사회경제적 수준에 대한 상
호작용 변수이다. 개인의 소득수준은 소득분위에 따라 낮음(0–3분 위), 중간(4–7분위), 높음(8–10분위)으로 분류하였다. 지역의 사회경 제적 수준은 지역박탈지수(neighborhood deprivation)를 활용하였 다. 지역의 사회경제적 수준을 설명하는 지표인 지역박탈지수는 자 원의 결핍이나 물질적 욕구로 정의되는 기존의 빈곤 개념을 넘어 능 력, 사회참여 등의 비화폐 자원을 포함해 다차원적으로 지역사회 결 핍을 측정하기 위한 지표이다[14]. 지역사회박탈 수준은 전국 평균 지 역박탈지수를 기준으로 평균 미만(disadvantaged)과 평균 이상 (advantaged)으로 그룹화하였다. 이 연구는 2005년 인구센서스 자료 를 활용하여 지역박탈지수를 산출하였고, 10개 지표(낮은 사회계급, 낙후된 주거환경, 낮은 교육수준, 자동차 미소유, 1인 가구, 이혼 또는 사별, 여성 가구주, 노인인구, 무주택 소유, 주거 밀집)에 대해 표준화 점수(z-score)를 산출하여 합산하였다. 이는 시군구 단위로 산출하여 적용하였다[15,16]. 개인 소득수준과 지역의 사회경제적 수준의 상호 작용 변수(individual income–neighborhood deprivation)는 개인 소 득수준–지역의 사회경제적 수준에 따라 ‘높은 개인소득–높은 지역사 회경제적 수준(high in advantaged),’ ‘높은 개인소득–낮은 지역사회 경제적 수준(high in disadvantaged),’ ‘중간 개인소득–높은 지역사회 경제적 수준(middle in advantaged),’ ‘중간 개인소득–낮은 지역사회 경제적 수준(middle in disadvantaged),’ ‘낮은 개인소득–높은 지역사 회경제적 수준(low in advantaged),’ ‘낮은 개인소득–낮은 지역사회경 제적 수준(low in disadvantaged)’으로 분류하였다. 종속변수는 당뇨합병증 발생과 당뇨와 관련된 입원이다. 당뇨합병 증 발생은 주상병과 부상병으로 당뇨합병증의 KCD-7 코드가 1개 이 상 포함 시 당뇨합병증이 발생한 것으로 간주하였다(Appendix 1) [17,18]. 당뇨합병증의 경우 당뇨합병증 중증도 지표(Diabetes Complication Severity Index)를 활용하여 당뇨합병증 중증도 지표에 포함되는 질환인 경우 당뇨합병증으로 분류하였다. 당뇨와 관련된 입원은 주상병과 부상병으로 제2형 당뇨코드 또는 당뇨합병증의 KCD-7 코드가 1개 이상을 포함하여 입원이 발생 시 당뇨와 관련된 입 원발생으로 간주하였다. 보정변수는 개인 특성변수로는 성별(남성, 여성), 연령(30–39, 40– 49, 50–59, 60–69, 70 이상), 지역(수도권, 대도시, 그 외), 보험현황(직 장가입자, 지역가입자, 의료급여), 장애 여부(비장애, 장애), 당뇨 진 단연도, Charlson 동반상병지수(0, 1, 2, 3 이상)를 포함하였다. 사회간 접자본 변수로는 해당 시군구의 10,000당 요양기관 수, 인구 10,000명 당 의사 수를 포함하였다. 통계방법은 연구대상자의 당뇨진단 시 인구학적 · 사회경제적 특 성에 따른 당뇨합병증 발생과 당뇨와 관련된 입원발생의 기초통계량 을 제시하였고, 연구대상자 특성에 따라 당뇨합병증 발생과 당뇨와 관련된 입원발생의 차이가 있는지 확인하기 위해 카이제곱검정을 시 행하였다. 개인의 소득수준과 지역의 사회경제적 수준의 상호작용이 당뇨 환자의 당뇨합병증 발생과 당뇨와 관련된 입원발생위험에 미치 는 영향을 분석하기 위해 공유 프레일티 모형(shared frailty model)을 고려한 생존분석(Cox proportional-hazard regression model using a shared frailty model)과 로그-랭크 검정(log-rank test)을 사용하였다. 개인의 소득수준과 지역의 사회경제적 수준의 상호작용에 따른 당뇨 합병증 발생과 당뇨와 관련된 입원발생의 누적 발생률은 카플란-마 이어 생존분석(Kaplan-Meier curve analysis)으로 파악하였다. 모든 통계분석은 SAS ver. 9.4 (SAS Institute Inc., Cary, NC, USA)를 활용하 였다.
결 과
Table 1은 연구대상자의 일반적인 특성을 보여주고 있다. 제2형 당 뇨 신환자 총 50,954명 중 51.2% (n=26,079)가 당뇨합병증이 발생하 였다. 개인의 소득수준과 지역의 사회경제적 수준에 따라서는 개인 의 소득수준이 높고 지역의 사회경제적 수준이 높은 그룹(high in advantaged)이 당뇨합병증 발생률이 49.2%로 가장 낮았고, 개인의 소 득수준이 낮고 지역의 사회경제적 수준의 낮은 그룹(low in disadvantaged)은 당뇨합병증 발생률이 56.7%로 가장 높았다. 개인의 소득수준과 지역의 사회경제적 수준의 상호작용 그룹 간 당뇨합병증 발생률은 카이제곱검정 결과 유의하였다(p<0.0001). 당뇨와 관련된 입원발생은 전체 50,954명 중 21.4% (n=10,903)이 당뇨와 관련된 입 원이 발생하였다. 개인의 소득수준이 높고 지역의 사회경제적 수준 이 높은 그룹(high in advantaged)에서 당뇨와 관련된 입원발생이 18.2%로 가장 낮았고, 동일하게 높은 개인 소득수준이지만 낮은 사회 경제적 수준의 그룹(high in disadvantaged)에서 당뇨와 관련된 입원 발생이 21.5%로 지역의 사회경제적 수준에 따라 입원발생률이 상이 하였다. 개인의 소득수준이 낮고 지역의 사회경제적 수준이 낮은 그 룹(low in disadvantaged)에서 당뇨와 관련된 입원발생이 28.0%로 가 장 높았다. Figure 2는 개인 소득수준과 지역의 사회경제적 수준의 결합효과 에 따른 제2형 당뇨 신환자에서 당뇨합병증 누적발생률을 나타낸다. 낮은 소득-낮은 지역 사회경제적 수준의 그룹(low in disadvantaged) 에서 당뇨합병증 발생위험이 가장 높은 것으로 확인되었다. Figure 3 는 개인 소득수준과 지역의 사회경제적 수준의 결합효과에 따른 제2 형 당뇨 신환자에서 당뇨와 관련된 입원 누적발생률을 나타낸다. 낮 은 소득-낮은 지역 사회경제적 수준의 그룹(low in disadvantaged)에서Characteristic Total Onset of diabetes complication Diabetes-related hospitalization
Yes No p-value Yes No p-value
Total 50,954 (100.0) 26,079 (51.2) 24,875 (48.8) 10,903 (21.4) 40,051 (78.6)
Individual income-neighborhood deprivation <0.0001 <0.0001
High in advantaged 14,700 (28.8) 7,236 (49.2) 7,464 (50.8) 2,672 (18.2) 12,028 (81.8) High in disadvantaged 5,200 (10.2) 2,827 (54.4) 2,373 (45.6) 1,117 (21.5) 4,083 (78.5) Middle in advantaged 11,861 (23.3) 5,763 (48.6) 6,098 (51.4) 2,407 (20.3) 9,454 (79.7) Middle in disadvantaged 5,751 (11.3) 3,058 (53.2) 2,693 (46.8) 1,280 (22.3) 4,471 (77.7) Low in advantaged 8,522 (16.7) 4,406 (51.7) 4,116 (48.3) 2,049 (24.0) 6,473 (76.0) Low in disadvantaged 4,920 (9.7) 2,789 (56.7) 2,131 (43.3) 1,378 (28.0) 3,542 (72.0) Gender <0.0001 <0.0001 Male 27,256 (53.5) 13,510 (49.6) 13,746 (50.4) 6,305 (23.1) 20,951 (76.9) Female 23,698 (46.5) 12,569 (53.0) 11,129 (47.0) 4,598 (19.4) 19,100 (80.6) Age (yr) <0.0001 <0.0001 30–39 6,516 (12.8) 2,161 (33.2) 4,355 (66.8) 912 (14.0) 5,604 (86.0) 40–49 12,970 (25.5) 5,818 (44.9) 7,152 (55.1) 2,328 (17.9) 10,642 (82.1) 50–59 14,676 (28.8) 7,731 (52.7) 6,945 (47.3) 2,983 (20.3) 11,693 (79.7) 60–69 10,342 (20.3) 6,377 (61.7) 3,965 (38.3) 2,552 (24.7) 7,790 (75.3) ≥70 6,450 (12.7) 3,992 (61.9) 2,458 (38.1) 2,128 (33.0) 4,322 (67.0) Region <0.0001 <0.0001 Capital region 22,725 (44.6) 11,270 (49.6) 11,455 (50.4) 4,328 (19.0) 18,397 (81.0) Metropolitan 12,476 (24.5) 6,373 (51.1) 6,103 (48.9) 2,653 (21.3) 9,823 (78.7) Others 15,753 (30.9) 8,436 (53.6) 7,317 (46.4) 3,922 (24.9) 11,831 (75.1) Insurance coverage <0.0001 <0.0001
NHI, self-employed insured 20,453 (40.1) 10,595 (51.8) 9,858 (48.2) 4,446 (21.7) 16,007 (78.3) NHI, employee insured 27,822 (54.6) 13,914 (50.0) 13,908 (50.0) 5,526 (19.9) 22,296 (80.1)
Medical aid 2,679 (5.3) 1,570 (58.6) 1,109 (41.4) 931 (34.8) 1,748 (65.2)
Disability <0.0001 <0.0001
Non-disabled 47,035 (92.3) 23,843 (50.7) 23,192 (49.3) 9,623 (20.5) 37,412 (79.5)
Disabled 3,919 (7.7) 2,236 (57.1) 1,683 (42.9) 1,280 (32.7) 2,639 (67.3)
Year of diabetes diagnosis <0.0001 <0.0001
2004 7,913 (15.5) 5,446 (68.8) 2,467 (31.2) 2,278 (28.8) 5,635 (71.2) 2005 8,647 (17.0) 5,386 (62.3) 3,261 (37.7) 1,991 (23.0) 6,656 (77.0) 2006 5,964 (11.7) 3,534 (59.3) 2,430 (40.7) 1,374 (23.0) 4,590 (77.0) 2007 5,533 (10.9) 2,999 (54.2) 2,534 (45.8) 1,221 (22.1) 4,312 (77.9) 2008 5,430 (10.7) 2,913 (53.6) 2,517 (46.4) 1,276 (23.5) 4,154 (76.5) 2009 4,770 (9.4) 2,081 (43.6) 2,689 (56.4) 927 (19.4) 3,843 (80.6) 2010 4,040 (7.9) 1,430 (35.4) 2,610 (64.6) 638 (15.8) 3,402 (84.2) 2011 4,753 (9.3) 1,527 (32.1) 3,226 (67.9) 738 (15.5) 4,015 (84.5) 2012 3,904 (7.7) 763 (19.5) 3,141 (80.5) 460 (11.8) 3,444 (88.2)
Charlson comorbidity index <0.0001 <0.0001
0 32,269 (63.3) 16,084 (49.8) 16,185 (50.2) 6,830 (21.2) 25,439 (78.8)
1 12,964 (25.4) 6,808 (52.5) 6,156 (47.5) 2,580 (19.9) 10,384 (80.1)
2 3,861 (7.6) 2,215 (57.4) 1,646 (42.6) 919 (23.8) 2,942 (76.2)
≥3 1,860 (3.7) 972 (52.3) 888 (47.7) 574 (30.9) 1,286 (69.1)
No. of healthcare institution per 10,000 population 6.2±2.3 6.3±2.3 6.1±2.2 <0.0001 6.3±2.3 6.2±2.3 <0.0001 No. of doctors per 10,000 population 0.2±0.2 0.2±0.2 0.2±0.2 0.3613 0.2±0.2 0.2±0.2 0.0726 Values are presented as number (%) or mean±standard deviation.
NHI, national health insurance.
Table 1. Demographic characteristics of individuals and neighborhoods for onset of diabetes complication and diabetes-related hospitalization by follow-up period
1.0 0.8 0.6 0.4 0.2 0 0 1 2 3 4 5 6 7 8 9 High in advantaged Hing in disadvantated Middle in advantaged Middle in disadvantated Low in advantaged Low in disadvantated
p-value <0.0001 by log-rank test
Time (yr)
Figure 2. Cumulative incidence of diabetes complication according to individual income–neighborhood deprivation.
1.0 0.8 0.6 0.4 0.2 0
p-value <0.0001 by log-rank test
0 1 2 3 4 5 6 7 8 9 High in advantaged Hing in disadvantated Middle in advantaged Middle in disadvantated Low in advantaged Low in disadvantated Time (yr)
Variable Onset of diabetes complication Diabetes-related hospitalization Individual income–neighborhood deprivation
High in advantaged 1.00 1.00 High in disadvantaged 1.06 (1.00–1.11) 1.05 (0.97–1.14) Middle in advantaged 1.02 (0.99–1.06) 1.17 (1.11–1.24) Middle in disadvantaged 1.08 (1.03–1.14) 1.15 (1.06–1.24) Low in advantaged 1.04 (1.00–1.08) 1.25 (1.17–1.33) Low in disadvantaged 1.10 (1.05–1.16) 1.29 (1.19–1.41) Gender Male 1.00 1.00 Female 1.00 (0.97–1.02) 0.73 (0.70–0.76) Age (yr) 30–39 1.00 1.00 40–49 1.48 (1.41–1.56) 1.26 (1.17–1.36) 50–59 1.93 (1.84–2.03) 1.44 (1.34–1.56) 60–69 2.37 (2.26–2.49) 1.73 (1.60–1.86) ≥70 2.70 (2.56–2.85) 2.59 (2.39–2.81) Region Capital region 1.00 1.00 Metropolitan 1.00 (0.96–1.04) 1.11 (1.04–1.18) Others 1.02 (0.98–1.06) 1.21 (1.14–1.29) Insurance coverage
NHI, self-employed insured 1.00 1.00
NHI, employee insured 0.99 (0.97–1.02) 0.92 (0.88–0.95)
Medical aid 1.34 (1.26–1.43) 1.44 (1.32–1.57)
Disability
Non-disabled 1.00 1.00
Disabled 1.12 (1.07–1.17) 1.42 (1.34–1.51)
Year of diabetes diagnosis
2004 1.00 1.00 2005 0.92 (0.89–0.96) 0.86 (0.81–0.91) 2006 0.96 (0.92–1.00) 0.96 (0.90–1.03) 2007 0.95 (0.90–0.99) 1.02 (0.95–1.10) 2008 0.95 (0.91–1.00) 1.05 (0.97–1.13) 2009 0.90 (0.86–0.95) 1.11 (1.03–1.20) 2010 0.88 (0.83–0.93) 1.12 (1.03–1.23) 2011 0.96 (0.90–1.01) 1.12 (1.02–1.22) 2012 0.86 (0.80–0.93) 1.16 (1.05–1.29)
Charlson comorbidity index
0 1.00 1.00
1 1.09 (1.06–1.13) 0.96 (0.92–1.00)
2 1.23 (1.17–1.28) 1.13 (1.05–1.21)
≥3 1.28 (1.20–1.37) 1.65 (1.51–1.80)
No. of healthcare institution per 10,000 population 0.88 (0.78–0.99) 0.93 (0.77–1.12)
No. of doctors per 10,000 population 1.01 (1.00–1.02) 1.00 (0.99–1.02)
Values are presented as hazard ratio (95% confidence interval). NHI, national health insurance.
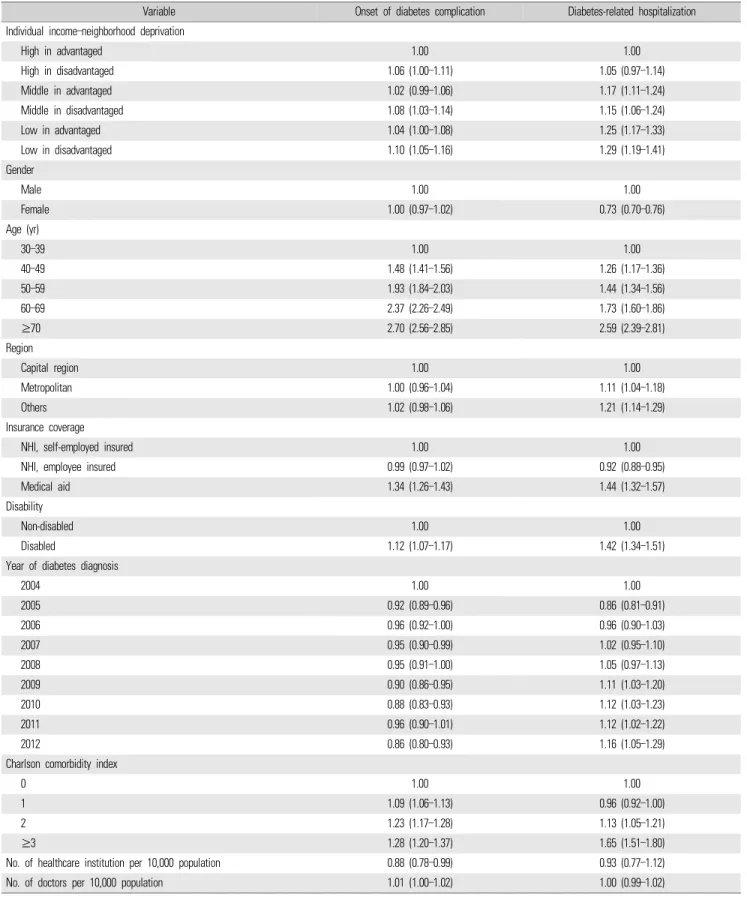
당뇨와 관련된 입원 발생위험이 가장 높은 것으로 확인되었다. Table 2는 개인의 소득수준과 지역의 사회경제적 수준의 결합효과 에 따른 제2형 당뇨 신환자에서 당뇨합병증 발생위험과 당뇨와 관련 된 입원위험에 대해 공유 프레일티 모형을 고려한 생존분석(Cox proportional-hazard regression model using a shared frailty model)을 진행한 결과이다. 개인적 특성과 사회간접자본(해당 시군구의 10,000당 요양기관 수, 인구 10,000당 의사 수)을 모두 보정한 후에도 강건한 경향성을 보였다. 높은 개인소득–높은 지역 사회경제적 수준의 그룹(high in advantaged)에 비해 중간 개인소득–낮은 지역박탈 그룹(middle in advantaged)은 당뇨합병증 발생위험이 1.02배(HR, 1.02; 95% CI, 0.99 –1.06)였고, 낮은 개인소득–낮은 지역박탈 그룹(low in advantaged)은 당뇨합병증 발생위험이 1.04배(HR, 1.04; 95% CI, 1.00–1.08)였다. 즉 개인 소득수준이 낮을수록 당뇨합병증 발생위험이 다소 증가하는 것 을 확인하였다. 개인 소득수준과 지역의 사회경제적 수준의 결합효과 측면에서는, 동일하게 낮은 개인 소득수준이어도 높은 지역 사회경제적 수준의 그 룹(low in advantaged)은 당뇨합병증 발생위험이 1.04배(HR, 1.04; 95% CI, 1.00–1.08), 낮은 지역 사회경제적 수준의 그룹(low in disadvantaged)에서는 당뇨합병증 발생위험이 1.10배(HR, 1.10; 95% CI, 1.05–1.16)로 사회경제적 수준이 낮은 지역에 거주할수록 당뇨합 병증 발생위험이 높았다. 또한 높은 개인소득의 낮은 지역 사회경제적 수준의 그룹(high in disadvantaged)은 당뇨합병증 발생위험이 1.06배(HR, 1.06; 95% CI, 1.00–1.11)였고, 낮은 개인소득–높은 지역 사회경제적 수준의 그룹 (low in advantaged)의 당뇨합병증 발생위험은 1.04배(HR, 1.04; 95% CI, 1.00–1.08)로 낮은 개인 소득수준이어도 지역의 높은 사회경제적 수준이 당뇨 발생위험을 약간 완화시키는 것과 관련 있는 것으로 보 였다. 당뇨와 관련된 입원위험의 경우, 높은 개인소득의 높은 지역의 사 회경제적 수준 그룹(high in advantaged)에 비해 중간 개인소득의 높 은 지역의 사회경제적 수준의 그룹(middle in advantaged)은 입원위 험이 1.17배(HR, 1.17; 95% CI, 1.11–1.24)였고, 낮은 개인소득의 높은 지역의 사회경제적 수준의 그룹(low in advantaged)은 입원위험이 1.25배(HR, 1.25; 95% CI, 1.17–1.33)였다. 즉 개인 소득수준이 낮을수 록 당뇨와 관련된 입원위험이 증가하는 것을 확인하였다. 개인의 소득수준과 지역의 사회경제적 수준의 결합효과 측면에서 는 동일하게 낮은 개인 소득수준이어도 지역의 사회경제적 수준이 높 은 그룹(low in advantaged)보다 지역의 사회경제적 수준이 낮은 그룹 (low in disadvantaged)에서 당뇨와 관련된 입원위험은 1.29배(HR, 1.29; 95% CI, 1.19–1.41)로 가장 높음을 확인하였다.
고 찰
이번 연구는 국민건강보험공단 표본 코호트 자료를 활용하여 제2 형 당뇨 환자의 당뇨합병증 발생위험과 당뇨와 관련된 입원위험에 대 한 개인소득과 지역의 사회경제적 수준의 결합효과를 조사했다. 개 인소득이 낮으면서 낮은 사회경제적 수준의 지역에 거주하는 제2형 당뇨 환자는 다양한 인구학적 특성과 동반질환에 대해 보정한 후에도 당뇨합병증 발생위험과 당뇨와 관련된 입원위험이 가장 높았다. 또 한 동일한 개인 소득수준에 속해도 사회경제적 수준이 낮은 지역 거 주자는 사회경제적 수준이 높은 지역거주자보다 당뇨합병증 발생위 험과 당뇨와 관련된 입원 발생위험이 높았다. 흥미롭게도 당뇨합병 증 발생위험은 낮은 개인 소득수준의 사회경제적 수준이 높은 지역 거주자인 경우 높은 개인 소득수준이더라도 낮은 사회경제적 수준의 지역의 거주자보다 당뇨합병증 발생위험이 다소 낮아지는 것을 확인 하였다. 즉 개인 소득수준과 지역의 사회경제적 수준의 상호작용 효 과가 있는 것으로 확인되었다. 당뇨로 인한 입원의 경우 개인의 소득 수준이 특히 영향을 미치는 것을 확인하였다. 이 연구에서는 개인 소득수준과 당뇨의 건강결과의 관련성에 있어 낮은 개인 소득수준과 부정적인 당뇨의 건강결과의 관련성을 높은 지 역사회의 경제적 수준이 감소시키는 방향으로 작용하는 것을 확인하 였다. 개인의 사회경제적 수준을 나타내는 대표적인 지표인 개인의 소득수준과 당뇨 건강결과의 관계에 대해선 다수의 선행논문에서 연 구된 바 있다[7,19,20]. 당뇨 환자에 있어 개인의 사회경제적 수준은 당뇨 관련 지식, 의료공급자와의 커뮤니케이션, 권장되는 약물, 운동 및 식이요법의 준수 정도, 치료방법 등에 대한 선택에 영향을 미칠 수 있다[7]. 이 연구에서는 개인의 낮은 개인 소득수준과 당뇨로 인한 입 원위험의 높은 관련성을 확인하였는데, 이는 Brown 등[7]이 제시한 결과와도 일치하였다. 또한 개인의 사회경제적 수준은 사회적 지원 및 지역사회 자원에 대한 접근에도 영향을 미칠 수 있다[7]. 동일한 개인 소득수준의 당뇨 환자라도 지역의 사회경제적 수준이 낮을수록 당뇨합병증과 당뇨와 관련된 입원 발생위험이 높은 것은 여 러 가지 근거로 설명될 수 있다. 먼저 지역의 낮은 사회경제적 수준은 사회구성원 간 상호 신뢰성, 협력을 위한 소셜 네트워크 등 사회적 자 본을 통한 사회심리적 지지의 부재를 야기할 수 있으며, 이는 건강 관 련 지식의 공유와 의료자원 접근성을 감소시킬 수 있는 것으로 알려 져 있다[21]. 이 밖에도 낮은 지역 사회경제적 수준은 사회적 규범이 취약하거나 약한 사회적 응집력과 관련 있으며, 이는 지역사회의 건강한 생활습관 함양에 장애가 될 수 있고, 높은 지역박탈은 소음, 폭력, 등의 만성스트레스에 노출될 확률을 높여 부정적 건강영향을 미칠 수 있다[22]. 또한 지역의 사회경제적 수준은 신체활동, 식이습관, 음주행태 등 만성질환의 유사한 행동 병인을 공유함으로써 만성질환 발생 및 관리 와 관련 있는 것으로 알려져 있다[23]. 신체활동의 경우 사회경제적 수준이 낮은 지역은 사회경제적 수준이 높은 지역보다 신체활동 참여 에 영향을 미칠 수 있는 물리적 환경수준(산책을 할 수 있는 공원 등의 시설 수, 보도시설, 교통체증)과 안전과 범죄율에 대한 박탈수준이 높 을 확률이 크다[24-27]. 이런 요인들이 당뇨와 같은 만성질환관리에 영향을 줄 수 있다. 높은 소득수준이면서 높은 사회경제적 수준의 지역에 거주자일수 록 당뇨합병증 발생위험과 당뇨와 관련된 입원위험이 낮았는데, 이 는 높은 소득수준이면서 사회경제적 수준이 높은 지역의 거주자가 의 료접근도가 높을 뿐만 아니라 지역의 풍부한 건강관리 자원을 활용해 더 적극적인 건강관리를 하는 경향이 높은 것과 관련 있을 수 있다 [8,28,29]. 고소득층의 개인은 지식, 재원 및 사회적 연결망을 통해 건 강한 생활방식을 유지하는 능력이 높다[21]. 또한 저소득층에 비해 고 소득층은 예방을 위한 건강검진 등을 수검하고 기타 건강관리서비스 를 받을 가능성이 높으며 치료혁신을 활용하는 확률이 높다[30,31]. 이러한 높은 소득수준에 따른 건강관리행태는 지역의 높은 사회경제 적 수준과 결합효과를 내어 당뇨와 같은 만성질환관리에 영향을 줄 수 있다. 한편, 당뇨와 같은 만성질환관리는 지역박탈수준과 같은 지역사회 자원 및 정책 등의 특성이 관련이 있는 것으로 알려져 있다. 만성질환 관리를 위한 중요한 요소를 제시한 만성질환관리모형(Chronic Care Model)에서는 지역사회 자원 및 정책(community resources and policies)의 연계를 만성질환관리 중요 요인 중 하나로 제시하고 있다 [32]. 지역사회 자원 및 정책과 만성질환관리 간의 적절한 연계가 이 루어진다면 보건의료체계 수행이 향상될 것으로 알려져 있다. 즉 적 절한 지역사회 자원 및 정책의 특성이 수반되는 경우 그렇지 않은 경 우보다 만성질환관리가 효과적으로 이루어질 수 있다. 연구의 한계점은 먼저 건강보험 청구 데이터 활용의 한계로 당뇨관 리에 영향을 미치는 것으로 알려진 신체활동수준, 흡연, 음주, 체질량 지수 등과 같은 누락변수(omitted variables)가 존재할 수 있다는 점이 다. 국가 일반건강검진 데이터가 존재하는 국민건강보험공단 건강검 진 코호트의 경우 시군구 수준의 지역구분 변수를 제공하지 않고 있 어 지역박탈변수 생성이 불가능하여 활용할 수 없었다. 개인 소득수 준과 지역의 사회경제적 수준의 결합효과가 당뇨관리에 미치는 관련 성의 정밀한 분석을 위해 추후 의료이용 데이터뿐만 아니라 신체활 동, 흡연, 음주 등 건강행태까지 아우르는 데이터를 활용한 연구가 필 요할 것으로 생각된다. 둘째, 마찬가지로 데이터의 구득의 한계로 유 병기간이 긴 당뇨 환자는 분석에서 제외되었다는 점이다. 이는 추후 축적된 건강보험 데이터를 바탕으로 한 연구를 통해 극복할 수 있을 것으로 생각된다. 셋째, 당뇨 중증도를 고려하지 못하였다는 점이다. 그러나 이는 당뇨 진단연도를 보정하고 찰슨 동반질환지수를 보정함 으로써 이로 인한 영향을 최소화하고자 하였다. 많은 한계점이 있음에도 연구는 몇 가지 강점을 가지고 있다. 전 국 민을 대표성 있게 성 · 연령 · 지역 층화 추출한 국민건강보험공단 표 본 코호트를 사용함으로써 우리나라 전체 인구에 대한 대표성을 확보 한 자료라고 볼 수 있다. 또한 코호트 디자인 설계를 통해 질병 사이의 선후관계를 명확히 하여 단면연구에 비해 인과성 수준을 강화하였다 는 점이다. 마지막으로 지역단위 변량효과를 고려하여 공유 프레일 티 모형(shared frailty model)을 적용한 비례위험함수 회귀모형을 활 용함으로써 통계분석의 정확성을 높였다는 점이다. 종합하면 동일한 소득계층에 속하여도 사회경제적 수준이 낮은 지 역 거주자는 당뇨합병증 발생위험과 당뇨와 관련된 입원 발생위험이 가장 높았으며, 낮은 개인 소득수준과 부정적인 당뇨의 건강결과의 관련성을 높은 사회경제적 수준이 더 감소시키는 방향으로 작용하는 것을 확인하였다. 정확한 메커니즘을 결정하기 위해 추가 연구가 수 행해야 되지만, 개인 소득수준뿐만 아니라 지역의 사회적, 경제적 요 인이 당뇨관리에 중요한 역할을 할 수 있는 것으로 확인되었다. 이러 한 연구결과는 중요한 임상 및 공중보건 문제를 제기하고 보건의료정 책을 설계할 때 개인 및 지역수준의 접근방식을 모두 고려해야 함을 나타낸다. 더욱이 재정적 장벽이 당뇨관리에 미치는 직접적인 건강 영향을 감소시킬 수 있도록 지역의 물리 · 사회적 자원의 효율적 배분 및 환경조성을 통해 지역 간 격차를 줄임으로써 지역주민의 건강수준 향상 도모가 필요할 것이다.
감사의 글
이 연구는 국민건강증진기금의 재원으로 질병관리청 만성질환관 리과의 지원을 받아 수행되었다(no., 2733-5488).ORCID
Jieun Jang: https://orcid.org/0000-0003-1797-8649; Yeong Jun Ju: https://orcid.org/0000-0003-4891-0524;
Doo Woong Lee: https://orcid.org/0000-0002-8843-2099; Sang Ah Lee: https://orcid.org/0000-0001-5415-0141; Sarah Soyeon Oh: https://orcid.org/0000-0001-5709-2311; Dong-Woo Choi: https://orcid.org/0000-0001-5462-7579; Hyeon Ji Lee: https://orcid.org/0000-0002-7874-593X; Jaeyong Shin: https://orcid.org/0000-0002-2955-6382
REFERENCES
1. Ogurtsova K, da Rocha Fernandes JD, Huang Y, Linnenkamp U, Guariguata L, Cho NH, et al. IDF Diabetes Atlas: global estimates for the prevalence of diabetes for 2015 and 2040. Diabetes Res Clin Pract 2017;128:40-50. DOI: https://doi.org/10.1016/j.diabres.2017.03.024. 2. Korea Disease Control and Prevention Agency. Noncommunicable
disease (NCD) statistics: trends in prevalence of diabetes among Korean adults aged 30 years and over, 2007-2018. Public Health Wkly Rep 2019;12(44):1928-1929.
3. Health Insurance Review and Assessment Service; National Health Insurance Service. 2017 National health insurance statistical yearbook. Wonju: National Health Insurance Service; 2018.
4. Shrivastava SR, Shrivastava PS, Ramasamy J. Role of self-care in man-agement of diabetes mellitus. J Diabetes Metab Disord 2013;12(1):14. DOI: https://doi.org/10.1186/2251-6581-12-14.
5. Connolly V, Unwin N, Sherriff P, Bilous R, Kelly W. Diabetes preva-lence and socioeconomic status: a population based study showing increased prevalence of type 2 diabetes mellitus in deprived areas. J Epidemiol Community Health 2000;54(3):173-177. DOI: https://do-i.org/10.1136/jech.54.3.173.
6. Evans JM, Newton RW, Ruta DA, MacDonald TM, Morris AD. Socio-economic status, obesity and prevalence of type 1 and type 2 diabetes mellitus. Diabet Med 2000;17(6):478-480. DOI: https://do-i.org/10.1046/j.1464-5491.2000.00309.x.
7. Brown AF, Ettner SL, Piette J, Weinberger M, Gregg E, Shapiro MF, et al. Socioeconomic position and health among persons with diabetes mellitus: a conceptual framework and review of the literature. Epidemiol Rev 2004;26:63-77. DOI: https://doi.org/10.1093/epi-rev/mxh002.
8. Booth GL, Hux JE. Relationship between avoidable hospitalizations for diabetes mellitus and income level. Arch Intern Med 2003; 163(1):101-106. DOI: https://doi.org/10.1001/archinte.163.1.101. 9. Tol A, Sharifirad G, Shojaezadeh D, Tavasoli E, Azadbakht L.
Socio-economic factors and diabetes consequences among patients with type 2 diabetes. J Educ Health Promot 2013;2:12. DOI: https://doi.org/10.4103/2277-9531.108009.
10. Chen PC, Tsai CY, Woung LC, Lee YC. Socioeconomic disparities in preventable hospitalization among adults with diabetes in Taiwan: a multilevel modelling approach. Int J Equity Health 2015;14:31. DOI: https://doi.org/10.1186/s12939-015-0160-4. 11. Choi DW, Lee SA, Lee DW, Joo JH, Han KT, Kim S, et al. Effect of
socioeconomic deprivation on outcomes of diabetes complications in patients with type 2 diabetes mellitus: a nationwide population- based cohort study of South Korea. BMJ Open Diabetes Res Care 2020;8(1):e000729. DOI: https://doi.org/10.1136/bmjdrc-2019-000729. 12. Kim YH, Cho YT. Impact of area characteristics on the health of vul-nerable populations in Seoul. Korea J Popul Stud 2008;31(1):1-26. 13. Jo EK, Seo EW, Lee KS. Spatial distribution of diabetes prevalence
rates and its relationship with the regional characteristics. Health Policy Manag 2016;26(1):30-38. DOI: https://doi.org/10.4332/ KJHPA.2016.26.1.30.
14. Chang M, Shim IS. An empirical study on factor associated with mood disorders in elderly: focusing on the influence of community characteristics. Health Policy Manag 2017;27(2):177-185. DOI: https://doi.org/10.4332/KJHPA.2017.27.2.177.
15. Kim D, Lee S, Ki M, Kim M, Kim S, Kim Y, et al. Developing health inequalities indicators and monitoring the status of health inequal-ities in Korea. Sejong: Korea Institute for Health and Social Affairs; 2013.
16. Youn HM, Lee DW, Park EC. Association between community out-patient clinic care accessibility and the uptake of diabetic retinop-athy screening: a multi-level analysis. Prim Care Diabetes 2020; 14(6): 616-621. DOI: https://doi.org/10.1016/j.pcd.2020.02.010. 17. Glasheen WP, Renda A, Dong Y. Diabetes Complications Severity
Index (DCSI): update and ICD-10 translation. J Diabetes Complications 2017;31(6):1007-1013. DOI: https://doi.org/10.1016/ j.jdiacomp.2017.02.018.
18. Yoo H, Choo E, Lee S. Study of hospitalization and mortality in Korean diabetic patients using the diabetes complications severity index. BMC Endocr Disord 2020;20(1):122. DOI: https://do-i.org/10.1186/s12902-020-00605-5.
19. Agardh E, Allebeck P, Hallqvist J, Moradi T, Sidorchuk A. Type 2 diabetes incidence and socio-economic position: a systematic re-view and meta-analysis. Int J Epidemiol 2011;40(3):804-818. DOI: https://doi.org/10.1093/ije/dyr029.
Dalmau-Bueno A, et al. Socioeconomic inequalities in diabetes mel-litus across Europe at the beginning of the 21st century. Diabetologia 2008;51(11):1971-1979. DOI: https://doi.org/10.1007/ s00125-008- 1146-1.
21. Cho KH, Nam CM, Lee EJ, Choi Y, Yoo KB, Lee SH, et al. Effects of individual and neighborhood socioeconomic status on the risk of all-cause mortality in chronic obstructive pulmonary disease: a na-tionwide population-based cohort study, 2002-2013. Respir Med 2016;114:9-17. DOI: https://doi.org/10.1016/j.rmed.2016.03.003. 22. Roos LL, Magoon J, Gupta S, Chateau D, Veugelers PJ.
Socioeconomic determinants of mortality in two Canadian prov-inces: multilevel modelling and neighborhood context. Soc Sci Med 2004;59(7):1435-1447. DOI: https://doi.org/10.1016/j.socscimed. 2004. 01.024.
23. Rachele JN, Giles-Corti B, Turrell G. Neighbourhood disadvantage and self-reported type 2 diabetes, heart disease and comorbidity: a cross-sectional multilevel study. Ann Epidemiol 2016;26(2): 146-150. DOI: https://doi.org/10.1016/j.annepidem.2015.11.008. 24. Wardle J, Steptoe A. Socioeconomic differences in attitudes and
be-liefs about healthy lifestyles. J Epidemiol Community Health 2003;57(6):440-443. DOI: https://doi.org/10.1136/jech.57.6.440. 25. Browning CR, Cagney KA. Neighborhood structural disadvantage,
collective efficacy, and self-rated physical health in an urban setting. J Health Soc Behav 2002;43(4):383-399. DOI: https://doi.org/ 10.2307/3090233.
26. Molnar BE, Gortmaker SL, Bull FC, Buka SL. Unsafe to play?:
neigh-borhood disorder and lack of safety predict reduced physical activity among urban children and adolescents. Am J Health Promot 2004; 18(5):378-386. DOI: https://doi.org/10.4278/0890-1171-18.5.378. 27. Duncan MJ, Spence JC, Mummery WK. Perceived environment and
physical activity: a meta-analysis of selected environmental characteristics. Int J Behav Nutr Phys Act 2005;2:11. DOI: https:// doi.org/10.1186/1479-5868-2-11.
28. Hofer TP, Katz SJ. Healthy behaviors among women in the United States and Ontario: the effect on use of preventive care. Am J Public Health 1996;86(12):1755-1759. DOI: https://doi.org/10.2105/ajph. 86.12.1755.
29. Katz SJ, Hofer TP. Socioeconomic disparities in preventive care per-sist despite universal coverage. Breast and cervical cancer screening in Ontario and the United States. JAMA 1994;272(7):530-534. DOI: https://doi.org/10.1001/jama.1994.03520070050037.
30. Roos LL, Walld R. Neighbourhood, family and health care. Can J Public Health 2007;98(Suppl 1):S54-S61. DOI: https://doi.org/10.1007 /BF03403727.
31. Roos NP, Mustard CA. Variation in health and health care use by so-cioeconomic status in Winnipeg, Canada: does the system work well?: yes and no. Milbank Q 1997;75(1):89-111. DOI: https://do-i.org/10.1111/1468-0009.00045.
32. Coleman K, Austin BT, Brach C, Wagner EH. Evidence on the Chronic Care Model in the new millennium. Health Aff (Millwood) 2009;28(1):75-85. DOI: https://doi.org/10.1377/hlthaff.28.1.75.
Category Description KCD-7
Nephropathy Diabetic nephropathy E112, H1020, H1121, N083
Acute glomerulonephritis N008, N009, N019,
Chronic glomerulonephritis N038, N031, N035, N039
Glomerular disorders in other disease classified N088
Nephrotic syndrome N040, N042, N045, N048, N049
Nephritis/nephropathy N052, N055, N058, N059
Chronic renal failure N189
Unspecified kidney failure N19
Renal insufficiency N289
Neuropathy Diabetic neuropathy E114, G609
Cranial nerve palsy S041, S042, S044
Mono-neuropathy G56, G57, G58
Polyneuropathy G632
Neuropathic arthropathy M146
Neurogenic bladder N319
Autonomic neuropathy K591, K3188
Orthostatic hypotension I951
Retinopathy Diabetic ophthalmologic disease E113
Background retinopathy H350
Other retinopathy H360
Retinal edema H358
Clinically significant macular edema H353
Other retinal disorders H356
Vitreous hemorrhage H431
Retinal detachment H33
Blindness H540
Cerebrovascular disease Transient cerebral ischemic attacks G45
Stroke I61, I63, I64
Cardiovascular disease Atherosclerosis I70
Angina pectoris I20
Other acute ischemic heart diseases I24
Chronic ischemic heart diseases I25
Other aneurysm, lower extreme I72
Myocardial infarction I21
Ventricular fibrillation, arrest I472
Atrial fibrillation, arrest I48, I49, I46
Congestive heart failure I500
Aortic aneurysm, dissection I71
Peripheral vascular disease Diabetic peripheral vascular disease E1151, I792
Peripheral vascular disease I739
Embolism/thrombosis (lower extremity) I743
Gangrene R02
Ulcer of lower limbs L97
Acute metabolic complications Ketoacidosis E1110
Hyperosmolar E1100
Other coma E1101, E1102, E1103, E1104
From Glasheen et al. J Diabetes Complications 2017;31(6):1007-1013 [17]; From Yoo et al. BMC Endocr Disord 2020;20(1):122 [18]. KCD-7, Korean Standard Classification of Diseases-7.