O R I G I N A L I N V E S T I G A T I O N
Open Access
Increased arterial stiffness in healthy subjects
with high-normal glucose levels and in subjects
with pre-diabetes
Jin Young Shin
1, Hye Ree Lee
1and Duk Chul Lee
2*Abstract
Background: Increased fasting plasma glucose (FPG), which includes impaired fasting glucose (IFG), impaired glucose tolerance (IGT), and diabetes, is a risk factor for arterial stiffness. While IFG is widely accepted as a cardiovascular risk factor, recent studies have argued that subjects with high-normal glucose level were characterized by a high incidence of cardiovascular disease. The purpose of this study is to investigate the relationship between FPG and arterial stiffness in non-diabetic healthy subjects.
Methods: We recruited 697 subjects who visited the health promotion center of a university hospital from May 2007 to August 2008. Age, sex, body mass index (BMI), resting heart rate, smoking habits, alcohol intake, exercise, blood pressure, medical history, FPG, lipid profile, high sensitivity C-reactive protein (hs-CRP), and Brachial-ankle pulse wave velocity (ba-PWV) were measured. We performed correlation and multiple linear regression analyses to divide the research subjects into quartiles: Q1(n = 172), 65 mg/dL≤FPG < 84 mg/dL; Q2(n = 188), 84 mg/dL ≤FPG < 91 mg/dl; Q3(n = 199), 91 mg/dL≤FPG < 100 mg/dL; Q4(n = 138), 100 mg/dL ≤FPG < 126 mg/dL.
Results: FPG has an independent, positive association with ba-PWV in non-diabetic subjects after correcting for confounding variables, including age, sex, BMI, blood pressure, resting heart rate, hs-CRP, lipid profile, and behavioral habits. The mean ba-PWV of the high-normal glucose group (Q3, 1384 cm/s) was higher than that of the low-normal glucose group (1303 ± 196 cm/s vs.1328 ± 167 cm/s, P < 0.05). The mean ba-PWV value in the IFG group (1469 ± 220 cm/s) was higher than that in the normoglycemic group (P < 0.05, respectively).
Conclusions: An increase in FPG, even within the normal range, was associated with aggravated arterial stiffness. Further research is needed to determine the glycemic target value for the prevention of arterial stiffness in clinical and public health settings.
Background
Increased fasting plasma glucose (FPG), which includes impaired fasting glucose (IFG), impaired glucose toler-ance (IGT), and diabetes, is a risk factor for arterial stiff-ness and cardiovascular disease [1-4]. Because there is no threshold glucose level to indicate the development of vascular disease, determining the appropriate target FPG level for the prevention of cardiovascular risk is a topic of active research [5-7]. While IFG is widely accepted as a cardiovascular risk factor, recent studies have demonstrated that subjects with high-normal
glucose level are characterized by a high incidence of cardiovascular disease [8-10]. This finding indicates that, even in the normal range, increased FPG can be asso-ciated with aggravation of arterial stiffness, which is considered an early marker of atherosclerosis.
Arterial stiffness can be easily and noninvasively assessed by measuring the pulse wave velocity (PWV) [11,12]. Brachial-ankle PWV (ba-PWV) is a suitable measure for screening for vascular dysfunction and the development of atherosclerosis in a preventive setting [13,14]. We assessed whether the FPG level is associated with arterial stiffness by measuring ba-PWV in non-diabetic healthy subjects with no history of cardiovascular disease, hypertension, or dyslipidemia.
* Correspondence: [email protected]
2
Department of Family Medicine, Severance Hospital, Yonsei University College of Medicine, Seoul, Korea
Full list of author information is available at the end of the article
© 2011 Shin et al; licensee BioMed Central Ltd. This is an Open Access article distributed under the terms of the Creative Commons Attribution License (http://creativecommons.org/licenses/by/2.0), which permits unrestricted use, distribution, and reproduction in any medium, provided the original work is properly cited.
Methods
Study Population
We recruited 856 non-diabetic subjects who visited the health promotion center of a university hospital from May 2007 to August 2008. We excluded 152 subjects with history of anti-diabetes medication; anti-hypertensive medication; lipid-lowering medication; stroke; or cardio-vascular disease, such as coronary heart disease, peripheral arterial disease, arrhythmia, congestive heart failure, or valvular heart disease. We also excluded six subjects who had extremely low FPG levels (50-65 mg/dL) and one sub-ject who had a low ankle-brachial index (ABI) (<0.9), which suggested the subject might have had peripheral arterial occlusive disease. After the exclusions, 697 subjects were included in this study. The institutional review board of Gangnam Severance Hospital, Yonsei University College of Medicine approved this study, and informed consent was obtained from each participant.
The study sample was divided into four groups accord-ing to FPG level. Usaccord-ing the diagnostic criteria of the American Diabetes Association [15], after grouping the IFG subjects (Q4, 100 mg/dL≤FPG<126 mg/dL), FPG levels were categorized into quartiles: Q1(n = 172), 65 mg/dL ≤FPG<84 mg/dL; Q2(n = 188), 84 mg/dL ≤FPG<91 mg/dl; and Q3(n = 199), 91 mg/dL ≤FPG< 100 mg/dL, Q4(n = 138):100 mg/dL≤FPG<126 mg/dL. Blood pressure and resting heart rate were measured after resting for more than five minutes. Anthropometric mea-surements were used to calculate the body mass index (BMI). To reduce inter-observer variation in measure-ments, one researcher measured all anthropometric para-meters throughout the study. A questionnaire was used to obtain information about participant medical history and lifestyle, such as exercise, smoking habits, and alcohol ingestion. Subjects were instructed to refrain from alcohol on the day before testing and from smoking, coffee, tea, and pain medication on the day of measurement.
After an overnight fast, serum glucose, total choles-terol and high density lipoprotein (HDL)-cholescholes-terol levels were measured via enzymatic procedures using an autoanalyser (Bayer, Terrytown, NY, USA). Non-high density lipoprotein (HDL) cholesterol was calculated by subtracting HDL-cholesterol from total cholesterol. Non-HDL cholesterol includes all known potential atherogenic lipid particles. All variables were adjusted according to non-HDL cholesterol because it is a useful predictor of risk for cardiovascular disease [16,17]. High-sensitivity C-reactive protein (hs-CRP) was mea-sured using a latex-enhanced immunoturbidimetric assay in an ADVIA 1650 Chemistry System (Bayer).
PWV Measurement
The ba-PWV was measured using a volume plethysmo-graphic instrument (PWV/ABI, Colin Co, Komaki, Japan).
This device records a phonocardiogram, electrocardio-gram, volume pulse form, and arterial blood pressure at the left and the right brachial arteries and ankles. The ba-PWV was calculated using time-phase analysis between the right brachial artery pressure and the volume wave-forms at both ankles. The distance between the right brachium and the ankle was estimated based on the subject’s height. We used the mean ba-PWV in analyses because the right and the left ba-PWV are significantly correlated [18]. Both ba-PWV values were measured after allowing the patient to rest in the supine position for at least five minutes in an air-conditioned room (24 to 26°C). The validity, reliability, and reproducibility of this instru-ment were assessed in a previous study [19].
Statistical Analysis
SAS 9·1 was used for statistical analyses (SAS Institute, Cary, NC, USA). Mean values of the clinical characteris-tics were compared among the four subject groups using one-way analysis for continuous variables and the Chi-squared test for categorical variables. Because of the skewed distribution of hs-CRP, this parameter was loga-rithmically transform; however, untransformed raw data are presented for the mean ± standard deviation (SD) in tables. Pearson’s correlation coefficients were calculated to evaluate the relationships between ba-PWV and clini-cal variables. After adjusting for age, sex, blood pressure (systolic/diastolic), body mass index, resting heart rate, hs-CRP, HDL-cholesterol, non-HDL cholesterol, exer-cise, smoking, and alcohol ingestion, a multiple linear regression analysis was performed to identify any inde-pendent associations between ba-PWV and FPG level. The mean ba-PWV of the quartile was analyzed using an ANCOVA test considering confounding factors. P values less than 0.05 were considered statistically significant.
Results
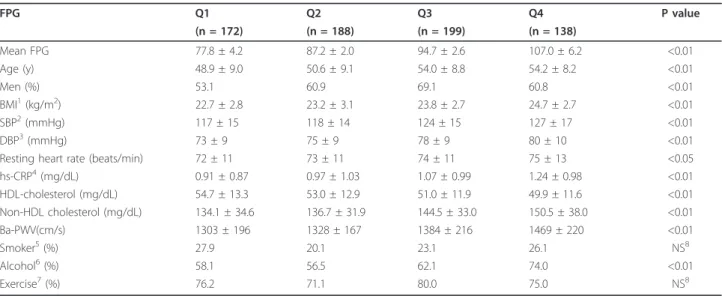
The characteristics of the 697 subjects enrolled in this study are shown in Table 1. The subjects were adults between 20 and 79 years of age, with a mean age of 52.3 ± 9.1 years. The mean glucose levels were as follows: Q1 (77.8 ± 4.2 mg/dl), Q2 (87.2 ± 2.0 mg/dl), Q3 (94.7 ± 2.5 mg/dl), and Q4 (107.0 ± 6.2 mg/dl). In addition, BMI, systolic blood pressure, diastolic blood pressure, hs-CRP, resting heart rate, non-HDL cholesterol, male: female ratio, and alcohol ingestion were also different between the four groups (P<0.01 vs. P<0.05, respectively).
In age-adjusted Pearson’s correlations, ba-PWV level was positively correlated with FPG level, systolic blood pressure, diastolic blood pressure, BMI, resting heart rate, hs-CRP, and non-HDL cholesterol, and ba-PWV level was negatively correlated with HDL-cholesterol, as shown in Table 2. Smoking habits, alcohol ingestion,
and exercise were not correlated with ba-PWV. The mean PWV increased according to FPG quartile, as shown in Table 1. The mean ba-PWV value of the high-normal glucose group (Q3) was higher than those of the low-normal glucose groups (Q1, Q2). Even after adjusting the parameters, the mean ba-PWV in Q3 was higher than that of the low-normal glucose group (Q1). The mean ba-PWV value in the IFG group (Q4) (1438 cm/s) was higher than those of the normal glucose groups (P < 0.05; Figure 1) after adjustments for age, sex, body mass index, systolic blood pressure, diastolic
blood pressure, resting heart rate, HDL-cholesterol, non-HDL cholesterol, and hs-CRP (logarithmically transformed).
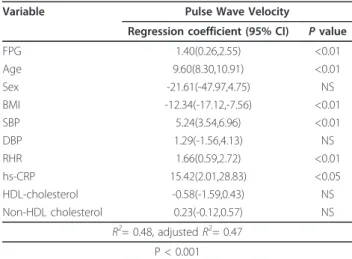
Through multiple linear regression analysis, ba-PWV was found to be independently and positively associated with FPG, as shown in Table 3. Ba-PWV was indepen-dently and negatively associated with BMI but was not associated with diastolic blood pressure, male: female ratio, HDL-cholesterol, or non-HDL cholesterol.
Table 1 Clinical and metabolic characteristics of study participants according to fasting plasma glucose quartile (n = 697)
FPG Q1 Q2 Q3 Q4 P value (n = 172) (n = 188) (n = 199) (n = 138) Mean FPG 77.8 ± 4.2 87.2 ± 2.0 94.7 ± 2.6 107.0 ± 6.2 <0.01 Age (y) 48.9 ± 9.0 50.6 ± 9.1 54.0 ± 8.8 54.2 ± 8.2 <0.01 Men (%) 53.1 60.9 69.1 60.8 <0.01 BMI1(kg/m2) 22.7 ± 2.8 23.2 ± 3.1 23.8 ± 2.7 24.7 ± 2.7 <0.01 SBP2(mmHg) 117 ± 15 118 ± 14 124 ± 15 127 ± 17 <0.01 DBP3(mmHg) 73 ± 9 75 ± 9 78 ± 9 80 ± 10 <0.01
Resting heart rate (beats/min) 72 ± 11 73 ± 11 74 ± 11 75 ± 13 <0.05 hs-CRP4(mg/dL) 0.91 ± 0.87 0.97 ± 1.03 1.07 ± 0.99 1.24 ± 0.98 <0.01 HDL-cholesterol (mg/dL) 54.7 ± 13.3 53.0 ± 12.9 51.0 ± 11.9 49.9 ± 11.6 <0.01 Non-HDL cholesterol (mg/dL) 134.1 ± 34.6 136.7 ± 31.9 144.5 ± 33.0 150.5 ± 38.0 <0.01 Ba-PWV(cm/s) 1303 ± 196 1328 ± 167 1384 ± 216 1469 ± 220 <0.01 Smoker5(%) 27.9 20.1 23.1 26.1 NS8 Alcohol6(%) 58.1 56.5 62.1 74.0 <0.01 Exercise7(%) 76.2 71.1 80.0 75.0 NS8
Data are shown as the mean ± standard deviation and percentage (%). P values were calculated using the ANOVA and X2
-tests.
1
body mass index;2
systolic blood pressure;3
diastolic blood pressure;4
high sensitivity C-reactive protein;5
current smokers;6alcohol ingestion≥1 time a week; 7
regular exercise≥4 hours a week;8Not significant.
Table 2 Age-adjusted correlations between brachial-ankle pulse wave velocity and various parameters (n = 697)
Pulse Wave Velocity
R p-value FPG1(mg/dL) 0.278 <0.01 BMI2(kg/m2) 0.089 <0.05 SBP3(mmHg) 0.502 <0.01 DBP4(mmHg) 0.472 <0.01 RHR5(beats/min) 0.169 <0.01 hs-CRP6(mg/dL) 0.167 <0.01 HDL-cholesterol (mg/dL) -0.146 <0.01 Non-HDL cholesterol (mg/dL) 0.111 <0.01 Current smoking 0.005 NS7 Alcohol ingestion -0.005 NS7 Exercise 0.015 NS7
Coefficients (r) and p-values are calculated using the age-adjusted Pearson’s correlation model.
1
fasting plasma glucose;2
body mass index;3
systolic blood pressure;4
diastolic blood pressure;5
resting heart rate;6
high sensitivity C-reactive protein, logarithmically transformed values;7
NS, not significant.
Figure 1 Mean values of brachial-ankle pulse wave velocity according to fasting plasma glucose quartile in non-diabetic healthy subjects. *P<0.05 vs. Q1 and Q2, § P<0.05 vs. Q1, Q2, and Q3, ¶ P<0.05 vs. Q1 Model 1; adjusted for age, sex. Model 2; adjusted for age, sex, systolic blood pressure, diastolic blood pressure, BMI, resting heart rate, Hs-CRP, HDL-cholesterol, and non HDL-cholesterol.
Discussion
In this study, FPG was positively and independently associated with the ba-PWV in non-diabetic healthy adults after correcting for confounding variables. In a recent study, resting heart rate, as an indicator of vascu-lar autonomic balance, was associated with ba-PWV [20]. Therefore, we included resting heart rate as a con-founding factor in our analyses. We also found that rest-ing heart rate was associated with the ba-PWV in non-diabetic healthy adults, and FPG was independently associated with ba-PWV after adjusting for resting heart rate and other confounding factors. In a previous study, the ba-PWV level increased from normoglycemic to dia-betic subjects. Ohnishet al. observed a higher ba-PWV in the IFG than in the normal glucose group, but the authors did not adjust for important confounding fac-tors, such as age, blood pressure, or BMI [13]. Lin Xuet al. showed that, when HbA1c was increased, the ba-PWV of normoglycemic subjects, who were grouped according to hemoglobin A1c (HbA1c), increased. How-ever, the authors mentioned that normoglycemic sub-jects grouped according to FPG did not show the same correlation [21]. Lukichet al. found that 284 Caucasian subjects had a positive correlation among FPG, HbA1c, and central artery PWV, and that increased arterial stiff-ness started at the IFG level according to comparisons of normal glucose, IFG, and diabetes [1].
Based on the difference between the mean ba-PWV values in our study, arterial stiffness may already be occurring in subjects with FPG levels within the normal range [22]. This is the first study to show that patients with high-normal FPG have increased arterial stiffness as measured by ba-PWV. There are some studies that
have shown that high normoglycemic status is a risk factor of cardiovascular disease. Twenty-two years of fol-low-up demonstrated that non-diabetic men with FPG level > 85 mg/dl had a 1.4-fold higher risk of cardiovas-cular death than did men with lower FPG [23]. In a pre-vious case-controlled study, after excluding patients with diabetes, patients with impaired glucose tolerance and impaired fasting glucose (FPG > 5.2 mmol/l) were found to be 2.7 times (95% CI 1.5- 4.8) more likely to experi-ence myocardial infarction [24]. Our results support the hypothesis that high-normal FPG level is associated with target organ damage and vascular dysfunction and extended the current knowledge by demonstrating a lin-ear, independent relationship between FPG and arterial stiffness in non-diabetic healthy adults.
We excluded six subjects with extremely low FPG level (50-65 mg/dL), even though they had no hypogly-cemic symptoms, in order to overcome interpretive diffi-culty during statistical analysis. These subjects had higher ba-PWV values compared to those of subjects with FPG level between 65-84 mg/dL. We believe that very low FPG does not protect against arterial stiffness, and the relationship between FPG and ba-PWV is a J-shaped curve over the entire range of glucose levels. We suggest that a threshold should be established to avoid arterial stiffness in patients with glucose levels that are within the normal range.
There are some limitations to the generalizability of our results. First, as this study was cross-sectional and was carried out in only one location, it was not possible to establish the exact pathophysiology linking fasting plasma glucose and ba-PWV because we did not con-sider the characteristics of diverse local environments. Second, up to five percent of subjects with IFG will appear to have diabetes according to 2-hour glucose tol-erance testing [25,26]. True-DM and IFG groups were not demarcated in the glucose tolerance test, implying that some people in the IFG group may actually have had DM. Finally, we could not explain the influence of insulin, and further study is needed to adjust for insulin resistance [27,28].
Although this study has some limitations, it is the first attempt to compare arterial stiffness between high-normal FPG (91-100 mg/dL) and low-normal FPG (65-84 mg/dL) subjects as measured by ba-PWV for the purpose of early detection and prevention of arterial stiffness.
Conclusions
We demonstrated that FPG level, even within the nor-mal range, is associated with aggravation of arterial stiff-ness in non-diabetic healthy subjects. Further research is needed to determine the optimal glycemic target value for the prevention of arterial stiffness in clinical and public health settings.
Table 3 Multiple linear regression analyses conducted to assess independent relationships between pulse wave velocity and clinical variables
Variable Pulse Wave Velocity
Regression coefficient (95% CI) P value
FPG 1.40(0.26,2.55) <0.01 Age 9.60(8.30,10.91) <0.01 Sex -21.61(-47.97,4.75) NS BMI -12.34(-17.12,-7.56) <0.01 SBP 5.24(3.54,6.96) <0.01 DBP 1.29(-1.56,4.13) NS RHR 1.66(0.59,2.72) <0.01 hs-CRP 15.42(2.01,28.83) <0.05 HDL-cholesterol -0.58(-1.59,0.43) NS Non-HDL cholesterol 0.23(-0.12,0.57) NS R2= 0.48, adjusted R2= 0.47 P < 0.001
FPG, fasting plasma glucose; SBP, systolic blood pressure; DBP, diastolic blood pressure; Sex: male, 1: female, 2; BMI, body mass index; hs-CRP, high-sensitivity C-reactive protein; NS, not significant.
Author details
1Department of Family Medicine, Gangnam Severance Hospital, Yonsei
University College of Medicine, Seoul, Korea.2Department of Family Medicine, Severance Hospital, Yonsei University College of Medicine, Seoul, Korea.
Authors’ contributions
JYS participated in the design of the study, statistical analysis, and preparation of the manuscript. DCL participated in the design of the study and preparation of the manuscript. HRL critically revised the manuscript for important intellectual content, and all authors have given their final approval.
Competing interests
The authors declare that they have no competing interests.
Received: 5 April 2011 Accepted: 15 April 2011 Published: 15 April 2011 References
1. Lukich E, Matas Z, Boaz M, Shargorodsky M: Increasing derangement of glucose homeostasis is associated with increased arterial stiffness in patients with diabetes, impaired fasting glucose and normal controls. Diabetes Metab Res Rev 2010, 26:365-70.
2. Shaw JE, Zimmet PZ, De Courten M, Dowse GK, Chitson P, Gareeboo H, Hamraj F, Fareed D, Tuomilehto J, Alberti KG: Impaired fasting glucose or impaired glucose tolerance. What best predicts future diabetes in Mauritius? Diabetes Care 1999, 22:399-402.
3. Stehouwer CD, Henry RM, Ferreira I: Arterial stiffness in diabetes and the metabolic syndrome: a pathway to cardiovascular disease. Diabetologia 2008, 51:527-539.
4. Escobedo J, Schargrodsky H, Champagne B, Silva H, Boissonnet CP, Vinueza R, Torres M, Hernandez R, Wilson E: Prevalence of the metabolic syndrome in Latin America and its association with sub-clinical carotid atherosclerosis: the CARMELA cross sectional study. Cardiovasc Diabetol 2009, 8:52.
5. Shaw JE, Zimmet PZ, Hodge AM, de Courten M, Dowse GK, Chitson P, Tuomilehto J, Alberti KG: Impaired fasting glucose: how low should it go? Diabetes Care 2000, 23:34-39.
6. Brunzell JD, Robertson RP, Lerner RL, Hazzard WR, Ensinck JW, Bierman EL, Porte D: Relationships between fasting plasma glucose levels and insulin secretion during intravenous glucose tolerance tests. J Clin Endocrinol Metab 1976, 42:222-229.
7. Charles MA, Balkau B, Vauzelle-Kervroedan F, Thibult N, Eschwege E: Revision of diagnostic criteria for diabetes. Lancet 1996, 348:1657-1658. 8. Bonora E, Kiechl S, Willeit J, Oberhollenzer F, Egger G, Bonadonna R,
Muqqeo M: Plasma glucose within the normal range is not associated with carotid atherosclerosis: prospective results in subjects with normal glucose tolerance from the Bruneck Study. Diabetes Care 1999, 22:1339-1346.
9. Tomiyama H, Hashimoto H, Hirayama Y, Yambe M, Yamada J, Koji Y, Shiina K, Yamamoto Y, Yamashina A: Synergistic acceleration of arterial stiffening in the presence of raised blood pressure and raised plasma glucose. Hypertension 2006, 47:180-188.
10. Alexander CM, Landsman PB, Teutsch SM: Diabetes mellitus, impaired fasting glucose, atherosclerotic risk factors, and prevalence of coronary heart disease. Am J Cardiol 2000, 86:897-902.
11. Lehmann ED: Clinical value of aortic pulse-wave velocity measurement. Lancet 1999, 354:528-529.
12. Munakata M, Ito N, Nunokawa T, Yoshinaga K: Utility of automated brachial ankle pulse wave velocity measurements in hypertensive patients. Am J Hypertens 2003, 16:653-657.
13. Ohnish H, Isobe T, Saitoh S, Kikuchi Y, Takagi S, Takeuchi H, Shimamoto K: Pulse wave velocity as an indicator of atherosclerosis in impaired fasting glucose. Diabetes Care 2003, 26:437-440.
14. Yamashina A, Tomiyama H, Arai T, Hirose K, Yutaka K, Hirayama Y, Yamamoto Y, Hori S: Brachial-ankle pulse wave velocity as a marker of atherosclerotic vascular damage and cardiovascular risk. Hypertens Res 2003, 26:615-622.
15. American Diabetes Association: Diagnosis and classification of diabetes mellitus. Diabetes Care 2008, 31(Suppl 1):S55-S60.
16. Cui Y, Blumenthal RS, Flaws JA, Whiteman MK, Langenberg P, Bachorik PS, Bush TL: Non-high-density lipoprotein cholesterol level as a predictor of cardiovascular disease mortality. Arch Intern Med 2001, 161:1413-1419. 17. Pischon T, Girman CJ, Sacks FM, Rifai N, Stampfer MJ, Rimm EB:
Non-high-density lipoprotein cholesterol and apolipoprotein B in the prediction of coronary heart disease in men. Circulation 2005, 112:3375-3383. 18. Lee JW, Lee HR, Shim JY, Im JA, Kim SH, Choi H, Lee DC: Viscerally obese
women with normal body weight have greater brachial-ankle pulse wave velocity than nonviscerally obese women with excessive body weight. Clin Endocrinol (Oxf) 2007, 66:572-578.
19. Yamashina A, Tomiyama H, Takeda K, Tsuda H, Arai T, Hirose K, Koji Y, Hori S, Yamamoto Y: Validity, reproducibility, and clinical significance of noninvasive brachial-ankle pulse wave velocity measurement. Hypertens Res 2002, 25:359-364.
20. Park BJ, Lee HR, Shim JY, Lee JH, Jung DH, Lee YJ: Association between resting heart rate and arterial stiffness in Korean adults. Arch Cardiovasc Dis 2010, 103:246-52.
21. Xu L, Jiang CQ, Lam TH, Yue XJ, Cheng KK, Liu B, Jin YL, Zhang WS, Thomas GN: Brachial-ankle pulse wave velocity and cardiovascular risk factors in the non-diabetic and newly diagnosed diabetic Chinese: Guangzhou Biobank Cohort Study-CVD. Diabetes Metab Res Rev 2010, 26:133-139.
22. Thomas GN, Chook P, Qiao M, Huang XS, Leong HC, Celermajer DS, Woo KS: Deleterious impact of“high normal” glucose levels and other metabolic syndrome components on arterial endothelial function and intima-media thickness in apparently healthy Chinese subjects: the CATHAY study. Arterioscler Thromb Vasc Biol 2004, 24:739-743. 23. Bjornholt JV, Erikssen G, Aaser E, Sandvik L, Nitter-Hauge S, Jervell J,
Erikssen J, Thaulow E: Fasting blood glucose: an underestimated risk factor for cardiovascular death. Results from a 22-year follow-up of healthy nondiabetic men. Diabetes care 1999, 22:45-49.
24. Gerstein HC, Pais P, Pogue J, Yusuf S: Relationship of glucose and insulin levels to the risk of myocardial infarction: a case-control study. J Am Coll Cardiol 1999, 33:612-619.
25. Rerkpattanapipat P, D’Agostino RB Jr, Link KM, Shahar E, Lima JA, Bluemke DA, Herrington DM, Hundley WG: Location of arterial stiffening differs in those with impaired fasting glucose versus diabetes: implications for left ventricular hypertrophy from the Multi-Ethnic Study of Atherosclerosis. Diabetes 2009, 58:946-953.
26. Unwin N, Shaw J, Zimmet P, Alberti KG: Impaired glucose tolerance and impaired fasting glycaemia: the current status on definition and intervention. Diabet Med 2002, 19:708-723.
27. Ho CT, Lin CC, Hsu HS, Liu CS, Davidson LE, Li TC, Li CI, Lin WY: Arterial Stiffness is Strongly Associated with Insulin Resistance in Chinese -A Population-Based Study (Taichung Community Health Study, TCHS). J Atheroscler Thromb 2011, 18:122-30.
28. Okada H, Fukui M, Tanaka M, Akabame S, Tomiyasu K, Nakano K, Yamazaki M, Hasegawa G, Oda Y, Nakamura N: Low insulin level is associated with aortic stiffness. Hypertens Res 2011, 34:336-40. doi:10.1186/1475-2840-10-30
Cite this article as: Shin et al.: Increased arterial stiffness in healthy subjects with high-normal glucose levels and in subjects with pre-diabetes. Cardiovascular Diabetology 2011 10:30.
Submit your next manuscript to BioMed Central and take full advantage of:
• Convenient online submission
• Thorough peer review
• No space constraints or color figure charges
• Immediate publication on acceptance
• Inclusion in PubMed, CAS, Scopus and Google Scholar
• Research which is freely available for redistribution
Submit your manuscript at www.biomedcentral.com/submit