Copyright © 2016 The Korean Society of Environmental Health and Toxicology
Introduction
Malaria is a representative infectious disease that manifests as a health effect of climate change in the tropical regions [1,2]. In response to the vigorous effort to eliminate malaria world-wide, overall incidence of malaria is decreasing in most of the regions except in sub-Saharan Africa [3]. However, with the global cli-mate change over the coming decades, geographic boundary of
the malaria endemicity is expected to expand from tropical and subtropical areas to the temperate areas [4]. In the tropical ar-eas, upper limit of malaria endemicity is gradually encroaching on higher altitudes in mountainous regions [5]. This latitude- wise and altitude-wise expansion is related with increasing at-mospheric temperature and rainfall, which facilitates the surviv-al of the vector mosquitoes [2,6]. However, in some tropicsurviv-al ar-eas, incidence of malaria is expected to decrease in accordance
Time trend of malaria in relation to climate
variability in Papua New Guinea
Jae-Won Park
1, Hae-Kwan Cheong
2, Yasushi Honda
3, Mina Ha
4, Ho Kim
5, Joel Kolam
6,
Kasis Inape
7, Ivo Mueller
81Department of Microbiology, Graduate School of Medicine, Gachon University of Medicine and Science, Incheon; 2Department
of Social and Preventive Medicine, Sungkyunkwan University School of Medicine, Suwon, Korea; 3Graduate School of
Comprehensive Human Sciences, University of Tsukuba, Ibaraki, Japan; 4Department of Preventive Medicine, Dankook
University College of Medicine, Cheonan; 5Department of Biostatistics and Epidemiology, Graduate School of Public Health,
and Institute of Public Health and Environment, Seoul National University, Seoul, Korea; 6National Department of Health,
Port Moresby; 7National Weather Service, Port Moresby; 8Papua New Guinea Institute of Medical Research, Goroka, Papua
New Guinea
• Original Article
http://dx.doi.org/10.5620/eht.e2016003eISSN: 2233-6567
Objectives This study was conducted to describe the regional malaria incidence in rela-tion to the geographic and climatic condirela-tions and describe the effect of altitude on the expansion of malaria over the last decade in Papua New Guinea.
Methods Malaria incidence was estimated in five provinces from 1996 to 2008 using na-tional health surveillance data. Time trend of malaria incidence was compared with rain-fall and minimum/maximum temperature. In the Eastern Highland Province, time trend of malaria incidence over the study period was stratified by altitude. Spatio-temporal pat-tern of malaria was analyzed.
Results Nationwide, malaria incidence was stationary. Regionally, the incidence increased markedly in the highland region (292.0/100000/yr, p =0.021), and remained stationary in the other regions. Seasonality of the malaria incidence was related with rainfall. Decreas-ing incidence of malaria was associated with decreasDecreas-ing rainfall in the southern coastal region, whereas it was not evident in the northern coastal region. In the Eastern Highland Province, malaria incidence increased in areas below 1700 m, with the rate of increase be-ing steeper at higher altitudes.
Conclusions Increasing trend of malaria incidence was prominent in the highland region of Papua New Guinea, while long-term trend was dependent upon baseline level of rain-fall in coastal regions.
Keywords Climate change, Malaria, Asia-Pacific, Tropical area, Highland, Descriptive epi-demiology, Vector-borne diseases, Time trend
Correspondence: Hae-Kwan Cheong 2066 Seobu-ro, Jangan-gu, Suwon 16419, Korea Tel: +82-31-299-6300 Fax:+82-31-299-6299 E-mail: [email protected] Received: October 15, 2015 Accepted: February 17, 2016 Published: February 25, 2016
with decreased rainfall, which represents reverse direction of fa-vorable health effects of climate change, according to the Inter-governmental Panel on Climate Change [6].
Most of the malaria studies in relation to the climate change have been reported from African and South American countries [7,8], and there are few from tropical Asian and Pacific coun-tries [9]. Tropical areas of the Asia-Pacific are strategically im-portant in malaria control because of its heavy population bur-den of 1.6 billion people, comprising 60% of population living in the tropical areas, frequent traffic with developed countries in temperate region, and rapid environmental changes with accel-erated economic development [10].
Papua New Guinea (PNG) is a country with one of the high-est prevalence of malaria in the Asia-Pacific [3] and malaria takes the highest burden of disease in this country [11,12]. World Health Organization reports that there are 1.3 million of cases with 3100 deaths per year in PNG as of 2013 [13]. Among the population, 7 out of 7.4 million people are living in the high transmission area, with an incidence more than 1 case per 1000 population per year. More than 80% of the cases are from
Plas-modium falcifarum [13].
Because of its diversity in geography, land use, climate, and ethnicity, as well as high vulnerability with low adaptive capaci-ty, PNG provides a window to assess the impact of climate vari-ability on the malaria incidence. Whereas there are numerous in depth descriptions of the epidemiology of malaria in PNG [14-16], to-date, study on the concurrent time trend in malaria inci-dence and changing patterns of rainfall and temperatures have not been reported. This study assessed the trends of malaria in-cidence over the last decade in PNG, with a particular focus on the highland region, taking both long-term climate variability and geographic properties into account.
Materials and Methods
Basic Characteristics of Papua New Guinea
PNG is a tropical country that lies beneath the western equa-torial Pacific, comprised of the eastern half of New Guinea Is-land and adjacent isIs-lands. Geographically, PNG is comprised of four distinct regions; southern coastal, highland, northern
Figure 1. Administrative map of Papua New Guinea. It is divided into four main regions, southern coastal, highland, northern coastal, and island region. Dots represent the main cities in which weather data was collected.
coastal, and island region (Figure 1). PNG is remarkable in its diversity in terms of geography, ecosystem, and ethnicity [17,18]. It is vulnerable to the health impacts of climate change, because of its geographic location, poor health sector infrastruc-ture, and strong dependence on a traditional way of life with a rapidly increasing population.
The total population of PNG is 6 million [19] with a land area of 462840 km2. Most of the land area is covered by tropical rain
forest along the mountains that forms the vertebra of New Guinea Island. Mountain ranges reach 4500 m in altitude with permanent settlements found up to an altitude of 2200 m to 2400 m. The climate varies markedly across the country. The temperature in the coastal areas remains fairly constant year-round, dropping as altitude rises in the highland region. In most areas of PNG, the amount of rainfall is very heavy, reaching up to 4000 mm annually in the southwestern and northern coastal regions. However, in the southern coastal region, the area sur-rounding the National Capital District it is drier and is classified as savannah. Two prominent seasons exist throughout PNG, i.e., dry and wet seasons, but the extent of seasonality varies greatly with seasonality greatest in part of the Western Province and National Capital District.
We selected five areas for the study area; two (Daru, southern part of Western Province and Port Moresby, National Capital District) from southern coastal, one (Goroka, Eastern Highland Province) from highland, two (Madang, Madang Province; and Wewak, East Sepik Province) from northern coastal region. Among four geographic regions, island region was not included, because weather data was not available for the provinces in the island region. We took the diversity in climate and geography as well as socioeconomic and sociocultural aspect into account. According to the availability of the data, study period was be-tween 1996 and 2008 over 13 years.
Status of Malaria in Papua New Guinea
Annual and monthly malaria data were obtained from the Na-tional Health Information System (NHIS) of PNG [18]. NHIS is a computerized national database based on the monthly re-port of morbidity (both inpatients and outpatients) from na-tionwide health facilities including hospitals, health centers, sub-health centers, and aid posts. Monthly reports from each health facility are collected at provincial health information cen-ters, where data are added to the computerized database that is electronically reported to the National Department of Health of PNG to generate national and regional statistics. List of diseases includes major infectious diseases, health indices related to ma-ternal and children’s health, and injuries.
The number of malaria patients is collected as a routine
monthly report from all the facilities via district to provincial health authorities. Malaria data include number of inpatient and outpatient cases based on clinical findings, rapid diagnostic test findings, laboratory findings, and number of deaths. Age and gender of the patients are also reported in a frequency distribu-tion in each health facility. Most of the country’s health facilities are staffed by community health practitioners and nurses and have no facilities for parasitological diagnosis of malaria. As a consequence, between 2000 and 2009, only 5% to 8% of sus-pected malaria cases in PNG were assessed either by microsco-py or rapid diagnostic test with an average positivity of 37% (range, 33% to 51%) [3]. The data in the NHIS therefore repre-sents the total burden of malaria cases (probable and con-firmed) treated by the national health system. While the diag-nostic accuracy of the NHIS is thus limited, the consistency of the NHIS as a whole was nevertheless acceptable for surveil-lance purposes [18]. Population data for each province and dis-trict based on National Demographic and Health Survey from 1996 to 2008 was also available from NHIS [18]. We calculated the malaria incidence using data of malaria cases and the num-ber of population in the corresponding region and period.
Climate and Geographic Data
Data for temperature and rainfall were obtained directly from the National Weather Service, which cover long-term periods including monthly maximum and minimum temperature, and rainfall from 14 weather posts nationwide. Most of the weather posts are located in coastal and island regions, with only one weather post located in the highland region (Goroka, Eastern Highland Province). Furthermore, the highland post had many months of missing data, especially for rainfall (Figure S1).
A nationwide district map was available in electronic form from the National Mapping Bureau. Geographical data regard-ing the altitude of health facilities were collected from the Na-tional Mapping Bureau and Provincial Health Information Sys-tem of the Eastern Highland Province. For the Eastern Highland Province, total area map, administrative units, facilities, and top-ographic data were available in electronic form. Topography of the Eastern Highland Province and the altitude map of each health facility were generated by ArcGIS version 9.3 (Environ-mental System Research Institute, Redlands, CA, USA).
Statistical Analysis
We integrated malaria incidence and climate index in the cor-responding region and period to ascertain the effect of climate on malaria occurrence in PNG. We also integrated the Eastern Highland Province topography and altitude map to trace the ex-pansion of malaria occurrence in accordance with long-term
cli-mate trend in PNG. The time trends of malaria occurrence were tested using linear regression analysis. All analyses were per-formed using SPSS version 17.0 (SPSS Inc., Chicago, IL, USA)
with a statistical significance level of 0.05.
Results
Time Trend of Malaria Incidence
During the observation period from 1997 to 2008, a small, sta-tistically non-significant decrease in national wide malaria inci-dence was observed (-190.8 cases/100000/yr, p=0.200) (Fig-ure 2). When analyzed by region, there was a significant de-crease in incidence was observed for the southern coastal region (-921.3 cases/100000/yr, p=0.0024), whereas in highland re-gion there was a significant increase (292.0 cases/100000/yr, p=0.0204). Malaria incidence remained steady in the other re-gions (p<0.05).
Both in the coastal and highland regions, malaria occurrence displayed a strong seasonality related to rainfall, however, the pattern was different. In the Eastern Highland Province, malaria occurrence usually peaked during the late wet season or the ear-ly dry season, whereas in the northern coastal region, the peak occurred during the early wet season. In the southern coastal re-gion, malaria incidence was stationary during the wet season
60000 50000 40000 30000 20000 10000 0 Incidenc e (100000/yr) Year 1997 1998 1999 2000 2001 2002 2003 2004 2005 2006 2007 2008 Highland Nationwide Northern coastal Southern coastal Island
Figure 2. Time trend of annual malaria incidence of four geographic regions in Papua New Guinea from 1996-2008. Average increase of malaria inci-dence in each region was; -921.3/100000/yr (p=0.002) in the southern coastal region, 292.0/100000/yr (p=0.021) in the highland region, -52.4/ 100000/yr (p=0.727) in the northern coastal region, -659.2/100000/yr (p=0.154) in the island region, and -190.8/100000/yr (p=0.200) nation-wide. Increase of incidence was significant only in highland region and there was a significant decrease in island region.
Figure 3. Seasonal trend of number of malaria cases in (A) Western Province, southern coastal region, (B) National Capital District, southern coastal region, (C) Eastern Highland Province, highland region, (D) East Sepik Province, northern coastal region, and (E) Madang Province, northern coastal region, during 1996-2008. X-axis: month, Y-axis: left, mean malaria incidence per 100000/mo (outpatients), right, rainfall (mm/mo).
Malaria incidence 3500 3000 2500 2000 1500 1000 500 0 3500 3000 2500 2000 1500 1000 500 0 3500 3000 2500 2000 1500 1000 500 0 3500 3000 2500 2000 1500 1000 500 0 3500 3000 2500 2000 1500 1000 500 0 400 350 300 250 200 150 100 50 0 400 350 300 250 200 150 100 50 0 450 400 350 300 250 200 150 100 50 0 400 350 300 250 200 150 100 50 0 400 350 300 250 200 150 100 50 0 Incidence (100000/mo)
Incidence (100000/mo) Incidence (100000/mo)
Incidence (100000/mo) Incidence (100000/mo) Rainfall (mm/mo)
Rainfall (mm/mo) Rainfall (mm/mo)
Rainfall (mm/mo) Rainfall (mm/mo)
Jan Feb Mar Apr May Jun Jul Aug Sep Oct Nov Dec
Jan Feb Mar Apr May Jun Jul Aug Sep Oct Nov Dec Jan Feb Mar Apr May Jun Jul Aug Sep Oct Nov Dec
Jan Feb Mar Apr May Jun Jul Aug Sep Oct Nov Dec Jan Feb Mar Apr May Jun Jul Aug Sep Oct Nov Dec
Rainfall
A B C
and reached the lowest point in the late dry season (Figure 3).
Climate and Malaria Incidence
We compared the malaria incidence changes between coastal and highland regions according to the climatic factors including rainfall and temperature. From 1996 to 2008, rainfall decreased in the Western Province, East Sepik Province, and the Madang
Province, while it increased in the National Capital District and the Eastern Highland Province, one of highland regions. Among coastal regions, malaria incidence displayed a decreasing ten-dency in southern coastal regions like the Western Province and the National Capital District. In northern coastal regions, the malaria incidence was slightly decreased in the East Sepik Prov-ince, whereas it showed the opposite pattern in the Madang
Table 1. Time trend of malaria incidence and climatic factors in five areas in Papua New Guinea, 1996-2008
Province (City) Region
Annual average (1996-2008) Average increase/yr (%) Incidence (/100000/yr) Rainfall (mm/yr) T min (°C) T max (°C) Incidence (/100000/yr) Rainfall (mm/yr) T min (°C) T max (°C) Western Province (Daru) S outhern
coastal
37646 1856 24.2 30.1 -3.05 -1.36 0.129 0.023 National Capital District (Port Moresby) S outhern
coastal
24126 1240 23.6 31.3 -6.05 0.43 0.130 -0.054 Eastern Highland Province (Goroka) Highland 9319 1828 15.5 26.4 4.75 3.15 0.300 0.148 East Sepik Province (Wewak) N orthern
coastal
34313 2269 24.2 30.9 -0.48 -1.69 0.072 0.130 Madang Province (Madang) N orthern
coastal
29875 3394 24.0 30.9 0.51 -0.34 0.323 0.107 Malaria incidence data came from each province, and rainfall and temperature data were obtained from the weather post located in cities in the parentheses. T min, monthly average of daily minimum temperature; T max, monthly average of daily maximum temperature.
50000 40000 30000 20000 10000 0 50000 40000 30000 20000 10000 0 50000 40000 30000 20000 10000 0 50000 40000 30000 20000 10000 0 50000 40000 30000 20000 10000 0 3000 2500 2000 1500 1000 500 0 4500 4000 3500 3000 2500 2000 1500 1000 500 0 4500 4000 3500 3000 2500 2000 1500 1000 500 0 3000 2500 2000 1500 1000 500 0 3000 2500 2000 1500 1000 500 0 Incidence (100000/yr)
Incidence (100000/yr) Incidence (100000/yr)
Incidence (100000/yr) Incidence (100000/yr) Rainfall (mm) Rainfall (mm) Rainfall (mm) Rainfall (mm) Rainfall (mm) 1996 1996 1996 1996 1996 1997 1997 1997 1997 1997 1998 1998 1998 1998 1998 1999 1999 1999 1999 1999 2000 2000 2000 2000 2000 2001 2001 2001 2001 2001 2002 2002 2002 2002 2002 2003 2003 2003 2003 2003 2004 2004 2004 2004 2004 2005 2005 2005 2005 2005 2006 2006 2006 2006 2006 2007 2007 2007 2007 2007 2008 2008 2008 2008 2008 § §§§ § § § Malaria incidence Rainfall
Data for climate is missing
Figure 4. Changes in annual malaria incidence and rainfall (A) Western Province, southern coastal region, (B) National Capital District, southern coastal re-gion, (C) Eastern Highland Province, highland rere-gion, (D) East Sepik Province, northern coastal rere-gion, and (E) Madang Province, northern coastal rere-gion, dur-ing 1996-2008. X-axis: year, Y-axis: left, annual malaria incidence per 100000/yr (outpatients), right: rainfall (mm/mo).
A B C
Province. In the Eastern Highland Province, malaria incidence increased sharply during this period (Table 1 and Figure 4). Monthly minimum temperature increased in all areas and monthly maximum temperature also increased in the most ar-eas, except the National Capital District. Temperature rise was most prominent in the highland region. In the Eastern Highland Province, increasing malaria incidence was accompanied by in-creasing monthly minimum and maximum temperatures. How-ever, changing patterns of malaria incidence in coastal regions were not consistent with the pattern of temperature change (Ta-ble 1 and Figure 5).
Malaria in the Highland Region
In the Eastern Highland Province, malaria incidence was higher at lower altitudes and decreased with increasing altitude. Slope of the time trend of malaria incidence increased as the altitude increas-es from 465.2/100000/yr (p=0.425) in 1300 m to 875.7/100000/ yr (p=0.002) in 1600 m. However, in areas above 1700 m, the inci-dence did not increase, indicating the altitude border of malaria in tropical highland region of PNG (Figure 6).
25000 20000 15000 10000 5000 0 Incidenc e (100000/yr) Year 1996 1997 1998 1999 2000 2001 2002 2003 2004 2005 2006 2007 2008 1500-1699 m Below 1500 m 1700 m or higher
Figure 6. Time trend of malaria incidence of each health facility in the Eastern Highland Province of highland region, Papua New Guinea, during 1996-2008 by altitude. Estimated slope for each altitude range is; 505.3/100000/yr (p=0.1042) for below 1500 m, 853.7/100000/yr (p=0.0008) for between 1500 m-1699 m, -332.2/100000/yr (p=0.2894) for higher than 1700 m.
Figure 5. Changes in annual malaria incidence and monthly average of daily maximum (T max) and minimum (T max) temperature (A) Western Province, southern coastal region, (B) National Capital District, southern coastal region, (C) Eastern Highland Province, highland region, (D) East Sepik Province, north-ern coastal region, and (E) Madang Province, northnorth-ern coastal region, during 1996-2008. X-axis: year, Y-axis: left, annual malaria incidence per 100000/yr (outpatients), right, temperature (°C).
50000 40000 30000 20000 10000 0 50000 40000 30000 20000 10000 0 50000 40000 30000 20000 10000 0 35 30 25 20 35 30 25 20 15 35 30 25 20
Incidence (100000/yr) Temperature (˚C) Incidence (100000/yr) Temperature (˚C) Incidence (100000/yr) Temperature (˚C)
1996 1997 1998 1999 2000 2001 2002 2003 2004 2005 2006 2007 2008 1996 1997 1998 1999 2000 2001 2002 2003 2004 2005 2006 2007 2008 1996 1997 1998 1999 2000 2001 2002 2003 2004 2005 2006 2007 2008 § § § Malaria incidence T max T min
Data for climate is missing
50000 40000 30000 20000 10000 0 50000 40000 30000 20000 10000 0 35 30 25 20 35 30 25 20 Incidence (100000/yr) Temperature (˚C) Incidence (100000/yr) Temperature (˚C)
1996 1997 1998 1999 2000 2001 2002 2003 2004 2005 2006 2007 2008 1996 1997 1998 1999 2000 2001 2002 2003 2004 2005 2006 2007 2008
§§§
A B C
In 3-year incidence, only one health facility at altitudes over 1600 m with more than 8000 patients existed from 1996 to 1998 and from 1999 to 2001. The number of such facilities grew to three from 2002 to 2004 and four from 2005 to 2007 (Figure S2). In 5-year incidence, the number of health facilities with the aforementioned criteria increased from three from 1996 to 2000 to five from 2001 to 2005 (data not shown).
Discussion
It has been generally believed that climate change would cause favorable effects as well as adverse effects on malaria [6]. Our study demonstrates that in the malaria endemic areas of the tropical regions (i.e., the coastal regions), temperature changes may have little influence on malaria occurrence, whereas de-creased rainfall would reduce habitats of the vector mosquitoes resulting in subsequent decrease of the incidence of malaria. On the contrary, in the border areas of malaria endemic regions, i.e., the higher altitude area within malaria endemic regions and higher latitude regions, temperature rise along with increased rainfall may facilitate proliferation of the vector mosquitoes, which results in increasing malaria incidence.
In the Eastern Highland Province of PNG, the decreasing trend of malaria incidence was prominent in parallel with in-creasing temperature. Increased rainfall might have expanded habitats of the vector mosquitoes, leading to increased malaria cases in the Eastern Highland Province. Malaria incidence reached its highest peak during the late wet season or the early dry season in this province. To transmit malaria, Plasmodium should undergo the sporogonic cycle in the vector mosquito and the short incubation period in a newly infected human, which takes 3 to 4 weeks in total. Therefore, malaria patients comprising the peak portions may be infected during the mid-wet season. This implies that sufficient rainfall in the mid-wet season is a prerequisite for the multiplication of the vector mosquitoes in the Eastern Highland Province. The present results strongly suggest that increased rainfall in the highland region is an im-portant determinant of the increased malaria cases in this area. Temperature rise was another contributing factor to increased malaria cases in the Eastern Highland Province. Malaria was not prevalent in the Eastern Highland Province until the 1970s since temperature was too cold to transmit the disease. Since then, the temperature has risen steadily in the highland region, providing a favorable environment for malaria transmission. In the Eastern Highland Province, the altitude border of malaria prevalence has been increasing with the steady rise in tempera-ture and rainfall. As shown in Figure 6, increased malaria inci-dence was most remarkable at the altitude of 1600 m, while the
incidence did not increase at altitude above 1700 m. This im-plies that a temperature rise caused by climate change has creat-ed a more favorable environment for the vector mosquitoes up to an altitude of 1600 m. It is possible that malaria will become more prevalent, even at altitudes of 1700 m or higher if tempera-ture rises further.
Decreasing trend of malaria incidence in relation with changes in climate was not consistent in the coastal regions. Rainfall de-creased in most of coastal regions; however, dede-creased rainfall and malaria incidence was differently associated according to baseline level of rainfall of each area. Decreasing incidence of malaria in parallel with decreasing rainfall was most prominent in the low rainy area like the Western Province where annual rainfall is less than 2000 mm. In this area, decreased malaria in-cidence was accompanied by decreased rainfall. In an intermedi-ate rainy area such as East Sepik Province, where annual rainfall exceeds 2000 mm, incidence of malaria decreased to a lesser ex-tent than the low rainy area in spite of higher decrease of rainfall compared to the less rainy southern coastal area, which is incon-sistent with the changing pattern of rainfall. It implies that in the low and intermediate rainy areas, rainfall might be a more im-portant decisive factor of malaria incidence than temperature, since the minimum and maximum temperatures rose in all the study areas regardless of the change of malaria incidence during the study period. In the heavy rainy areas like the Madang Prov-ince, where annual rainfall exceeds 3000 mm, the change of rainfall had little influence on malaria incidence in this area, since the baseline level of rainfall was abundant. We assume that the effect of decreased rainfall on malaria occurrence depends upon the baseline level of rainfall of the areas.
Malaria is one of the indicator vector-borne diseases reflecting climate change, since the proliferation of the major vector, Anopheles mosquitoes, is greatly affected by the natural environ-ment including the climatic factors. Of the climate factors, rain-fall, temperature, and humidity have an effect on the prolifera-tion of Anopheles mosquitoes. Development of Anopheles is largely inhibited at a temperature below 10˚C to 16˚C [20], which is the cause of the unstable malaria in the temperate re-gions. The longevity of the adult Anopheles is also sharply re-duced when the mean temperature is above 35˚C or the relative humidity is less than 50% [21]. At temperatures lower than 35˚C, progressively higher temperature is associated with pro-gressively shorter gonotrophic and aquatic cycles become, con-tributing the proliferation of the vector mosquitoes in a shorter time. Temperature rise may have stronger effects in high altitude areas within a malaria endemic region or in high latitude areas where activities of vector mosquitoes are restricted by cold tem-peratures, than in tropical regions where the temperature is
al-ready high enough to support malaria transmission [4,21]. Rainfall also affects the population of vector mosquitoes. In-creased rainfall provides the vector mosquitoes with a favorable environment for their proliferation, especially in dry areas; how-ever, too much rainfall can wash the larvae out of the flooded rivers reducing the population of vector mosquitoes [22].
Concerning the estimation of malaria incidence based on NHIS dataset of PNG, the validity of the data can be ques-tioned. Diagnosis of malaria is mostly based on the clinical find-ings and there are few cases based on the laboratory confirma-tion or rapid diagnostic tests. False positive diagnosis, i.e., other febrile illnesses and other microbial diseases such as dengue fe-ver and Japanese encephalitis, as well as underdiagnosis, cannot be excluded. In the highland region of PNG, where malaria is still rare, it is conceivable that the diagnostic validity of health personnel may be different from hyperendemic coastal regions. However, we found the data were quite consistent at the provin-cial or national level over decades [23]. Since the national health statistics are also based on NHIS, the dataset proved to be the acceptable for the evaluation of long-term trend of malaria in PNG. Malaria incidence is also affected by many factors includ-ing socioeconomic changes, development, migration, and ma-laria control program [4,8,9]. We could not get detailed infor-mation about the intervention program in each province. How-ever, basic health indices in this country did not show a substan-tial difference over decades and indices related with funding and other eradication activities for malaria has been stable over the study period [3].
In conclusion, increasing trend of malaria was prominent in highland region of PNG, which might be ascribed to increased temperature and rainfall. The altitude border of malaria has been elevated in the Eastern Highland Province as climate change has progressed. Decreasing incidence of malaria was shown in the low and the intermediate rainy coastal areas, whereas it was not distinct in the heavy rainy coastal areas yet. However, if rainfall decreases steadily due to further climate change, malaria occurrence may shift to the decreasing phase, even in heavy rainfall areas. Considering the relative scarcity of reports on malaria epidemiology in tropical Asia, this study pro-vides changes in the trend of malaria incidence in relation to changes in the climate in this region. Also, it provides an evi-dence on the mainstreaming the climate change on the strength-ening the surveillance system in the vulnerable countries.
Acknowledgements
This study was supported by WHO/ WPRO Project for the Sup-port of National Action Plan for the Climate Change and Health
(WPDHP 1002490, APW 2009/42416-0 and 2010/60502-0).
Conflict of Interest
The authors have no conflicts of interest associated with mate-rial presented in this paper.
ORCID
Jae-Won Park http://orcid.org/0000-0002-5959-7628 Hae-Kwan Cheong http://orcid.org/0000-0003-2758-9399 Yasushi Honda http://orcid.org/0000-0003-2248-1629 Mina Ha http://orcid.org/000-0003-1011-9446 Ho Kim http://orcid.org/0000-0001-7472-3752 Ivo Mueller http://orcid.org/0000-0001-6554-6889
References
1. Githeko AK, Lindsay SW, Confalonieri UE, Patz JA. Climate change and vector-borne diseases: a regional analysis. Bull World Health Organ 2000;78(9):1136-1147.
2. McMichael AJ, Woodruff RE, Hales S. Climate change and human health: present and future risks. Lancet 2006;367(9513):859-869. 3. World Health Organization. World malaria report 2012 [cited
2016 Feb 17]. Available from: http://www.who.int/malaria/publi-cations/world_malaria_report_2012/en/.
4. Martens WJ, Niessen LW, Rotmans J, Jetten TH, McMichael AJ. Potential impact of global climate change on malaria risk. Environ Health Perspect 1995;103(5):458-464.
5. Hashizume M, Terao T, Minakawa N. The Indian Ocean Dipole and malaria risk in the highlands of western Kenya. Proc Natl Acad Sci U S A 2009;106(6):1857-1862.
6. Smith KR, Woodward A, Campbell-Lendrum D, Chadee DD, Honda Y, Liu Q, et al. Human health: impacts, adaptation, and co-benefits. In: Field CB, Barros VR, Dokken DJ, Mach KJ, Mastran-drea MD, Bilir TE, editors. Climate change 2014: impacts, adapta-tion, and vulnerability-Working Group II contribution to the fifth assessment report of the Intergovernmental Panel on Climate Change. New York: Cambridge University Press; 2014, p. 709-754. 7. Tanser FC, Sharp B, le Sueur D. Potential effect of climate change
on malaria transmission in Africa. Lancet 2003;362(9398):1792-1798.
8. Fouque F, Gaborit P, Carinci R, Issaly J, Girod R. Annual variations in the number of malaria cases related to two different patterns of Anopheles darlingi transmission potential in the Maroni area of French Guiana. Malar J 2010;9:80.
9. Haque U, Hashizume M, Glass GE, Dewan AM, Overgaard HJ, Yamamoto T. The role of climate variability in the spread of malaria in Bangladeshi highlands. PLoS One 2010;5(12):e14341. 10. Watson RT, Zinyowera MC, Moss RH. The regional impacts of
cli-mate change: an assessment of vulnerability; 1997 [cited 2016 Feb 17]. Available from:
http://www.ipcc.ch/ipccreports/sres/region-al/index.php?idp=0.
11. Sicuri E, Davy C, Marinelli M, Oa O, Ome M, Siba P, et al. The economic cost to households of childhood malaria in Papua New Guinea: a focus on intra-country variation. Health Policy Plan 2012;27(4):339-347.
12. Cattani JA, Tulloch JL, Vrbova H, Jolley D, Gibson FD, Moir JS, et al. The epidemiology of malaria in a population surrounding Madang, Papua New Guinea. Am J Trop Med Hyg 1986;35(1):3-15.
13. World Health Organization. World malaria report 2015 [cited 2015 Oct 1]. Available from: http://www.who.int/malaria/publi-cations/world-malaria-report-2015/en/.
14. Mueller I, Bjorge S, Poigeno G, Kundi J, Tandrapah T, Riley ID, et al. The epidemiology of malaria in the Papua New Guinea high-lands: 2. Eastern Highlands Province. P N G Med J 2003;46(3-4):166-179.
15. Betuela I, Maraga S, Hetzel MW, Tandrapah T, Sie A, Yala S, et al. Epidemiology of malaria in the Papua New Guinean highlands. Trop Med Int Health 2012;17(10):1181-1191.
16. Müller I, Bockarie M, Alpers M, Smith T. The epidemiology of ma-laria in Papua New Guinea. Trends Parasitol 2003;19(6):253-259. 17. World Bank. Strategic directions for human development in Papua
New Guinea; 2007 [cited 2015 Oct 1]. Available from:
http://docu- ments.worldbank.org/curated/en/2007/01/8348386/strategic-di-rections-human-development-papua-new-guinea.
18. National Statistical Office. Papua New Guinea demographic and health survey 2006 [cited 2015 Oct 1]. Available from: http://pht-pacific.org/sites/default/files/surveys_dev_reports/90/files/ PNG_DemographicHealthSurvey-2006_2009-07_GoPNG.pdf. 19. Cibulskis RE, Hiawalyer G. Information systems for health sector
monitoring in Papua New Guinea. Bull World Health Organ 2002;80(9):752-758.
20. Russell PF, West LS, Manwell RD, MacDonald G. Mosquito bio-nomics. In: Russell PF, editor. Practical malariology. 2nd ed. Lon-don: Oxford University Press; 1963, p. 201-248.
21. Service MW, Townson H. The anopheles vector. In: Warrell DA, Gilles HM, editors. Essential malariology. 4th ed. London: Arnold; 2002, p. 59-84.
22. Galardo AK, Zimmerman RH, Lounibos LP, Young LJ, Galardo CD, Arruda M, et al. Seasonal abundance of anopheline mosqui-toes and their association with rainfall and malaria along the Mata-pí River, Amapi, Brazil. Med Vet Entomol 2009;23(4):335-349. 23. Ashwell HE, Barclay L. Problems measuring community health
status at a local level: Papua New Guinea’s health information sys-tem. Rural Remote Health 2010;10(4):1539.
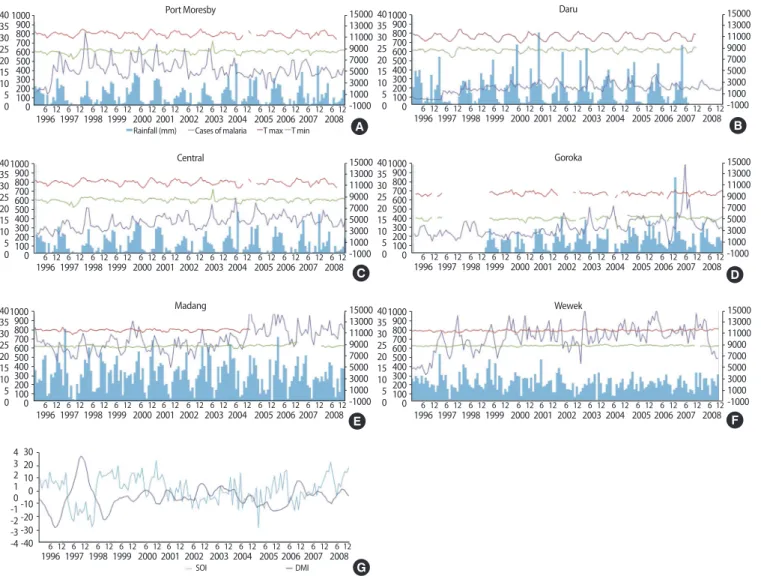
Figure S1. Time trend of monthly malaria cases and climate factors and oceanic surface temperature variations according to regions (A) Port Moresby, (B) Daru, (C) Central, (D) Goroka, (E) Madang, and (F) Wewak. Oceanic surface temperature were presented by southern oscillation index (SOI) and dipole mode index (DMI) in (G). T min, monthly average of daily minimum temperature; T max, monthly average of daily maximum temperature.
1000 900 800 700 600 500 400 300 200 100 0 15000 13000 11000 9000 7000 5000 3000 1000 -1000 40 35 30 25 20 15 10 5 0 19966121997612 612 612 612 612 612 612 612 612 612 612 612 Madang 1998 1999 2000 2001 2002 2003 2004 2005 2006 2007 2008 E 1000 900 800 700 600 500 400 300 200 100 0 15000 13000 11000 9000 7000 5000 3000 1000 -1000 40 35 30 25 20 15 10 5 0 19966121997612 612 612 612 612 612 612 612 612 612 612 612 Wewek 1998 1999 2000 2001 2002 2003 2004 2005 2006 2007 2008 F 30 20 10 0 -10 -20 -30 -40 4 3 2 1 0 -1 -2 -3 -4 19966121997 1998 1999 2000 2001612 612 612 612 612 612 612 612 612 612 612 612 SOI DMI 2002 2003 2004 2005 2006 2007 2008 G A 1000 900 800 700 600 500 400 300 200 100 0 15000 13000 11000 9000 7000 5000 3000 1000 -1000 40 35 30 25 20 15 10 5 0 19966121997612 612 612 612 612 612 612 612 612 612 612 612 Port Moresby 1998 1999 2000 2001
Rainfall (mm) Cases of malaria T max T min
2002 2003 2004 2005 2006 2007 2008 B 1000 900 800 700 600 500 400 300 200 100 0 15000 13000 11000 9000 7000 5000 3000 1000 -1000 40 35 30 25 20 15 10 5 0 19966121997612 612 612 612 612 612 612 612 612 612 612 612 Daru 1998 1999 2000 2001 2002 2003 2004 2005 2006 2007 2008 1000 900 800 700 600 500 400 300 200 100 0 15000 13000 11000 9000 7000 5000 3000 1000 -1000 40 35 30 25 20 15 10 5 0 19966121997612 612 612 612 612 612 612 612 612 612 612 612 Goroka 1998 1999 2000 2001 2002 2003 2004 2005 2006 2007 2008 D C 1000 900 800 700 600 500 400 300 200 100 0 15000 13000 11000 9000 7000 5000 3000 1000 -1000 40 35 30 25 20 15 10 5 0 19966121997612 612 612 612 612 612 612 612 612 612 612 612 Central 1998 1999 2000 2001 2002 2003 2004 2005 2006 2007 2008
Figure S2. Malaria incidence of each health facility in the Eastern Highland Province of highland region during 1996-2007. In 3-year incidence, the number of health facilities at the altitude over 1600 m with more than 8000 patients was only one during 1996-1998 (A) and 1999-2001 (B), respectively, and in-creased to three during 2002-2004 (C) and up to four during 2005-2007 (D).
A
C
B