IEIE Transactions on Smart Processing and Computing
Accurate Heartbeat Frequency Extraction Method
using UWB Impulse Radar
Hui-Sup Cho* and Young-Jin Park
Intelligent Devices and Systems Research Group, DGIST / Daegu, Korea * Corresponding Author: Hui-Sup Cho, [email protected]
Received May 29, 2017; Accepted July 7, 2017; Published August 30, 2017 * Regular Paper
* Extended from a Conference: Preliminary results of this paper were presented at the ITC-CSCC 2017. This paper has been accepted by the editorial board through the regular review process that confirms the original contribution.
Abstract: Non-invasive and non-restrictive methods for measuring the physiological functions of the human body are useful for health care, security, and surveillance. In this paper, a new method that extracts human heartbeat information by utilizing ultra-wideband (UWB) impulse radar is proposed. The amplitude spectra of received radar pulses reflected from the human body are accumulated at specific time intervals, and chirp z-transform (CZT) is used to extract the heartbeat frequency from the amplitude spectra. The heartbeat frequency can be extracted with high-frequency resolution in the high-frequency band of the heartbeat of interest using CZT. Experimental results to verify the performance of the proposed method show that a highly accurate extraction of the heartbeat frequency is possible using this method.
Keywords: UWB, Impulse radar, Fourier transform, Chirp z-transform, Heartbeat
1. Introduction
The demand for non-invasive and contactless measurement of physiological functions is increasing constantly, and such technology is useful not only for monitoring the conditions of hospitalized patients, but also for the prevention and early diagnosis of disease in healthy people, without adding constraints on everyday activities [1]. The non-invasive measurement of biological signals, in comparison to the acquisition of biometric information using conventional methods, has important implications, as this approach improves the quality of life of the subject.
Several methods for contactless measurement of biological signals representing physiological functions exist, utilizing visible images [2, 3] or the transmission and reflection characteristics of electromagnetic waves. Furthermore, radar technology originally developed to detect faraway targets in aviation and military applications has been examined as a means of acquiring biological information, such as the human heartbeat and respiration, within a short distance from the body [4, 5]. For physiological function monitoring, impulse radar and continuous wave (CW) Doppler radar, which are classified
according to the shapes of the inherent electromagnetic waves, are generally used. As differences exist between these methods in terms of power consumption, range, and spatial resolution, they are applied to different areas. With CW Doppler radar applications, the achievement of heart rate measurement with a relatively low error rate was reported in which stepped-frequency continuous wave (SFCW) radar was utilized to acquire both range information and Doppler information [6]. However, this methodology consumes a large amount of power, on average, and can be harmful to the human body. It is difficult to implement as an embedded system, because of its high throughput and complexity. In contrast to CW Doppler radar, ultra-wideband (UWB) impulse radar has low exposure risks for the human body as well as low power consumption and high compatibility with peripheral equipment [7]. Thus, UWB impulse radar was identified as the optimal solution for medical applications. Studies have been performed on measuring the heart rate from an actual human body by utilizing a UWB impulse radar.
Because a radar signal’s phase changes caused by minute movements of the human body can easily be observed in the frequency domain [8], these studies
processed the radar signal in this domain in order to analyze the phase variations of the radar signal caused by the heartbeat [9-11]. Fourier transforms are commonly used to move time domain radar signals into the frequency domain. However, it is necessary to attain a frequency resolution sufficiently fine to accurately detect the frequency of the heartbeat forming the low and narrow frequency bands. This requires the Fourier transform to be executed after accumulating the radar signal over a sufficiently long period to increase the number of samples in the time domain. Although the frequency resolution grows as the observation interval lengthens, short-term frequency changes cannot be observed. As a result, this factor increases the discrepancy between the measured frequency and the actual heartbeat frequency.
This paper proposes a method of accurately extracting the heartbeat frequency while simultaneously increasing the frequency resolution but without increasing the number of samples and demonstrating less sensitivity to changes in distance between the antenna and the subject, compared to other methods. In order to accomplish this, the radar pulses reflected from the human body are not analyzed as they arrive but only after their spectra have been accumulated, and chirp z-transform (CZT) is used to extract the heartbeat’s frequency from the phase information obtained from the set of amplitude spectra. It is possible to extract the heartbeat frequency with CZT at a frequency resolution higher than that of discrete Fourier transform (DFT) only in the heartbeat’s frequency band.
An experiment to verify the performance of the proposed method is also carried out, and it confirms that the heartbeat frequency can be accurately extracted with this method.
2. Related Work
Among the studies that utilized UWB impulse radar to detect the frequency of a heartbeat, the most relevant works are as follows. The spectrum-averaged harmonic path (SHAPA) algorithm found the frequency of a heartbeat by analyzing the shape of the radar signal’s frequency spectrum [10]. In particular, it was assumed that both the fundamental frequency of the heartbeat and its harmonics could be found in the spectrum of the squared magnitude of the radar signal’s DFT. If the interval between the peaks of both the fundamental frequency and its harmonics in the spectrum had a specific value, this interval was considered to represent the frequency of the heartbeat.
In a study by Lazaro et al. [11], radar pulses were emitted from a pulse generator, and the signals reflected from a human body were processed after being sampled by a sampler converter. A harmonic canceller, which selectively removes the components corresponding to the integral multiples of the respiratory frequency, was applied to the sampled radar signals to eliminate the harmonics of the respiration component, and CZT was used to detect the frequency of the heartbeats.
3. UWB Impulse Radar
3.1 UWB Impulse Radar Signal
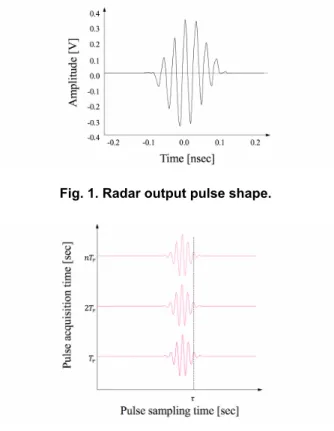
A commercial impulse radar transceiver, NVA6201 [12], which emits pulses via an antenna and samples the pulses reflected from the target using a strobed sampling method, is employed in this study’s experiment. Each pulse is in the form of a sine wave with a Gaussian envelope and a width of less than 0.4 ns, and the center frequency and bandwidth of each radar pulse are 6.8 GHz and 2.3 GHz, respectively. The shape of a pulse in the time domain is shown in Fig. 1. Pulses that pass through the body’s surface interact with tissue. Most of the energy of a pulse that travels into body tissue is absorbed by the tissue, and the components that are reflected at the interface of each tissue and released into the air are negligible. Therefore, it can be assumed that the pulses arriving at the antenna are mainly reflected from the body’s surface. The radar pulse reflected from the human body is a non-stationary signal that has phase variations caused by respiration and the heartbeat.
The conceptual images used to describe the shapes of the radar pulses mathematically captured at the receiving antenna are shown in Fig. 2. In this paper, the range at the sampling rate of the transceiver is referred to as the pulse sampling time, and the cross-range sampled at the pulse repetition frequency, which is the frequency at which the pulse is emitted, is referred to as the pulse acquisition time. According to Ren et al. [8], the radar pulse emitted by the antenna is expressed as
Fig. 1. Radar output pulse shape.
Fig. 2. Conceptual shapes of radar pulses used in mathematical expression.
( )
( ) (
sin 2)
t c
x τ =g τ π τf (1) where g
( )
τ and fc denote the Gaussian function and the center frequency of the sine wave, respectively, and τ is a time variable corresponding to the distance from the antenna to the target, expressed as τ = 2R/c, where R is the distance from the radar system to the target, and c is the speed of light. The pulse received by the radar system after being reflected from the human body can be expressed as(
ٛ,)
(
,)
(
(
)
)
r r d r c d
x τ nT =g τ−T nT π f τ−T (2) where Tr represents the period for collecting pulses reflected from the target, and nTr represents the time at which the nth pulse is collected. In addition, Td represents the time delay that occurs on the path along which the pulse is reflected off the target and back to the radar system, and is expressed as
(
)
(
)
2 rsin 2 r r hsin 2 h r
d
R A f nT A f nT
T = ⎡⎣ + π + π ⎤⎦c (3)
where Ar , Ah , fr , and fh represent the respiration amplitude, heartbeat amplitude, respiration frequency, and heartbeat frequency, respectively. Therefore, the second and third terms, respectively, in the numerator represent the displacements of the chest surface caused by respiration and the heartbeat.
The Fourier transform of the received signal after being reflected from the human body can be expressed as
(
ٛ,)
(
,)
j2 (f f Tc)dr r
F f nT =G f nT e− π − (4)
where G f
( )
is the Fourier transform of the Gaussian function.According to Eq. (4), the Fourier transform of the received signal has a phase component expressed by ejTd ,
which is a function of Td. Since (altered by respiration and heartbeat) is a dependent variable of nTr , and
(
,ٛ r)
G f nT is a constant term for nTr, an observation of
(
, r)
F f nT along the pulse-acquisition-time axis reveals phase changes caused by both heartbeat and respiration.
3.2 Consideration of Harmful Effects of
the Radar Pulse on the Human Body
In this study, the UWB safety regulations of the Federal Communications Commission (FCC) and emission limits for medical imaging systems in particular have been applied. According to FCC regulations, the effective isotropic radiated power (EIRP) in the 3.1–10.6 GHz band is limited to less than −41.3 dBm/MHz regarding whole-body radiation [13]. Applying this limit to the study, the EIRP for a bandwidth of 2.3 GHz measures approximately −7.7 dBm. The range satisfying the FCC limit of the EIRP measures approximately 34.7 cm. It was calculated by substituting the output power of the radar system used inthe experiment into the radar equation. Therefore, to avoid being harmfully affected by electromagnetic waves, the subject should be placed outside a range of approximately 35 cm. Since the subject is placed 70 cm away from the radar antenna, the harmfulness to the human body is expected to be insignificant. If the power of the radar pulse is amplified at the output stage, the range at which the EIRP drops below the safety limit must be calculated, and the risk must be eliminated by placing subjects outside the range during experiments or practical applications.
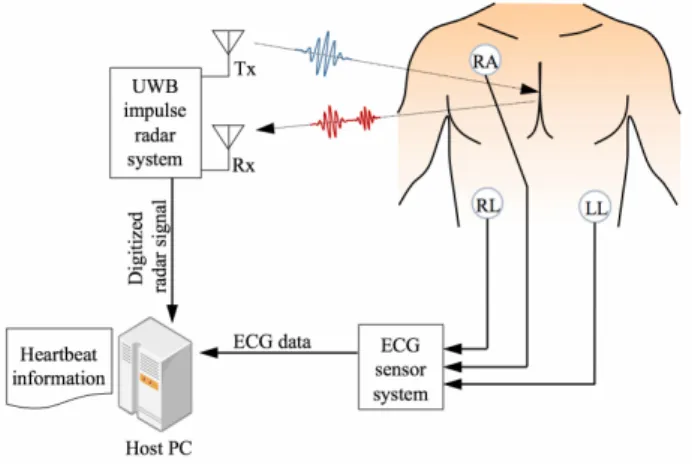
3.3 Setup for Radar Signal Acquisition
The setup for measuring radar signals is shown in Fig. 3. Pulses come from the transmitter antenna (Tx) of the UWB impulse radar system, and the pulses reflected from the human body go to the receiver antenna (Rx). Radar pulses are emitted from the transceiver with -12.6 dBm average power and amplified at a rate of 6 dBi at the antenna. The UWB impulse radar system converts the received radar signals into digital data and transmits them to the host PC that executes the proposed algorithm. The ECG sensor system is synchronized with the UWB impulse radar system using the same time base, and the ECG heartbeats are compared with those extracted by the radar system as reference points.The power of the received radar signal is inversely proportional to the fourth power of the distance in the radar equation [14]. If the distance to the target is more than 1 m, then signal amplification is needed in the radar pulse transmitter/receiver stage in order to detect the heartbeat. In the present study, it was not appropriate to use signal amplification, because this might have led to excessive human exposure to electromagnetic waves. Therefore, the experimental radar data was measured from human bodies located no further than 1 m from the radar device.
4. Methodology
In order to accurately extract the heartbeat frequency from the received radar signal, the following procedure is performed. Unlike the conventional method, which
calculates the spectrum of the entire frequency band via discrete Fourier transform to extract frequency components, a CZT that can provide a higher frequency resolution is utilized for the frequency band of the heartbeat.
1. Subtract the average from a received frame 2. Build a frame set by stacking frames. 3. Execute the Fourier transform on each frame. 4. Apply filters to the time series of each frequency to
remove components other than the heartbeat.
5. Multiply the time series by the window function to prevent frequency leakage.
6. Apply CZT to each time series.
7. Create a one-dimensional amplitude spectrum for the CZT frequency.
8. Find the frequency at which the maximum peak appears.
4.1 Preprocessing the Radar Signal
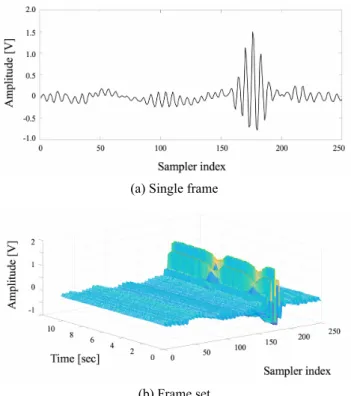
The received radar signal was a superposition of all the reflected pulses that exhibited changes in both amplitude and phase at a particular moment. Furthermore, considering the movement of the ribcage from breathing and the heartbeat, the shape of the pulse became more complicated. The received pulse was output as digital data after being sampled in the transceiver. A set of output data representing the amplitudes of 256 samples is called a frame. Since the frame received by the antenna has a DC value, the latter has to be removed by subtracting the average from each corresponding frame.
In order to detect the heartbeat, a frame set obtained by accumulating 512 frames is used. The frame set is represented in a two-dimensional matrix composed of 256 sampler index numbers and 512 time units. The shape of a
received pulse and a frame set are shown in Fig. 4. The pulse sampling time axis in Fig. 2 corresponds to the sampler index axes in Figs. 4(a) and (b), and the pulse acquisition time axis of Fig. 2 corresponds to the time axis in Fig. 4(b). As mentioned earlier, the time series of each sampler of the frame set contains the phase changes of the radar pulses caused by both respiration and the heartbeat. Therefore, observation of the frame set along the time axis reveals phase changes due to the heartbeat and respiration. Some of the ripples near the 170th index in Fig. 4(b) are the components reflected by the human body. Specifically, the small and large ripples are due to phase changes caused by the heartbeat and respiration, respectively.
4.2 Accumulation of Magnitude Spectra
In order to observe the phase change due to the heartbeat, the frames obtained at specific time intervals were converted into frequency domain samples via Fourier transform. The phase change can also be observed near the peaks in the time domain frame set. However, because the position of the peaks varies with the distance between the radar antenna and the subject, an additional process is needed to determine the peaks. This fact makes it disadvantageous to utilize the time domain frame set. Furthermore, in the frequency domain, the peaks appear at a specific position that corresponds to the fundamental frequency of the radar pulses. The peaks can therefore be found at a fixed position, regardless of the changes in the distance to the subject.In the present study, each frame in the time domain frame set was converted into Fourier transform samples through the fast Fourier transform (FFT) algorithm. After the Fourier transform, a new frame set with a size of 512 × 256 (time units and sampler index numbers, respectively) was created, and the sampler index axis was converted into the frequency axis. Since the Fourier transform of each frame is symmetrical with respect to the center point, only one side is used. A frame set with a size of 512 × 129 is shown in Fig. 5. The largest peak observed near 6.8 GHz is the fundamental frequency of the radar pulse. As mentioned above, the changes in the radar pulse phase caused by the heartbeat and breathing can be observed in the time series in which the Fourier transform samples of an arbitrary frequency are arranged in the direction of the time axis. The peaks of the fundamental frequency along the time axis direction reveal clearly observable phase changes in the form of ripples.
4.3 Application of a Band-pass Filter to
the Time Series
Since the frequency of a heartbeat ranges from 1 Hz to 3 Hz [15], a band-pass filter (BPF) that passes the frequency components within that range was applied to the time series of each frequency on the frequency axis shown in Fig. 5. With this filter, high-frequency noise and low-frequency components originating from stationary targets, such as walls or human respiration, were effectively removed. It is apparent that a certain pattern appears in the region between 5.6 GHz and 7.3 GHz in Fig. 6, which was (a) Single frame
(b) Frame set
a combination of a pattern of heartbeats in the time axis direction and the peaks of a frame where the amplitude was changed by the BPF. This pattern is an important feature that shows the heartbeat's appearance over time in the frame sets of the time domain as well as of the frequency domain. To implement the band-pass filter, a fourth-order Butterworth filter with cutoff frequencies of 1 Hz and 3 Hz was designed.
4.4 Application of Chirp z-Transform
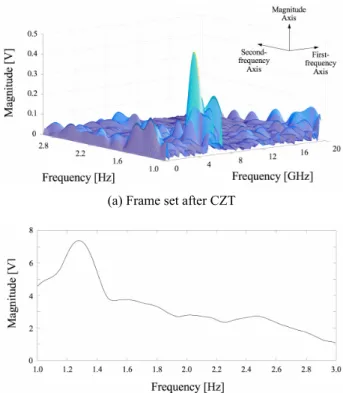
Prior to spectral analysis, the data passed through the BPF was multiplied by a Hamming window to minimize the spectral leakage. Then, unlike other studies that used DFT to extract heartbeat frequencies, a CZT algorithm is adopted to provide a high-frequency resolution to only the 1–3 Hz band of interest. A DFT is a special form of z-transform, and its values are computed for the points spaced equally around the unit circle in the z-plane [16].However, CZT permits computation of the z-transform on a more general contour. This provides some flexibility, in that the number of samples of the z-transform does not have to be the same as the number of input samples, the contour in the z-plane does not necessarily need be a circle, and the spacing of the samples can be arbitrary [17]. This implies that it is possible to observe an arbitrary frequency band below the sampling frequency at an arbitrary frequency resolution via CZT. In this study, CZT was applied to obtain 512 z-transformed samples in the 1–3 Hz band for the time series of each frequency on the frequency axis. In this case, the heartbeat frequency can be represented with a resolution of 2/512 Hz. As a result of the application of CZT, a two-dimensional data array is generated, which has a size of 512 × 129 and is composed of a frequency axis generated via FFT (the first-frequency axis) and a frequency axis generated by CZT (the second-frequency axis). The data pattern is shown in Fig. 7(a).
4.5 Calculation of the Heartbeat
Frequency
A one-dimensional spectrum for the second-frequency axis is obtained by adding all of the magnitudes that exist in the direction of the first-frequency axis at the points corresponding to the frequencies in the second-frequency axis. As a result, the dominant frequency component in the time interval corresponding to the length of the frame set is revealed, and the conceptual shape of the spectrum is shown in Fig. 7(b). The frequency at which the largest peak in the figure appears corresponds to the frequency of the heartbeat.
4.6 ECG Data Processing
QRS patterns were extracted utilizing the Pan and Tompkins algorithm [18]. The time interval between the R peaks was then used to calculate the heart rate. Because a detailed description of the QRS detection algorithm is beyond the scope of this paper, it has been omitted.
5. Experiment and Discussion
The setup for the experiment was the one shown in Fig. 3, where the subject was located 70 cm away from the antenna of the radar system. The subject was breathing normally without sudden movements while sitting in a chair, and electrodes were attached to the right arm (RA), left leg (LL), and right leg (RL) to obtain a LEAD II ECG. After emitting radar pulses to each subject, the signals reflected from the body were collected, and the heartbeat Fig. 5. Frame set after FFT.
Fig. 6. Frame set after BPF.
(a) Frame set after CZT
(b) Sum of the amplitude spectra of all first-axis frequencies Fig. 7. Magnitude spectrum of the frame set.
was extracted by applying the proposed algorithm to the radar signals. Five subjects with different physical conditions participated in the experiment. During the collection of the radar signals, the ECG was measured and used as a reference point for determining the accuracy of the estimation method.
The statistical value used to verify the accuracy of the proposed algorithm was the error rate for beats per minute (BPM), which represented the percent difference between the BPM rate obtained from the ECG and the BPM rate extracted from the proposed method, where a BPM rate was expressed as the product of the heartbeat frequency and 60. The error rate was expressed as
( )
100 %Estimate Ref Ref BPM BPM Error Rate BPM − = × (5)where BPMEstimate and BPMRef represent the BPM estimated
by the proposed method and the reference BPM from the ECG data, respectively.
Eight frame sets corresponding to approximately 82 s in time were taken from each subject in the experiment. The average error rate for 40 frame sets was approximately 1.7%. For comparison, another experiment was performed in which the CZT algorithm is replaced with an FFT algorithm in the procedure of the proposed method. The heartbeat frequency showed an error rate of approximately 2.7% when FFT was used for the same data. The resultant error rate was higher than that from CZT. This was because the frequency resolution provided by FFT is lower than that provided by CZT.
Specifically, the number of elements in the FFT output was 512, which is the same as the number of elements in the input data, and the frequency of the heartbeat could be expressed with a resolution of 25/256 Hz. With CZT, the heartbeat frequency was expressed with a resolution of 2/512 Hz, so more precise representation is possible. The representation of the 1–3 Hz band with 512 frequency components may seem redundant. However, it is intended to examine the frequency resolution that could be obtained when calculating CZT samples that have an equal number to that of the input samples. In fact, even when the number of CZT samples was reduced to 256, it was effective in improving the frequency resolution.
When a person participates in the experiment as a target, both the reflection coefficients and the body surface areas of the individual are considered as factors affecting the power of the received radar signals [19]. However, the results of the experiment showed that differences in these factors had insignificant effects on the power of the received radar pulse. Therefore, it was considered that, in this case, the physical factor does not affect the accuracy of the proposed method. This was mainly because the subjects were relatively close to the antenna, and the opening angles of the antenna are narrow.
There are some comparable studies measuring the heart rate from an actual human body by utilizing a UWB impulse radar. The SHAPA algorithm presented above demonstrated an error rate of 4.0%. However, this method has limitations because it assumes that the heartbeat does
not change abruptly during the measurement period and the peaks at the fundamental frequency (as well as those at all of the harmonics) are spaced at specific intervals. That is, it is difficult to calculate the heartbeat frequency accurately because the heartbeat changes continuously, even during the measurement period, and the position of each peak changes when the heartbeat changes rapidly. Lazaro et al. used high-frequency resolution to extract the heartbeat frequency through CZT after removing the harmonic components of the respiration frequency. While the proposed method collects radar signals for 10.24 s, Lazaro et al.’s experiment collected radar pulses for a relatively long period of 35 s at 37.1 ms intervals. Since a radar signal reflected from a human body is a non-stationary signal that changes continuously, even during measurement, short-term changes in frequency are difficult to detect, and the extracted heartbeat frequency cannot closely follow the actual frequency for long time periods during pulse acquisition. This causes a larger error. In addition, if the heartbeat frequency is an integral multiple of the respiration frequency, there is a possibility that the first will be influenced by the harmonic canceller.
As a result, it was confirmed that the proposed method, which executes CZT on the Fourier transform of the radar signal accumulated at intervals of 20 ms, can extract the heartbeat frequency of a subject located within a distance of less than 1 m with high accuracy.
6. Conclusion
This paper proposed a method of extracting the frequency information of the heartbeat with a high-frequency resolution in the heartbeat’s high-frequency band, unlike other studies that used DFT to extract heartbeat frequencies. To accomplish this, a frame set was constructed by accumulating radar signals at 20 ms intervals, and the data in all frames were converted to frequency domain data using FFT. Then, the frequency of the heartbeat was extracted by executing CZT with a bandwidth range of 1–3 Hz and a 1/512 Hz frequency resolution for the time series of each sampler storing amplitude spectra in the frame set.
An experiment was conducted to verify the performance of the proposed method on various target subjects. During the experiment, the heartbeat frequencies of subjects located within 1 m of the antenna were extracted with an average error rate of 1.7%.
In conclusion, the proposed method, which has a performance differentiated from other methods discussed above, can be used to extract the heartbeat frequency using UWB impulse radar.
Acknowledgement
This research was supported by the DGIST R&D Program of the Ministry of Science, ICT, and Technology of Korea (17-NT-01).
References
[1] C. G. Bilich, “Bio-Medical Sensing using Ultra Wideband Communications and Radar Technology: A Feasibility Study,” Proceedings of the 1st International Pervasive Health Conference and Workshops, PervasiveHealth, pp. 1-9, 2006. Article (CrossRef Link)
[2] S. H. Fouladi, I. Balasingham, T. A. Ramstad and K. Kansanen, “Accurate Heart Rate Estimation From Camera Recording Via MUSIC Algorithm,” Proceedings of the 37th Annual International Conference of the IEEE Engineering in Medicine and Biology Society, pp. 7454-7457, 2015. Article (CrossRef Link)
[3] H. Y. Wu, M. Rubinstein, E. Shih, J. Guttag, F. Durand and W. Freeman, “Eulerian Video Magnification for Revealing Subtle Changes in the World,” ACM Transaction on Graphics, Vol. 31, No. 4, pp. 65:1-65:8, 2012. Article (CrossRef Link)
[4] V. Michell, D. J. Rosenorn, S. R. Culliver and W. Currie, Handbook of Research on Patient Safety and Quality Care through Health Informatics, IGI Global, 2013. [5] K. F. Wu and Y. T. Zhang, “Contactless and
continuous monitoring of heart electric activities through clothes on a sleeping bed,” Proceedings of the 5th International Conference on Information Technology and Application in Biomedicine, pp. 282-285, 2008. Article (CrossRef Link)
[6] L. Ren, H. Wang, K. Naishadham, Q Liu, and A. E. Fathy, “Non-Invasive Detection of Cardiac and Respiratory Rates from Stepped Frequency Continuous Wave Radar Measurements Using the State Space Method,” 2015 IEEE MTT-S International Microwave Symposium, pp. 1−4 2015.
Article (CrossRef Link)
[7] B. Gupta, E. Cianca, M. Ruggieri, and R. Prasad, “A novel FM-UWB system for vital sign monitoring and its comparison with IR-UWB,” Proceedings of the 2nd International Symposium on Applied Sciences in Biomedical and Communication Technologies, pp. 1-4, 2009. Article (CrossRef Link)
[8] L. Ren, Y. S. Koo, Y. Wang, and A. E. Fathy, “Noncontact heartbeat detection using UWB impulse Doppler radar,” Proceedings of the IEEE Topical Conference on Biomedical Wireless Technologies, Networks, and Sensing System, pp. 14-16, 2015.
Article (CrossRef Link)
[9] T. Sakamoto, R. Imasaka, H. Taki, T. Sato, M. Yoshioka, K. Inoue, T. Fukuda, and H. Sakai, “Accurate heartbeat monitoring using ultra-wideband radar,” Journal of IEICE Electronics Express, Vol. 12, No. 3, pp. 1-7, 2015. Article (CrossRef Link)
[10] V. Nguyen, A. Q. Javaid and M. A. Weitnauer, “Spectrum-averaged harmonic path (SHAPA) algorithm for non-contact vital sign monitoring with ultra-wideband (UWB) radar,” Proceedings of the 36th Annual International Conference of the IEEE Engineering in Medicine and Biology Society, pp.
2241-2244, 2014. Article (CrossRef Link)
[11] A. Lazaro, D. Girbau, and R. Villarino, “Analysis of vital signs monitoring using an IR-UWB radar,” Progress in Electromagnetics Research 100, pp. 265-284, 2010. Article (CrossRef Link)
[12] Novelda, “NVA620x Preliminary Datasheet,” 2013. [13] G. Breed, “A Summary of FCC Rules for Ultra
Wideband Communications,” High Frequency Electronics, pp. 42-44, 2005. Article (CrossRef Link)
[14] M. I. Skolnik, Radar Handbook, 3rd ed., McGraw-Hill, 2008.
[15] F. Mohammad-Zahed, F. Taghibakhsh, and B. Kaminska, “Contactless heart monitoring,” Proceedings of the Canadian Conference on Electrical and Computer Engineering, pp. 583-585, 2007. Article (CrossRef Link)
[16] J. G. Proakis and D. K. Manolakis, Digital signal processing, 4th ed., Pearson, 2006.
[17] L. R. Rabiner, R. W. Schaffer, and C. M. Rader, “The chirp z-transform algorithm,” IEEE Transactions on Audio and Electroacoustics, Vol. 17, No. 2, pp. 86– 92, 1969. Article (CrossRef Link)
[18] J. Pan and W. J. Tompkins, “A real-time QRS detection algorithm,” IEEE Transactions on Biomedical Engineering, Vol. BME-32, No. 3, pp. 230-236, 1985. Article (CrossRef Link)
[19] C. C. Johnson and A. W. Guy, “Non-ionizing electromagnetic wave effects in biological materials and systems,” Proceedings of the IEEE, Vol. 60, No. 6, pp.692-718, 1972. Article (CrossRef Link)
Hui-Sup Cho is a Senior Researcher of the Intelligent Devices and Systems Research Group at the Daegu Gyeongbuk Institute of Science and Technology (DGIST) in Korea, joining it in 2005. He received his BSc and MSc in Electronics from Kyungpook National University, Korea, in 1999 and 2001, respectively, and received his PhD in Medical and Biological Engineering from Kyungpook National University in 2017. He was a senior researcher with LG Electronics and worked on research and development of digital television systems from 2001 to 2005. His research interests include biomedical engineering, image processing systems, radar application systems, and various fields of electronics.
Young-Jin Park received his MSc in Computer Engineering from Kyung- pook National University, Korea, in 2004. He is a Researcher with the Intelligent Devices and Systems Research Group at the Daegu Gyeong- buk Institute of Science and Techno- logy (DGIST) in Korea, joining it in 2011. His research interests include radar application systems, embedded software, and other fields of computer engineering.