ORIGINAL ARTICLE
Mitochondrial pyruvate dehydrogenase phosphatase 1
regulates the early differentiation of cardiomyocytes
from mouse embryonic stem cells
Hye Jin Heo
1, Hyoung Kyu Kim
1, Jae Boum Youm
1, Sung Woo Cho
2, In-Sung Song
1, Sun Young Lee
1,
Tae Hee Ko
1, Nari Kim
1, Kyung Soo Ko
1, Byoung Doo Rhee
1and Jin Han
1Mitochondria are crucial for maintaining the properties of embryonic stem cells (ESCs) and for regulating their subsequent differentiation into diverse cell lineages, including cardiomyocytes. However, mitochondrial regulators that manage the rate of differentiation or cell fate have been rarely identified. This study aimed to determine the potential mitochondrial factor that controls the differentiation of ESCs into cardiac myocytes. We induced cardiomyocyte differentiation from mouse ESCs (mESCs) and performed microarray assays to assess messenger RNA (mRNA) expression changes at differentiation day 8 (D8) compared with undifferentiated mESCs (D0). Among the differentially expressed genes, Pdp1 expression was significantly decreased (27-fold) on D8 compared to D0, which was accompanied by suppressed mitochondrial indices, including ATP levels, membrane potential, ROS and mitochondrial Ca2+. Notably, Pdp1 overexpression significantly enhanced the mitochondrial indices and
pyruvate dehydrogenase activity and reduced the expression of cardiac differentiation marker mRNA and the cardiac
differentiation rate compared to a mock control. In confirmation of this, a knockdown of the Pdp1 gene promoted the expression of cardiac differentiation marker mRNA and the cardiac differentiation rate. In conclusion, our results suggest that mitochondrial PDP1 is a potential regulator that controls cardiac differentiation at an early differentiation stage in ESCs.
Experimental & Molecular Medicine (2016) 48, e254; doi:10.1038/emm.2016.70; published online 19 August 2016
INTRODUCTION
Embryonic stem cells (ESCs) are self-renewing and pluripotent and differentiate into diverse cell lineages.1ESCs are a valuable
tool for studying early cardiomyogenesis.2–4Several molecular and conditional factors have been suggested to be major inducers of ESC-derived cardiomyogenesis, including cardiac transcription factors,5 reactive oxygen species (ROS)6 and hypoxic environments.7 Recent studies have suggested that
several mitochondrial factors regulate cardiomyocyte differen-tiation, including mitochondrial DNA transcription factors,8
mitochondrial ROS levels,6 and mitochondrial permeability transition pore (mPTP) states.9,10Recently, it was reported that the inhibition of mPTP promotes early cardiomyocyte differ-entiation from pluripotent stem cells and maturation in developing embryos.10,11
These observations suggest that mitochondria can determine cardiomyocyte differentiation capacity in both human and mouse ESCs (mESCs) via the modulation of energy metabolism.12–16
Energy metabolic turnover, from anaerobic glycolysis to oxidative phosphorylation, is predominantly regulated by mitochondria and is an essential step that triggers ESC differentiation into cardiomyocytes.17 Therefore, the robust
regulation of mitochondrial energy metabolism shifts is essen-tial to meet energy demands during cell differentiation.
The molecular mechanisms underlying mitochondrial energy metabolism during cardiomyocyte differentiation remain unclear. This study aimed to investigate possible mitochondrial regulators that are necessary for cardiomyocyte differentiation from mESCs. Among mitochondrial regulators, the pyruvate dehydrogenase (PDH) complex regulates the acetyl-CoA conversion rate from pyruvate. The acetyl-CoA conversion rate directly affects tricarboxylic acid (TCA) cycle activity, providing NADH2 to electron transfer chain com-plexes. Thus, the PDH complex has been hypothesized to be a mitochondrial molecular regulator of cardiomyocyte differen-tiation. In this study, we screened differentially expressed genes
1National Research Laboratory for Mitochondrial Signaling, Department of Physiology, College of Medicine, Cardiovascular and Metabolic Disease Center,
Inje University, Busan, Korea and2Laboratory of Vascular Biology and Stem Cell, Graduate School of Medical Science and Engineering, Korea Advanced
Institute of Science and Technology, Daejeon, Korea
Correspondence: Professor J Han, National Research Laboratory for Mitochondrial Signaling, Department of Physiology, College of Medicine, Cardiovascular and Metabolic Disease Center, Inje University, Busan 614-735, Korea.
E-mail: phyhanj@inje.ac.kr
related to energy metabolism during embryoid body (EB) differentiation and found significantly modulated expression of PDH complex components.
Among these regulators, we report that the expression of the pyruvate dehydrogenase phosphatase catalytic subunit 1 (Pdp1) gene was significantly reduced during the early stages of mESC-derived EB differentiation. To examine whether Pdp1 affects cardiomyocyte differentiation, we established mESCs that transiently overexpressed or consistently inhibited Pdp1 in mESCs. In addition, we investigated PDH complex activity and mitochondrial function changes in these cells.
MATERIALS AND METHODS
Maintenance of undifferentiated mESCs
The mESC line R1 (ATCC) was routinely cultured and grown on mito-tically arrested mouse embryonic fibroblasts (MEFs, 50 000 cells per cm2) in 60-mm culture plates.18For MEF exclusion, EMG7 (mESCs),
which have an α-myosin heavy chain (MHC) promoter controlling greenfluorescent protein (GFP) expression, were maintained in 0.1% gelatin-coated 60-mm culture dishes without a feeder layer.10
Induction of mESC-derived cardiomyocytes using EBs
The hanging-drop method was used to generate EBs from 750 cells per 20μl differentiation media (differentiation day 0, D0).18On day 4 of
differentiation, EBs were seeded in 1% gelatin-coated culture dishes for each experiment. During differentiation, the culture media were changed daily. Beginning on day 6 of differentiation (2 days after plating), EB growth was observed daily for self-beating capacity. For analyses, EBs were dissociated with 0.1% collagenase (Worthington, Lakewood, NJ, USA) plus 0.25% trypsin-EDTA (Gibco, Waltham, MA, USA) for 30 min at 37 °C.
Transient overexpression of Pdp1 in R1 mESCs
The Pdp1 gene was subcloned into the EcoRI/XbaI enzyme sites of the FUW expression vector. FUW vectors with the Pdp1 coding sequence or empty FUW vectors were transfected into HEK293FT cells to produce Pdp1-containing viruses. Two days after transfection, virus-containing media were collected to treat undifferentiated R1 cells. After treatment with virus-containing media, the hanging-drop method was employed to induce differentiation in mESC-derived cardiomyocytes.
Stable suppression of Pdp1 in EMG7 mESCs
For lentivirus-mediated Pdp1 gene transfer, the EMG7 mESC line was incubated for 15 min with 6μg ml− 1 Polybrene. Cells were transfected with 10μl of 1 × 10⁶TU ml− 1 of viral particles (Sigma-Aldrich, St Louis, MO, USA). Twenty hours after the first transfection, virus-containing media were removed and three times the number of viral particles was added for the second virus transfection.19
To establish a stable cell line, we purified transfected cells using a final concentration of 3μg ml− 1of puromycin (Sigma-Aldrich) and used the hanging-drop method for EB generation.
Analysis of mRNA expression using quantitative real-time PCR
Total RNA was purified using the RNeasy mini kit (Qiagen, German-town, MD, USA). Complementary DNA (cDNA) was synthesized in a 50-μl volume using Super-Script III First-Strand Synthesis (Invitrogen, Waltham, MA, USA). cDNA was amplified using Taq DNA
polymerase (Invitrogen) in the presence of 1μM oligonucleotide
primers. Quantitative real-time PCR was performed using the iQ5 real-time system and iQ SYBR Supermix (Bio-Rad, Hercules, CA, USA). Expression of target mRNAs relative to housekeeping gene expression (glyceraldehyde 3-phosphate dehydrogenase (GAPDH) mRNA) was calculated using the threshold cycle (CT) as r= 2–Δ(ΔCT), where ΔCT= CT target− CT GAPDH and
Δ(ΔCT)= ΔCTD8 – ΔCTD0. The primer sequences are shown in
Table 1 and Supplementary Table S1.
Western blot analyses
Cells were homogenized in protein lysis buffer and centrifuged at 10 000 g for 10 min at 4 °C. After centrifugation, protein samples (50μg) were transferred onto nitrocellulose membranes, which were then incubated with primary antibodies against sarcomericα-actinin (Sigma-Aldrich), cTnT (Abcam, Cambridge, UK), PDP1 (Abcam), PDH-E1α (Abcam) and β-tubulin (Abcam). Immunoreactive protein bands were detected using the SuperSignal West Pico system and visualized using LAS-3000 PLUS (Fuji Photo Film Company, Tokyo, Japan).
Immunocytochemistry
Undifferentiated ESCs (D0) and differentiated EBs (D8) were cultured on gelatinized 12-mm glass coverslips, fixed for 30 min at room temperature in 4% paraformaldehyde, and permeabilized for 30 min at room temperature using 0.2% Triton X-100. After permeabilization, EBs were blocked for 10 min at room temperature with CAS-Block solution (Invitrogen) and incubated overnight at 4 °C with mouse monoclonal antibodies against Oct 3/4 (Abcam) and cardiac troponin T (cTnT, Abcam). In addition, goat anti-mouse IgG (Abcam) was applied to primary antibody-labeled EBs. Confocal images were obtained using a Carl Zeiss LSM 700 laser scanning microscope (Zeiss, Oberkochen, Germany).
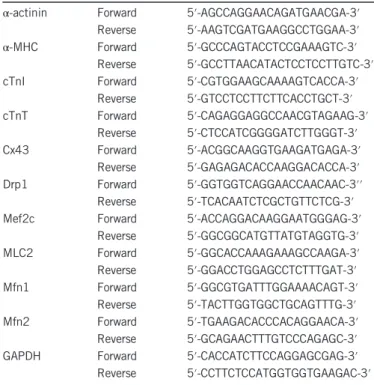
Table 1 Quantitative real-time PCR primer sequences
α-actinin Forward 5′-AGCCAGGAACAGATGAACGA-3′ Reverse 5′-AAGTCGATGAAGGCCTGGAA-3′ α-MHC Forward 5′-GCCCAGTACCTCCGAAAGTC-3′
Reverse 5′-GCCTTAACATACTCCTCCTTGTC-3′ cTnI Forward 5′-CGTGGAAGCAAAAGTCACCA-3′
Reverse 5′-GTCCTCCTTCTTCACCTGCT-3′ cTnT Forward 5′-CAGAGGAGGCCAACGTAGAAG-3′ Reverse 5′-CTCCATCGGGGATCTTGGGT-3′ Cx43 Forward 5′-ACGGCAAGGTGAAGATGAGA-3′ Reverse 5′-GAGAGACACCAAGGACACCA-3′ Drp1 Forward 5′-GGTGGTCAGGAACCAACAAC-3′′ Reverse 5′-TCACAATCTCGCTGTTCTCG-3′ Mef2c Forward 5′-ACCAGGACAAGGAATGGGAG-3′
Reverse 5′-GGCGGCATGTTATGTAGGTG-3′ MLC2 Forward 5′-GGCACCAAAGAAAGCCAAGA-3′ Reverse 5′-GGACCTGGAGCCTCTTTGAT-3′ Mfn1 Forward 5′-GGCGTGATTTGGAAAACAGT-3′ Reverse 5′-TACTTGGTGGCTGCAGTTTG-3′ Mfn2 Forward 5′-TGAAGACACCCACAGGAACA-3′ Reverse 5′-GCAGAACTTTGTCCCAGAGC-3′ GAPDH Forward 5′-CACCATCTTCCAGGAGCGAG-3′
Flow cytometry analyses
Cells were stained with 0.1 nM tetramethylrhodamine, methyl ester
(TMRM) and 5μMMitoSox-Red (Invitrogen) for 30 min at 37 °C to detect mitochondrial membrane potential and mitochondrial ROS. To measure mitochondrial calcium levels, 5μMRhod2-AM (Invitrogen)
was applied to dissociated EBs for 2 h on ice, followed by incubation for 30 min at 37 °C. After staining, cells were washed in phosphate-buffered saline (PBS) and analyzed on a dual-laser FACSCaliburflow cytometer (Becton Dickinson, Franklin Lakes, NJ, USA).
Measurement of oxygen consumption
After cell dissociation, the oxygen consumption rate (OCR) was measured using the NeoFox Phase Measurement system (Ocean Optics, Dunedin, FL, USA) and a 400-μl chamber at room tempera-ture in air-saturated (220 nM per O2 per ml) culture media. After
measurement, cells were collected for protein quantification. The OCR is expressed as nMO2per min per mg of total protein.
ATP assays
ATP concentrations were analyzed using ATP bioluminescent assay kits (Sigma-Aldrich). Briefly, 100 μl of ATP assay mix working solution, 100μ of ATP-releasing reagent and 50 μ of ultrapure water were mixed by vortexing in each assay vial. Cells were collected and 1 × 10⁵cells were added to each vial. Luminescence was detected using
SpectraMax M2 (Molecular Devices, Sunnyvale, CA, USA). ATP concentrations were calculated using a standard curve with known concentrations (0, 1.25, 2.5, 5 and 10μM) of an ATP standard.
Target labeling and hybridization to microarray
For control (D0) and test RNAs (D8), cRNA probe synthesis and hybridization were performed using Agilent’s Low Input Quick Amp Labeling Kit (Agilent Technology, Santa Clara, CA, USA). Labeled target cRNA was quantified using an ND-1000 spectrophotometer (Nanodrop Technologies, Wilmington, DE, USA). After evaluating the labeling efficiency, 850 ng of each cyanine 3- and cyanine 5-labeled target cRNA was mixed and cRNA fragmentation was performed by adding 10 × blocking agent and 25 × fragmentation buffer, followed by incubation for 30 min at 60 °C. The fragmented cRNA was resuspended in 2 × hybridization buffer and transferred to an assembled Agilent Mouse GE 4 × 44 K v2 Microarray. Arrays were hybridized at 65 °C for 17 h in an Agilent hybridization oven (Agilent Technology). The microarrays were washed according to the manu-facturer’s washing protocol (Agilent Technology).
Measurement of PDH activity
Cells (D0 and D8) were prepared and adjusted to have the same cell number. After sample preparation, PDH activity assay kits (Abcam) were used to determine PDH complex activity.
Statistical analysis
The results are expressed as the mean± s.e.m. The data were analyzed using parametric unpaired Student’s t-tests. P-values o0.05 were considered statistically significant.
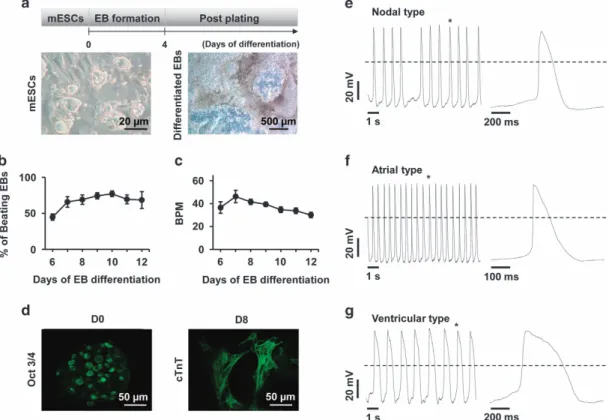
Figure 1 Cardiomyocyte differentiation from mESCs. (a) Undifferentiated R1 mESCs were dissociated and cultured using the hanging drop method to produce differentiated EBs. EBs were transferred to culture plates after 4 days to promote differentiation into cardiomyocyte-included heterogeneous cells. (b) The self-beating capacity and (c) beating number per minute was then measured. (d) Pluripotency and cardiac-specific proteins were stained with an antibody against Oct 3/4 and cTnT. (e–g) Three types of action potentials (e: nodal, f: atrial, g: ventricular) were recorded in mESC-derived cardiomyocytes by patch clamp. EB, embryoid body.
RESULTS
Differentiation of mESC-derived cardiomyocytes using EBs To investigate whether EBs can differentiate into mature cardiomyocytes, R1 ESCs were cultured using the hanging-drop method. The beating EBs and beat-per-minute rates were measured in differentiation day 6 to day 12 cultures (Figure 1a–c). cTnT was strongly expressed and distinct sarcomere structures were observed in differentiating EBs (D8; Figure 1d).
Electrophysiological properties of mESC-derived cardiomyocytes in EBs
To evaluate the electrophysiological characteristics of beating cardiomyocytes from D8, three types of action potentials (APs) were recorded (Figure 1e–g). Depolarizing step pulses were performed to activate outward currents. We observed a biphasic time course with fast activation and slow inactivation (Supplementary Figure S1b). Outward currents were blocked in a reversible manner using 10 mM tetraethylammonium
(TEA; Supplementary Figure S1b and S1c). However, there was no indication of an inward current carried through the inward rectifying K+channel when hyperpolarizing test pulses
between 100 and− 70 mV were applied to cells from a holding potential of − 60 mV (data not shown). The current–voltage (I–V) relationship of TEA-sensitive currents was determined by integrating the results from depolarizing and hyperpolarizing step pulses (Supplementary Figure S1d). The relationship was outward rectifying, suggesting that they were voltage-dependent K+ currents, which are primarily due to the K
V family.
Currents activated by depolarizing test pulses on D0 cells were linear and much smaller (o1/10) than those on D8 cells, indicating that D0 cells only exhibit background leak con-ductance (Supplementary Figure S1a).
To identify Ca2+-selective currents, a Cs+-rich pipette solution was employed and a Na+-rich solution with 10 mM
Ba2+was used as the bath solution. As shown in Supplementary
Figure S2a, a series of depolarizing step pulses between − 70 and +40 mV (from a holding potential of − 80 mV) activated inward currents with fast activation and slow inactiva-tion. The I–V relationship was constructed by plotting peaks of inward currents against each test potential and showed an inverted bell shape, where the maximum current density was between − 40 and − 30 mV (Supplementary Figure S2b). The inward currents were not sensitive up to 2μMnifedipine, which
is a specific L-type Ca2+channel blocker. Mibefradil, which is
specific for T-type Ca2+ channels, blocked inward current by
~ 50% at 1μM (Supplementary Figure S2c). A dose–response
relationship was obtained by plotting the degree of blocking against the concentration of mibefradil (Supplementary Figure S2d). The relationship fit the Hill equation, where the half-maximal effective concentration was 1.19μM(n= 3).
Con-sidering that these currents are activated at potentials near rest, and they are sensitive to mibefradil, they are more likely to be Ca2+currents belonging to T-type rather than L-type channels. Altogether, these data provide evidence of the electrophysiolo-gical characteristics of cardiomyocytes differentiated from EBs.
Mitochondrial function changes during differentiation To determine whether mitochondrial functions were altered during mESC differentiation, we measured intracellular ATP levels and OCR at D0 and D8 (Figure 2a and b). Usingflow cytometry analyses, we measured mitochondrial membrane potential (0.1 nM TMRM), mitochondrial ROS levels (5μM
MitoSox) and mitochondrial calcium levels (5μMRhod-2, AM;
Figure 2c–e). All three parameters were significantly lower at D8 compared with D0, indicating that mitochondria functions were decreased in differentiating EBs compared with undiffer-entiated ESCs. OCR was not significantly different between D0 and D8 cultures.
Gene expression changes during differentiation
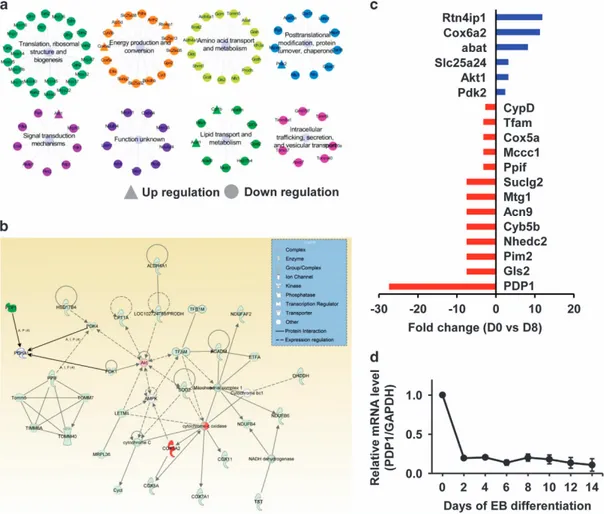
To examine alterations in gene expression, we performed microarray analyses of total mRNA in undifferentiated ESCs (D0) and differentiating EBs (D8). As shown in Figure 3c and Supplementary Table S2, many mitochondria-related genes were upregulated and downregulated at D8 compared with D0. A large proportion of the identified genes were associated with
Figure 2 Measurement of mitochondrial function in differentiating EBs. (a) The intracellular ATP content and (b) oxygen consumption rate in mESC-derived EBs were determined on the indicated days after EB formation (D0 and D8). (c–e) Fluorescence-associated flow-cytometry analysis for the detection of mitochondrial functions. Cells were stained with TMRM (mitochondrial membrane potential) (c), MitoSox-Red (mitochondrial ROS) (d), and Rhod-2 AM (mitochondrial calcium) (e) and analyzed by flow cytometry. *Po0.05, #Po0.01, †Po0.001. EB, embryoid body; mESC,
functional categories such as‘translation, ribosomal structure, biogenesis’ and ‘energy production and conversion’ (Figure 3a). Moreover, pathway enrichment analysis revealed that the genes were related to several pathways especially in energy production (Figure 3b). In particular, the Pdp1 gene, which encodes a protein that converts pyruvate into acetyl-CoA in mitochon-dria, exhibited the lowest expression at D8 (Figure 3c and Supplementary Table S2). Quantitative PCR analyses con-firmed that Pdp1 expression decreased during differentiation (Figure 3d).
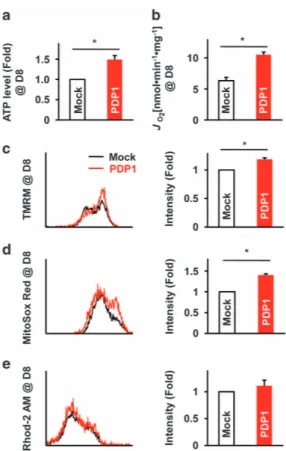
Pdp1 overexpression and mitochondrial function in mESC-derived EBs
We transduced Pdp1 into mESCs to confirm the correlation of Pdp1 expression with mitochondrial function. We assessed ATP levels and OCR (Figure 4a and b) in control cells (mock) and Pdp1 -transduced cells (PDP1). We also evaluated the intensity of TMRM, MitoSox and Rhod-2 in mock and Pdp1 -overexpressing cells at D8 (Figure 4c-e). As shown in Figure 4, Pdp1 -overexpressing cells at D8 exhibited higher ATP levels, OCR, mitochondrial membrane potential and ROS levels
compared with D8 mock cells. Moreover, Ca2+ levels were
slightly increased in cells overexpressing Pdp1 at D8 compared with D8 mock cells.
Pdp1 overexpression and changes in PDH complex activity in differentiating EBs
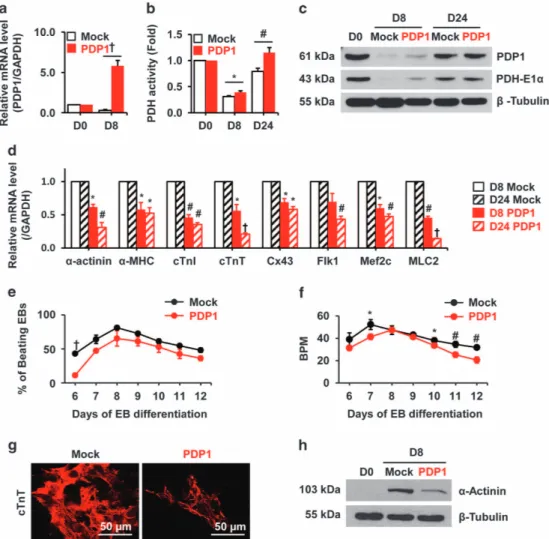
We transiently transfected Pdp1 into undifferentiated mESCs, and expression was confirmed using quantitative real-time PCR and western blotting (Figure 5a and c). The Pdp1 group showed higher Pdp1 expression levels compared with mock at D8 (Figure 5a). Expression of PDP1 and the PDH complex protein PDH-E1α was also increased at D8 in the PDP1 group compared with control. However, the late stage of differentia-tion (D24) did not show significant differences between the two groups except PDH activity, which showed a difference (Figure 5b and c).
Pdp1 overexpression and cardiomyogenesis in mESC-derived EBs
To determine whether Pdp1 expression can regulate cardiac differentiation potential, we compared the expression levels of
Figure 3 Alteration of genes during differentiation. (a) Microarray analyses of total mRNA in R1 mESCs revealed specific changes in genes that were classified into functional categories. ▲ increased, ● decreased in D0 vs D8 cells. (b) PDP1-related functional protein network-energy production network. (c) Microarray-revealed mRNA expression differences between undifferentiated EB (day0;D0) and differentiated EB (day8;D8). Blue: increased genes in day 8, red: decreased genes in day8. (d) Alteration of Pdp1 mRNA levels during differentiation (qPCR data). EB, embryoid body; mRNA, messenger RNA.
cardiomyocyte transcription factors using quantitative real-time PCR. As shown in Figure 5d,α-actinin, α-MHC, cTnI, cTnT, Cx43, Flk1, Mef2c and MLC2 exhibited lower expression levels in cells expressing Pdp1 compared with mock cells at D8 and D24. Beating EB frequencies and BPM were also decreased in Pdp1—overexpressing cells compared with mock cells (Figure 5e and f). Pdp1 -overexpressing EBs showed decreased cTnT immunostaining (Figure 5g) compared with mock cells. The α-actinin protein level was also significantly decreased (Figure 5h). In addition, early endodermal lineage markers including AFP and GATA4 were reduced in the PDP1 group at D24 (Supplementary Figure S3a and b), but there were no significant changes in the early ectoderm markers nestin and noggin (Supplementary Figure S3c and d) suggesting Pdp1 may regulate both mesodermal and endodermal lineage differentia-tion but ectodermal lineage.
We transduced the Pdp1 gene into EMG7 ESCs and generated EBs for differentiation without feeder cells (Supplementary Figure S4a). As shown in Supplementary Figure S4b, the expression of cardiac-specific genes was significantly downregulated by Pdp1 overexpression at D8
and D24. Moreover, the population of αMHC-GFP+ cardio-myocytes decreased in cells overexpressing Pdp1 compared with mock cells (Supplementary Figure S4c).
Pdp1 suppression and mitochondrial function in mESC-derived EBs
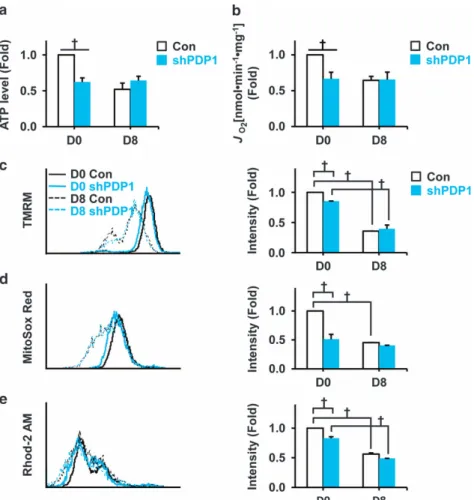
To verify the role of Pdp1 in mESC-derived cardiomyocyte differentiation, we stably suppressed Pdp1 in EMG7 ESCs. To determine whether Pdp1 suppression affects mitochondrial function, we measured ATP levels and OCR (Figure 6a and b), as well as the intensity of TMRM, MitoSox and Rhod-2 in control and shPDP1 cells on D8 (Figure 6c–e). The shPDP1 group had decreased ATP levels and OCR values compared with the control group at D0. After 8 days of differentiation, ATP levels and OCR values were not significantly different between the two groups. Moreover, the mitochondrial mem-brane potential, amount of ROS and calcium levels (TMRM, MitoSox and Rhod-2 intensity) were decreased in control versus shPDP1 cells at D0 or control cells at D0 versus D8. However, there were no differences between groups at D8. Downregulation of PDH complex activity via Pdp1 inhibition in feeder-free mESCs
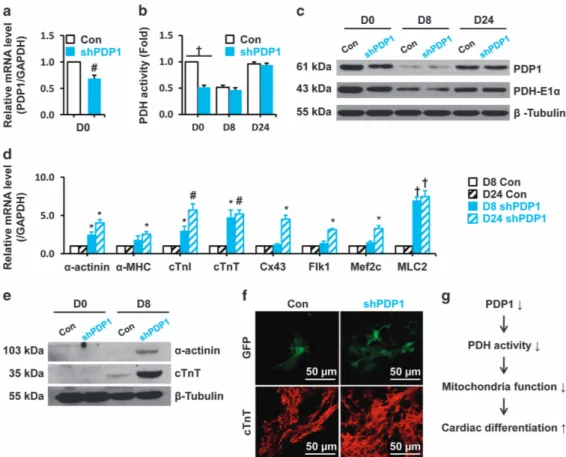
The Pdp1 -suppressed group (shPDP1) showed significantly decreased Pdp1 gene and protein expression levels com-pared with control (Con) undifferentiated mESCs (D0) (Figure 7a and c). Moreover, PDH complex activity and PDH-E1α expression were also downregulated in shPDP1 cells (D0, Figure 7b and c). Interestingly, there were no differences in PDH complex activity and PDH-E1α expression at D8 and D24 (Figure 7b and c).
Upregulation of cardiomyogenesis from Pdp1 inhibition in feeder-free conditions
Next, we compared expression of cardiac-specific markers between control (Con) and shPDP1 groups at D8 and D24. Cardiac-specific markers were significantly upregulated in D8 and D24 in shPDP1 cells compared with control cells (Figure 7d). Moreover,α-actinin and cTnT protein levels were higher (Figure 7e), andαMHC-GFP+and cTnT+ cardiomyo-cytes were also increased in shPDP1 cells compared to the control group (Figure 7f).
DISCUSSION
Previous studies have demonstrated that mitochondrial func-tion and biogenesis can determine cardiac differentiafunc-tion potential from mESCs.15,20 Moreover, a mitochondrial
func-tional index, such as the inner membrane potential, can be used as a practical tool for selecting differentiated cardiomyocytes.21On the basis of these data, we hypothesized that there are mitochondrial modulators regulating cardiomyo-cyte differentiation from mESCs. Here we showed that mitochondrial PDP1 of mESCs could modulate the cardiac differentiation potential.
Using a standard ESC differentiation procedure, we success-fully obtained differentiated EBs, including cardiomyocytes.18,22
Figure 4 Changes in mitochondrial function in Pdp1 -overexpressing EBs. (a) The intracellular ATP content and (b) oxygen consumption rate in mock and Pdp1 -overexpressing mESC-derived EBs were determined at D8. (c–e) Fluorescence-associated flow cytometry was performed for the detection of mitochondrial functions in mock and Pdp1 -overexpressing mESC-derived EBs at D8. Cells were stained with TMRM (c) MitoSox-Red (d) and Rhod-2 AM (e) and analyzed byflow cytometry. *Po0.05 vs mock. EB, embryoid body; mESC, mouse embryonic stem cells.
In the present study, differentiating EBs (D8) exhibited beating ability with a molecular identity similar to cardiomyocytes (Figure 1). Electrophysiological analyses confirmed that differ-entiating EBs, including cardiomyocytes, showed three types of APs, inward rectifying K+ channels (Kirs) and T-type Ca2+
channels, which are typical characteristics of cardiomyocytes. Generally, Kir channels are crucial for stabilizing the resting
membrane potential and action potentials.23,24 In addition,
the T-type Ca2+ channel was recorded, likely indicating
primarily cardiomyocyte characteristics and the necessary role for excitation-contraction and pacemaker activity in cardiomyocytes.25,26 However, undifferentiated mESCs
main-taining pluripotency (D0) did not have electrophysiological activity with linear currents. These results suggest that our differentiated EBs were biologically and functionally similar to cardiomyocytes.
Next, we analyzed mitochondrial global gene expression profiles during differentiation. Compared with undifferen-tiated ESCs (D0), differentiating EBs (D8) displayed a lower expression of genes involved in regulating mitochondrial energy production and conversion. In particular, Pdp1 mRNA expression was decreased 27-fold in differentiating EBs (D8). It has been reported that the PDH complex acts as a crucial regulator of mitochondrial energy metabolism, linking the TCA cycle and subsequent oxidative phosphor-ylation with glycolysis.17The PDH complex is controlled by
PDP1, PDP2 and PDH kinase (PDK) 1-4 isoenzymes.27,28
PDH phosphatases comprise PDP1 and PDP2 and are located in the mitochondrial matrix space and regulate the PDH complex dephosphorylation and reactivation.27,28
Notably, the PDP1 and PDP2 isoforms are highly expressed in rat heart, kidney and skeletal muscle.29–31Because PDPs
Figure 5 Effect of Pdp1 overexpression on cardiomyogenesis in differentiating EBs. R1 mESCs were transduced with empty vector or Pdp1 (mock or PDP1 groups). (a) Changes in Pdp1 mRNA expression during differentiation were confirmed using quantitative real-time PCR. (b) PDH complex activity was analyzed in all groups. (c) PDP1 and the PDH complex protein PDH E1α expression was evaluated by western blotting with specific antibodies. (d) After Pdp1 gene overexpression, cardiac muscle-specific molecular markers (α-actinin, α-MHC, cTnI, cTnT, Cx43, Flk1, Mef2c, MLC2) were analyzed by quantitative real-time PCR in Mock and PDP1 group (D8 mock vs D8 PDP1, D24 mock vs D24 PDP1). (e) The beating rates of EBs and (f) BPM were measured during differentiation. (g) Both groups were immunostained using the cardiac-specific antibody cTnT. (h) Cardiomyocyte marker α-actinin expression was analyzed by western blotting in D0 and D8 mock and Pdp1 overexpressed cells. *Po0.05,#Po0.01,†Po0.001 vs mock. BPM, beat-per-minute; EB, embryoid body; mESC, mouse embryonic stem cells; mRNA, messenger RNA; PDH, phosphate dehydrogenase.
are key redox and biological energy sensors, PDP1 and PDP2 expression is acutely altered by starvation, diabetes and aerobic exercise, which subsequently modulates PDH com-plex activities.32–34
The phosphorylated PDH E1α subunit causes PDH inactiva-tion and decreases acetyl-CoA levels entering the TCA cycle.35 The PDH E1α subunit is highly phosphorylated in pluripotent stem cells compared with differentiated cells.17,27 Interestingly, PDP2 expression was decreased in both H7TF and IMR-90 differentiated cells compared with human pluripotent stem cells. In addition, hypoxia-inducible factor (Hif-1), which is overexpressed under hypoxic conditions, increases PDK1 activity, inhibiting the PDH complex from using pyruvate in the TCA cycle.17,36 Thus, lower mitochondrial oxygen con-sumption is observed and cell death is inhibited under hypoxic conditions. During mESC differentiation using EB formation, a hypoxic region is observed in the EB core in normoxic culture conditions.37A recent study demonstrated that hypoxia increases cardiomyogenesis during human ESC differentiation.7
Consistent with previous studies, differentiating EBs (D8)
exhibited lower energy production activity with decreased ATP levels and OCR compared with undifferentiated ESCs (D0) at an early differentiation stage. In addition, we showed decreased mitochondrial membrane potential, ROS levels and calcium levels in differentiating EBs (D8) (Figure 2).
To determine whether PDP1 is a potential mitochondrial modulator for cardiomyogenesis especially in the early differ-entiation stage, we investigated the effect of Pdp1 overexpres-sion or suppresoverexpres-sion-mediated energy metabolism during mESC differentiation. Pdp1 overexpression resulted in increased mitochondrial function and PDH complex activity, but the cardiac differentiation potential was significantly attenuated in differentiating EBs (D8; Figures 4 and 5). In contrast, Pdp1 suppression decreased mitochondrial function and PDH com-plex activity in D8, but the late differentiation (D24) did not represent a significant difference (Figures 6 and 7). Moreover, the shPDP1 group promoted cardiomyogenesis at both D8 and D24. These results clearly proved our hypothesis that PDP1 is a potential mitochondrial modulator for cardiomyogenesis at the early differentiation stage.
Figure 6 Changes in mitochondrial function after Pdp1 inhibition (shPDP1) in feeder-free mESCs. (a) The intracellular ATP content and (b) oxygen consumption rate in control and Pdp1 knockdown (shPDP1) EMG7-derived EBs were determined at D0 and D8. (c–e) Fluorescence-associatedflow cytometry was performed to detect mitochondrial functions in Con and shPDP1 EMG7-derived EBs at D0 and D8. Cells were stained with TMRM (mitochondrial membrane potential) (c), MitoSox-Red (mitochondrial ROS) (d), and Rhod-2 AM (mitochondrial calcium) (e) and analyzed byflow cytometry. †Po0.001 vs Con. Con, control; mESC, mouse embryonic stem cells; EB, embryoid body.
In contrast to our findings, mitochondrial oxidative phos-phorylation is generally increased during cardiomyocyte differ-entiation from pluripotent stem cells.10,16,17 These conflicting findings may depend on cell type, differentiation method, cell heterogeneity and culture environments, including hypoxic conditions.7 Indeed, consistent with our findings, the
mito-chondrial membrane potential was depolarized and ATP consumption and glycolysis-based energy metabolism were reduced in differentiated cells compared with human ESCs and iPSCs.38Collectively, the previous and current data indicate that higher mitochondrial function may have stringent roles in pluripotent stem cells compared with differentiating EBs. However, our study is limited by the absence of PDK function data on cardiomyogenesis even as slight differences in PDK enzymes were shown through microarray analysis. As previously described, PDP and PDK enzymes have opposing effects, and PDK depletion may give the same result in suppressing ESC differentiation into cardiomyocytes.28,29 Therefore, further
stu-dies are required to fully understand the effects of PDP1 and its interaction with other PDH complex-regulating enzymes.
Moreover, we also need to prove that the exogenous donation of ATP may directly inhibit cardiac differentiation.
In conclusion, our data suggest that PDP1 in mESCs acts as a new mitochondrial regulator via the PDH complex and effectively increases cardiomyogenesis properties (Figure 7g), which is important for transplantation in cardiac stem cell therapy. Moreover, these results also provide new insights into cardiomyocyte differentiation metabolism in stem cell therapy and regenerative medicine.
CONFLICT OF INTEREST
The authors declare no conflict of interest.
ACKNOWLEDGEMENTS
We thank Professors Gou Young Koh, Jun K. Yamashita and Dr Robin A McGregor for their technical advice and valuable discussions. This work was supported by the Priority Research Centers Program (2010-0020224) and the Basic Science Research Program (NRF-2011-0028925 and 2015R1A2A1A13001900) through the National Research Foundation of Korea (NRF), funded by the Ministry of Education, Science, and Technology.
Figure 7 Effect of Pdp1 inhibition on cardiomyogenesis in differentiating EBs. Pdp1 was suppressed in the EMG7 mESC cell line (shPDP1), and PDH complex activity was examined with the corresponding control group (Con). (a) Pdp1 expression was examined using quantitative real-time PCR. (b) PDH complex activity was measured in the both groups at D0, D8, and D24. (c) Protein level of PDP1 and PDH-E1α were analyzed in both groups at D0, D8, and D24 by western blot. (d) Relative mRNA level of cardiac-specific markers were examined by quantitative real-time PCR in the control and shPDP1 groups. (e) The expression of cardiac-specific proteins (α-actinin and cTnT) was also evaluated by western blotting. (f) Immunohistochemistry results ofαMHC-GFP and cTnT stained cardiomyocytes in Con and shPDP1. (g) Proposed role of PDP1 in cardiac differentiation.#Po0.01,†Po0.001 vs Con.
1 Thomson JA, Itskovitz-Eldor J, Shapiro SS, Waknitz MA, Swiergiel JJ, Marshall VS et al. Embryonic stem cell lines derived from human blastocysts. Science 1998; 282: 1145–1147.
2 Kumar D, Kamp TJ, LeWinter MM. Embryonic stem cells: differentiation into cardiomyocytes and potential for heart repair and regeneration. Coron Artery Dis 2005; 16: 111–116.
3 Boheler KR, Czyz J, Tweedie D, Yang HT, Anisimov SV, Wobus AM. Differentiation of pluripotent embryonic stem cells into cardiomyocytes. Circ Res 2002; 91: 189–201.
4 Mauritz C, Schwanke K, Reppel M, Neef S, Katsirntaki K, Maier LS et al. Generation of functional murine cardiac myocytes from induced pluripotent stem cells. Circulation 2008; 118: 507–517.
5 Turbendian HK, Gordillo M, Tsai SY, Lu J, Kang G, Liu TC et al. GATA factors efficiently direct cardiac fate from embryonic stem cells. Development 2013; 140: 1639–1644.
6 Crespo FL, Sobrado VR, Gomez L, Cervera AM, McCreath KJ. Mitochondrial reactive oxygen species mediate cardiomyocyte formation from embryonic stem cells in high glucose. Stem Cells 2010; 28: 1132–1142.
7 Horton RE, Auguste DT. Synergistic effects of hypoxia and extracellular matrix cues in cardiomyogenesis. Biomaterials 2012; 33: 6313–6319. 8 StJohn JC, Ramalho-Santos J, Gray HL, Petrosko P, Rawe VY, Navara CS
et al. The expression of mitochondrial DNA transcription factors during early cardiomyocyte in vitro differentiation from human embryonic stem cells. Cloning Stem Cells 2005; 7: 141–153.
9 Folmes CDL, Dzeja PP, Nelson TJ, Terzic A. Mitochondria in control of cell fate. Circ Res 2012; 110: 526–529.
10 Cho SW, Park JS, Heo HJ, Park SW, Song S, Kim I et al. Dual modulation of the mitochondrial permeability transition pore and redox signaling syner-gistically promotes cardiomyocyte differentiation from pluripotent stem cells. J Am Heart Assoc 2014; 3: e000693.
11 Hom JR, Quintanilla RA, Hoffman DL, de Mesy Bentley KL, Molkentin JD, Sheu SS et al. The permeability transition pore controls cardiac mitochon-drial maturation and myocyte differentiation. Dev Cell 2011; 21: 469–478. 12 Schieke SM, Ma M, Cao L, McCoy JP, Liu C, Hensel NF et al. Mitochondrial metabolism modulates differentiation and teratoma formation capacity in mouse embryonic stem cells. J Biol Chem 2008; 283: 28506–28512. 13 Panopoulos AD, Izpisua Belmonte JC. Anaerobicizing into pluripotency.
Cell Metab 2011; 14: 143–144.
14 San Martin N, Cervera AM, Cordova C, Covarello D, McCreath KJ, Galvez BG. Mitochondria determine the differentiation potential of cardiac mesoangioblasts. Stem Cells 2011; 29: 1064–1074.
15 Mandal S, Lindgren AG, Srivastava AS, Clark AT, Banerjee U. Mitochondrial function controls proliferation and early differentiation potential of embryo-nic. Stem Cells Stem Cells 2011; 29: 486–495.
16 Folmes CD, Nelson TJ, Martinez-Fernandez A, Arrell DK, Lindor JZ, Dzeja PP et al. Somatic oxidative bioenergetics transitions into pluripotency-dependent glycolysis to facilitate nuclear reprogramming. Cell Metab 2011; 14: 264–271.
17 Ludgate M, Varum S, Rodrigues AS, Moura MB, Momcilovic O, Easley CA et al. Energy metabolism in human pluripotent stem cells and their differentiated counterparts. PLoS ONE 2011; 6: e20914.
18 Puceat M. Protocols for cardiac differentiation of embryonic stem cells. Methods 2008; 45: 168–171.
19 Ludwig TE, Bergendahl V, Levenstein ME, Yu J, Probasco MD, Thomson JA. Feeder-independent culture of human embryonic stem cells. Nat Methods 2006; 3: 637–646.
20 Facucho-Oliveira JM, Alderson J, Spikings EC, Egginton S, St John JC. Mitochondrial DNA replication during differentiation of murine embryonic stem cells. J Cell Sci 2007; 120: 4025–4034.
21 Hattori F, Chen H, Yamashita H, Tohyama S, Satoh YS, Yuasa S et al. Nongenetic method for purifying stem cell-derived cardiomyocytes. Nat Methods 2010; 7: 61–66.
22 Maltsev VA, Wobus AM, Rohwedel J, Bader M, Hescheler J. Cardiomyocytes differentiated in vitro from embryonic stem cells developmentally express cardiac-specific genes and ionic currents. Circ Res 1994; 75: 233–244.
23 Anumonwo JM, Lopatin AN. Cardiac strong inward rectifier potassium channels. J Mol Cell Cardiol 2010; 48: 45–54.
24 Abtahi SR, Sadraei H, Nematollahi M, Karbalaie K, Karamali F, Salamian A et al. Functional expression of potassium channels in cardiomyocytes derived from embryonic stem cells. Res Pharm Sci 2012; 7: 1–11. 25 Ono K, Iijima T. Pathophysiological significance of T-type Ca2+ channels:
properties and functional roles of T-type Ca2+ channels in cardiac pacemaking. J Pharmacol Sci 2005; 99: 197–204.
26 Yanagi K, Takano M, Narazaki G, Uosaki H, Hoshino T, Ishii T et al. Hyperpolarization-activated cyclic nucleotide-gated channels and T-type calcium channels confer automaticity of embryonic stem cell-derived cardiomyocytes. Stem Cells 2007; 25: 2712–2719.
27 Holness MJ, Sugden MC. Regulation of pyruvate dehydrogenase complex activity by reversible phosphorylation. Biochem Soc Trans 2003; 31: 1143–1151.
28 Huang B, Gudi R, Wu P, Harris RA, Hamilton J, Popov KM. Isoenzymes of pyruvate dehydrogenase phosphatase. DNA-derived amino acid sequences, expression, and regulation. J Biol Chem 1998; 273: 17680–17688. 29 Dinsmore JH, Dib N. Stem cells and cardiac repair: a critical analysis.
J Cardiovasc Transl Res 2008; 1: 41–54.
30 Leblanc PJ, Harris RA, Peters SJ. Skeletal musclefiber type comparison of pyruvate dehydrogenase phosphatase activity and isoform expression in fed and food-deprived rats. Am J Physiol Endocrinol Metab 2007; 292: E571–E576.
31 Leblanc PJ, Mulligan M, Antolic A, Macpherson L, Inglis JG, Martin D et al. Skeletal muscle type comparison of pyruvate dehydrogenase phosphatase activity and isoform expression: effects of obesity and endurance training. Am J Physiol Regul Integr Comp Physiol 2008; 295: R1224–R1230. 32 Love LK, LeBlanc PJ, Inglis JG, Bradley NS, Choptiany J, Heigenhauser GJ
et al. The relationship between human skeletal muscle pyruvate dehydro-genase phosphatase activity and muscle aerobic capacity. J Appl Physiol 2011; 111: 427–434.
33 Huang B, Wu P, Popov KM, Harris RA. Starvation and diabetes reduce the amount of pyruvate dehydrogenase phosphatase in rat heart and kidney. Diabetes 2003; 52: 1371–1376.
34 Fisher-Wellman KH, Lin CT, Ryan TE, Reese LR, Gilliam LA, Cathey BL et al. Pyruvate dehydrogenase complex and nicotinamide nucleotide transhydrogenase constitute an energy-consuming redox circuit. Biochem J 2015; 467: 271–280.
35 Rardin MJ, Wiley SE, Naviaux RK, Murphy AN, Dixon JE. Monitoring phosphorylation of the pyruvate dehydrogenase complex. Anal Biochem 2009; 389: 157–164.
36 Papandreou I, Cairns RA, Fontana L, Lim AL, Denko NC. HIF-1 mediates adaptation to hypoxia by actively downregulating mitochondrial oxygen consumption. Cell Metab 2006; 3: 187–197.
37 Lee SW, Jeong HK, Lee JY, Yang J, Lee EJ, Kim SY et al. Hypoxic priming of mESCs accelerates vascular-lineage differentiation through HIF1-mediated inverse regulation of Oct4 and VEGF. EMBO Mol Med 2012; 4: 924–938.
38 Prigione A, Hossini AM, Lichtner B, Serin A, Fauler B, Megges M et al. Mitochondrial-associated cell death mechanisms are reset to an embryonic-like state in aged donor-derived iPS cells harboring chromosomal aberrations. PLoS ONE 2011; 6: e27352.
This work is licensed under a Creative Commons Attribution-NonCommercial-NoDerivs 4.0 Inter-national License. The images or other third party material in this article are included in the article’s Creative Commons license, unless indicated otherwise in the credit line; if the material is not included under the Creative Commons license, users will need to obtain permission from the license holder to reproduce the material. To view a copy of this license, visit http://creativecommons.org/licenses/by-nc-nd/4.0/