men classified as unlikely to be, uncertain to be, or likely to be vitamin B12 deficient (Table 1A). HoloTC was
significantly (P ⬍0.01) lower in the group of vegan men unlikely to have vitamin B12 deficiency compared with
omnivores, whereas this was not the case for B12 (P ⫽ 0.30; Table 1A).
Finally we examined whether holoTC might replace combined testing with B12, MMA, and tHcy. In this analysis, individuals were classified as likely to have vitamin B12deficiency if at least two of three tests were
outside the cutoff limits (B12 ⬍120 ng/L, MMA ⬎0.75 mol/L, tHcy ⬎15 mol/L; n ⫽ 56) or not (n ⫽ 139; all others). The diagnostic accuracy of holoTC was then assessed by ROC curve analysis (Fig. 1B). The areas under the ROC curves were 0.91 (95% CI, 0.87– 0.95) for all individuals, 0.88 (95% CI, 0.82– 0.95) for vegan men re-cruited from the EPIC study, and 0.92 (95% CI, 0.85– 0.99) for the men recruited from the London Vegan Society.
We also compared holoTC and the other three markers in omnivores and in vegan men classified as unlikely to be, uncertain to be, or likely to be vitamin B12deficient
based on test results for B12, MMA, and tHcy (Table 1B). HoloTC was significantly lower (P⫽ 0.017) in the vegan men who were unlikely to be vitamin B12deficient
com-pared with the omnivores, whereas no significant differ-ence was observed for the other three measures: B12 (P⫽ 0.49), MMA (P⫽ 0.37), and tHcy (P ⫽ 0.47).
Each of the laboratory tests used for diagnosis of vitamin B12deficiency has its weaknesses. The metabolites
MMA and tHcy are influenced by kidney function (10, 11 ), and tHcy also depends on the folate status of the patient. B12 is influenced by the concentration of the binding proteins of vitamin B12 and is increased in
pa-tients with myeloproliferative diseases (12 ).
Our data are consistent with an early decrease of holoTC in vitamin B12 deficiency in vegans and further
suggest that holoTC might replace combined testing with B12, MMA, and tHcy in this population group. If holoTC is used as the primary screening test, we suggest no further testing for patients with holoTC ⬎50 pmol/L (unlikely to suffer from vitamin B12deficiency) and
ho-loTC ⬍25 pmol/L (likely to suffer from vitamin B12
deficiency). For patients with holoTC between 25 and 50 pmol/L, we would suggest further testing with one of the metabolic markers.
Further studies are needed to evaluate the validity of holoTC in other patient groups, especially those with con-ditions likely to influence markers of vitamin B12deficiency.
Measurement of holoTC may be of particular value in identifying vitamin B12 deficiency in patients with kidney
malfunction, in whom the metabolites may show falsely increased values (10, 11 ), and in patients with myelopro-liferative diseases, in whom the concentration of B12 may be falsely increased (12 ). We conclude that holoTC is a promising indicator of vitamin B12deficiency.
This work was supported by the Internationale Stiftung fur Erna¨hrungsforschung und fur Erna¨hrungsaufkla¨rung,
EUREKA (CT-T2006) and by EU Biomed (QLK3-CT-2002-01775). The assistance of Anna-Lisa Christensen, Roy Sherwood, and Jette Fisker Pedersen is warmly acknowl-edged. None of the authors has a conflict of interest to declare.
References
1. Ulleland M, Eilertsen I, Quadros EV, Rothenberg SP, Fedosov SN, Sundre-hagen E, et al. Direct assay for cobalamin bound to transcobalamin (holotranscobalamin) in serum. Clin Chem 2002;48:407–9.
2. Nexo E, Christensen AL, Hvas AM, Petersen TE, Fedosov SN. Quantitation of holo-transcobalamin, a marker of vitamin B12deficiency. Clin Chem 2002; 48:561–2.
3. Carmel R. Measuring and interpreting holo-transcobalamin (transcobalamin II). Clin Chem 2002;48:526 –32.
4. Rasmussen K, Moller J, Lyngbak M, Pedersen AM, Dybkjaer L. Age- and gender-specific reference intervals for total homocysteine and methylma-lonic acid in plasma before and after vitamin supplementation. Clin Chem 1996;42:630 – 6.
5. Obeid R, Geisel J, Schorr H, Hubner U, Herrmann W. The impact of vegetarianism on some haematological parameters. Eur J Haematol 2002; 69:275–9.
6. Herrmann W, Schorr H, Obeid R, Geisel J. Vitamin B-12 status, particularly holotranscobalamin II and methylmalonic acid concentration, and hyperho-mocysteinemia in vegetarians. Am J Clin Nutr 2003;78:131– 6.
7. Refsum H, Yajnik CS, Gadkari M, Schneede J, Vollset SE, Orning L, et al. Hyperhomocysteinemia and elevated methylmalonic acid indicate a high prevalence of cobalamin deficiency in Asian Indians. Am J Clin Nutr 2001;74:233– 41.
8. Loikas S, Lopponen M, Suominen P, Moller J, Irjala K, Isoaho R, et al. RIA for serum holo-transcobalamin: method evaluation in the clinical laboratory and reference interval. Clin Chem 2003;49:455– 62.
9. Hvas AM, Ellegaard J, Nexø E. Increased plasma methylmalonic acid does not predict clinical manifestations of vitamin B-12 deficiency. Arch Intern Med 2001;161:1534 – 41.
10. Rasmussen K, Vyberg B, Pedersen KO, Brochner-Mortensen J. Methylma-lonic acid in renal insufficiency: evidence of accumulation and implications for diagnosis of cobalamin deficiency. Clin Chem 1990;36:1523– 4. 11. Hultberg B, Andersson A, Sterner G. Plasma homocysteine in renal failure.
Clin Nephrol 1993;40:230 –5.
12. Gimsing P, Nexø E. Cobalamin-binding capacity of haptocorrin and transco-balamin: age-correlated reference intervals and values from patients. Clin Chem 1989;35:1447–51.
DOI: 10.1373/clinchem.2003.020743
Haplotype Structure of the UDP-Glucuronosyltrans-ferase 1A1 (UGT1A1) Gene and Its Relationship to Serum Total Bilirubin Concentration in a Male Korean Population,Chang-Seok Ki,1 Kyung-A Lee,2Soo-Youn Lee,1
Hee-Jin Kim,1 Sang Sun Cho,3 Jun-Hee Park,3 Seunghee
Cho,3Kwang Min Sohn,3and Jong-Won Kim1*(1Department
of Laboratory Medicine, Sungkyunkwan University School of Medicine, Samsung Medical Center, Ilwon-Dong, Kangnam-Gu, Seoul 135-710, Korea; 2
Depart-ment of Laboratory Medicine, College of Medicine, Korea University, Anam-Dong, Seongbuk-Gu, Seoul, Korea;
3Clinical Research Center, Samsung Biomedical Research
Institute, Ilwon-Dong, Kangnam-Gu, Seoul, Korea; * au-thor for correspondence: fax 82-2-3410-2719; e-mail [email protected])
UDP-glucuronosyltransferase 1A1 (UGT1A1) is the key enzyme for bilirubin conjugation. Defects in this enzyme can cause a nonhemolytic unconjugated hyperbiliru-binemia, such as Crigler–Najjar syndrome type 1 (CN1)
and 2 (CN2) and Gilbert syndrome (GS). In 1991, the cDNA of the human UGT1A1 gene was cloned, and this led to the identification of genetic defects in patients with CN1, CN2, and GS (1–3 ). It was shown that homozy-gous or compound heterozyhomozy-gous mutations of the UGT1A1 gene can lead to these inheritable unconjugated hyperbilirubinemias, and⬎30 variants have been identi-fied (4, 5 ).
In GS, a TATAA box variant [A(TA)6TAA⬎A(TA)7TAA]
in the promoter region of the UGT1A1 gene has been reported in Caucasian populations, and several polymor-phisms in the coding region, including 211G⬎A (G71R), have been reported to have similar associations with GS in Japanese populations (6 – 8 ). Recently, Sugatani et al. (9 ) identified a T-to-G substitution in the phenobarbital-responsive enhancer module 3279 bp upstream from the UGT1A1 gene. They suggested that the⫺3279T⬎G poly-morphism could be another risk factor for the develop-ment of mild hyperbilirubinemia
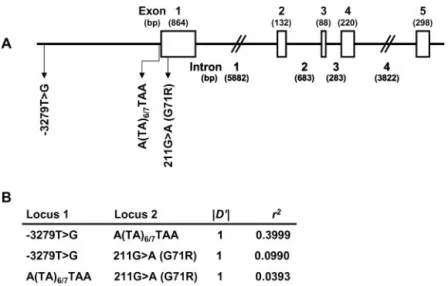
Presumably, different combinations of the polymor-phisms (haplotypes) in the UGT1A1 gene associated with GS or mild hyperbilirubinemia might produce a variety of serum total bilirubin (T-Bil) concentrations. Because these polymorphisms in the UGT1A1 gene lie in a relatively small region (Fig. 1A), a certain extent of linkage disequi-librium (LD) among these polymorphisms is expected. Therefore, haplotype analysis is more reasonable than association analysis using any single polymorphism to reveal the genetic background of an increased serum T-Bil concentration. We analyzed the haplotype structure of the UGT1A1 gene and investigated its relationship to the serum T-Bil concentration in healthy Korean males.
The study participants were 324 healthy Korean males [mean (SD) age, 49.8 (5.4) years] randomly selected from the registry for routine health checks at Samsung Medical Center in Seoul, Korea. We restricted the study partici-pants to males because the prevalence of unconjugated hyperbilirubinemia is higher in men than in women because of the lower rate of daily bilirubin production or other unidentified factors in females (10, 11 ) and thus the genetic influence on the bilirubin concentration might be
more evident in men. None had a history of hepatic or hematologic disorders such as anemia, excessive alcohol intake, or chronic use of medications or narcotics. In-formed consent was obtained from all participants, and the Institutional Review Board of the Samsung Medical Center approved the study protocol. Serum samples were collected from each participant in the morning after overnight fasting. The serum T-Bil concentration was measured by the diazo method (Daiichi Pure Chemicals) with the Hitachi 747 system (Hitachi) at least twice with a ⬎1-month interval to provide a mean value for each participant. The mean values were used in all statistical analyses.
Two promoter regions containing the⫺3279T⬎G poly-morphism and the TATAA box, and a part of exon 1 containing the 211G⬎A polymorphism of the UGT1A1 gene were amplified and sequenced with use of appro-priate primers, as given in the Data Supplement that accompanies the online version of this Technical Brief (available at http://www.clinchem.org/content/vol49/ issue12/). The differences in the serum T-Bil concentra-tion among the subgroups according to the UGT1A1 alleles or haplotypes were tested by ANOVA. The influ-ence of smoking status, polymorphisms, and haplotypes of the UGT1A1 gene on serum T-Bil was also estimated by the GLM procedure incorporated in the SAS System for Windows (SAS Institute Inc.). The Hardy–Weinberg equi-librium was tested with Arlequin software (12 ). Multisite haplotypes and their frequencies were estimated with use of SAS Genetics software (SAS Institute Inc.), and the assignment of haplotypes to each individual was per-formed with the PHASE program (13 ). Pairwise LD was estimated as D, D⬘, and r2(14 ). These LD coefficients were
calculated with use of the SAS Genetics software. The mean (SD) serum T-Bil concentration in the total group of participants was 16.3 (5.9)mol/L [0.95 (0.34) mg/dL]. When we investigated the association of smok-ing with serum T-Bil concentrations, we observed a sig-nificant difference among groups by smoking status (P⫽ 0.0058, ANOVA). Current smokers had lower serum T-Bil concentrations [14.3 (5.3)mol/L; n ⫽ 71] compared with
Fig. 1. Schematic presentation of the UGT1A1 gene (A), and LD coefficients (B).
(A), exact sizes of exons (open boxes) and introns are based on the Ensenmbl transcript ENST00000330771 (http://www.ensembl. org). Locations of three common polymorphisms are indicated by
arrows. (B), Lewontin’s coefficient (D⬘) and correlation coefficient
(r2) between each pair of the three polymorphisms.
never smokers [17.9 (6.6) mol/L; n ⫽ 45], and former smokers had serum T-Bil concentrations [16.8 (5.8) mol/L; n ⫽ 155] between those of current smokers and never smokers. Smoking status was estimated to explain ⬃3.8% of the variation in serum T-Bil concentrations.
The genotype frequencies of all three polymorphisms were in Hardy–Weinberg equilibrium, and the frequen-cies of the ⫺3279G, (TA)7, and 211A alleles were
calcu-lated as 0.267, 0.127, and 0.213, respectively. As shown in the table in the online Data Supplement, the mean serum T-Bil concentrations in homozygous carriers of the ⫺3279G, (TA)7, or 211A allele were significantly higher
than those in heterozygous carriers or homozygous car-riers of wild-type alleles (P ⬍0.0001). Among the three polymorphisms, homozygous carriers of (TA)7 showed
the highest mean serum T-Bil concentration [33.2 (4.1) mol/L], followed by homozygous carriers of 211A [24.2 (8.3) mol/L] and ⫺3279G [23.7 (6.2) mol/L]. The variabilities in serum T-Bil explained by the⫺3279T⬎G, (TA)6/7, and 211G⬎A polymorphisms were ⬃15.1%
(P ⬍0.0001), 28.1% (P ⬍0.0001), and 12.9% (P ⬍0.0001), respectively.
A likelihood ratio test using Arlequin software (12 ) detected significant pairwise LD with D⬘ values of 1.0 between all pairs of the three polymorphisms (P⬍0.0001; Fig. 1B). The highest correlation was observed between ⫺3279T⬎G and (TA)6/7polymorphisms (r2⫽ 0.3999; Fig.
1B). Multisite haplotype inference revealed that the par-ticipants had four of eight possible haplotypes: 3279T-(TA)6-211G (ht1), 3279T-(TA)6-211A (ht2), 3279G-(TA)6
-211G (ht3), and 3279G-(TA)7-211G (ht4). ht1 was the most
common with an estimated frequency of 0.5201 [95% confidence interval (CI), 0.4816 – 0.5586], followed by ht2 (0.2129; 95% CI, 0.1814 – 0.2445), ht3 (0.1404; 95% CI, 0.1137– 0.1672), and ht4 (0.1265; 95% CI, 0.1009 – 0.1521).
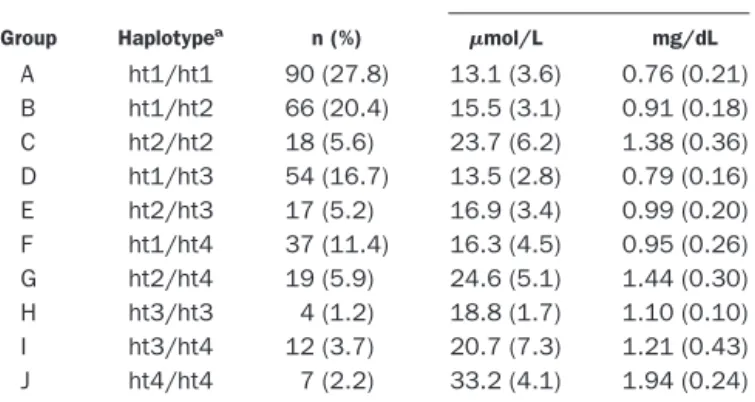
When the participants were stratified into 10 groups according to their UGT1A1 haplotypes, we observed significant differences in the mean serum T-Bil concentra-tion among the groups (P⫽ 0.0001; Table 1). The lowest concentration was observed in group A [ht1/ht1; 13.1 (3.6) mol/L], whereas the highest concentration was observed in group J [ht4/ht4; 33.2 (4.1) mol/L]. Ho-mozygous as well as compound heterozygous carriers of the variant haplotypes (ht2, ht3, or ht4) had increased serum T-Bil concentrations compared with homozygous or heterozygous carriers of the wild haplotype (ht1). Approximately 61.4% and 53.5% of the variability in serum T-Bil concentrations could be explained by the UGT1A1 haplotype with or without consideration of smoking status, respectively.
Multisite haplotype inference revealed that our study population had only four of eight possible haplotypes. The four missing haplotypes, 3279T-(TA)7-211G,
3279T-(TA)7-211A, 3279G-(TA)6-211A, and 3279G-(TA)7-211A,
suggest that ⫺3279T plus (TA)7 and (TA)7 plus 211A
alleles never exist on the same chromosome, at least in a Korean population. From the above results, we also suggest that a transition of G to A at nucleotide 211 in exon 1 of the UGT1A1 gene would form the ht2 haplotype,
whereas a transversion of T to G at nucleotide⫺3279 in the promoter region of the UGT1A1 gene would form the ht3 haplotype. In addition, ht4 could be the result of an introduction of an extra (TA) repeat to the ht3.
Disclosure of the molecular genetic basis of reduced expression of UGT1A1 is important not only for under-standing the molecular pathophysiology of increased se-rum T-Bil concentrations in GS but also for predicting severe toxicity by irinotecan in cancer patients (15, 16 ). In addition, increased serum T-Bil concentrations have been associated with a low risk of coronary artery disease (17, 18 ). To reveal the genetic background of an increased serum T-Bil concentration, haplotype analysis is more reasonable than association analysis using any single polymorphism because of tight LD among polymor-phisms in the UGT1A1 gene.
In summary, we demonstrated that there is complete LD among three common polymorphisms of the UGT1A1 gene in a male Korean population. In addition, we could unequivocally construct haplotypes for the UGT1A1 gene, which were revealed to be significantly associated with the serum T-Bil concentration. However, there are two major limitations in the present study. One is that the study population comprised only Korean males and thus the results cannot be freely applied to other populations, and the other is that only three common polymorphisms were included in the analysis. Nevertheless, to the best of our knowledge, this is one of the first studies to analyze the haplotype structure of the UGT1A1 gene including both promoter and coding regions and to assess the haplotype–phenotype correlation between the UGT1A1 gene and the serum T-Bil concentration.
This work was supported by National Research Labora-tory Grants from the Korea Institute of Science & Tech-nology Evaluation and Planning, Korea.
Table 1. Haplotype groups and T-Bil concentrations based on different combinations of three polymorphisms of the
UGT1A1 gene in 324 healthy Korean males.
Group Haplotypea n (%) Mean (SD) T-Bilb mol/L mg/dL A ht1/ht1 90 (27.8) 13.1 (3.6) 0.76 (0.21) B ht1/ht2 66 (20.4) 15.5 (3.1) 0.91 (0.18) C ht2/ht2 18 (5.6) 23.7 (6.2) 1.38 (0.36) D ht1/ht3 54 (16.7) 13.5 (2.8) 0.79 (0.16) E ht2/ht3 17 (5.2) 16.9 (3.4) 0.99 (0.20) F ht1/ht4 37 (11.4) 16.3 (4.5) 0.95 (0.26) G ht2/ht4 19 (5.9) 24.6 (5.1) 1.44 (0.30) H ht3/ht3 4 (1.2) 18.8 (1.7) 1.10 (0.10) I ht3/ht4 12 (3.7) 20.7 (7.3) 1.21 (0.43) J ht4/ht4 7 (2.2) 33.2 (4.1) 1.94 (0.24) aht1, 3279T-(TA)
6-211G; ht2, 3279T-(TA)6-211A; ht3, 3279G-(TA)6-211G; ht4, 3279G-(TA)7-211G.
bThere were significant differences in concentrations among the genotype
groups (P⬍0.0001, ANOVA).
References
1. Ritter JK, Crawford JM, Owens IS. Cloning of two human liver bilirubin UDP-glucuronosyltransferase cDNAs with expression in COS-1 cells. J Biol Chem 1991;266:1043–7.
2. Bosma PJ, Chowdhury JR, Huang TJ, Lahiri P, Elferink RP, Van Es HH, et al. Mechanisms of inherited deficiencies of multiple UDP-glucuronosyltrans-ferase isoforms in two patients with Crigler-Najjar syndrome, type I. FASEB J 1992;6:2859 – 63.
3. Aono S, Yamada Y, Keino H, Hanada N, Nakagawa T, Sasaoka Y, et al. Identification of defect in the genes for bilirubin UDP-glucuronosyl-trans-ferase in a patient with Crigler-Najjar syndrome type II. Biochem Biophys Res Commun 1993;197:1239 – 44.
4. Tukey RH, Strassburg CP. Human UDP-glucuronosyltransferases: metabo-lism, expression, and disease. Annu Rev Pharmacol Toxicol 2000;40:581– 616.
5. Kadakol A, Ghosh SS, Sappal BS, Sharma G, Chowdhury JR, Chowdhury NR. Genetic lesions of bilirubin uridine-diphosphoglucuronate glucuronosyltrans-ferase (UGT1A1) causing Crigler-Najjar and Gilbert syndromes: correlation of genotype to phenotype. Hum Mutat 2000;16:297–306.
6. Aono S, Adachi Y, Uyama E, Yamada Y, Keino H, Nanno T, et al. Analysis of genes for bilirubin UDP-glucuronosyltransferase in Gilbert’s syndrome. Lan-cet 1995;345:958 –9.
7. Koiwai O, Nishizawa M, Hasada K, Aono S, Adachi Y, Mamiya N, et al. Gilbert’s syndrome is caused by a heterozygous missense mutation in the gene for bilirubin UDP-glucuronosyltransferase. Hum Mol Genet 1995;4: 1183– 6.
8. Soeda Y, Yamamoto K, Adachi Y, Hori T, Aono S, Koiwai O, et al. Predicted homozygous mis-sense mutation in Gilbert’s syndrome. Lancet 1995;346: 1494.
9. Sugatani J, Yamakawa K, Yoshinari K, Machida T, Takagi H, Mori M, et al. Identification of a defect in the UGT1A1 gene promoter and its association with hyperbilirubinemia. Biochem Biophys Res Commun 2002;292:492–7. 10. Rosenthal P, Pincus M, Fink D. Sex- and age-related differences in bilirubin
concentrations in serum. Clin Chem 1984;30:1380 –2.
11. Owens D, Evans J. Population studies on Gilbert’s syndrome. J Med Genet 1975;12:152– 6.
12. Schneider S, Roessli D, Excoffier L. Arlequin ver. 2.000: a software for population genetics data analysis [Computer Software]. Geneva, Switzer-land: Genetics and Biometry Laboratory, University of Geneva, 2000. 13. Stephens M, Smith NJ, Donnelly P. A new statistical method for haplotype
reconstruction from population data. Am J Hum Genet 2001;68:978 – 89. 14. Hedrick P. Genetics of populations, 2nd ed. Sudbury: Jones and Bartlett
Publishers, Inc., 2000:395– 402.
15. Ando Y, Saka H, Ando M, Sawa T, Muro K, Ueoka H, et al. Polymorphisms of UDP-glucuronosyltransferase gene and irinotecan toxicity: a pharmacoge-netic analysis. Cancer Res 2000;60:6921– 6.
16. Iyer L, King CD, Whitington PF, Green MD, Roy SK, Tephly TR, et al. Genetic predisposition to the metabolism of irinotecan (CPT-11). Role of uridine diphosphate glucuronosyltransferase isoform 1A1 in the glucuronidation of its active metabolite (SN-38) in human liver microsomes. J Clin Invest 1998;101:847–54.
17. Schwertner HA. Bilirubin concentration, UGT1A1*28 polymorphism, and coronary artery disease. Clin Chem 2003;49:1039 – 40.
18. Hunt SC, Kronenberg F, Eckfeldt JH, Hopkins PN, Myers RH, Heiss G. Association of plasma bilirubin with coronary heart disease and segregation of bilirubin as a major gene trait: the NHLBI family heart study. Atheroscle-rosis 2001;154:747–54.
19. Innocenti F, Grimsley C, Das S, Ramirez J, Cheng C, Kuttab-Boulos H, et al. Haplotype structure of the UDP-glucuronosyltransferase 1A1 promoter in different ethnic groups. Pharmacogenetics 2002;12:725–33.
20. Lampe JW, Bigler J, Horner NK, Potter JD. UDP-glucuronosyltransferase (UGT1A1*28 and UGT1A6*2) polymorphisms in Caucasians and Asians: relationships to serum bilirubin concentrations. Pharmacogenetics 1999;9: 341–9.
21. Beutler E, Gelbart T, Demina A. Racial variability in the UDP-glucuronosyl-transferase 1 (UGT1A1) promoter: a balanced polymorphism for regulation of bilirubin metabolism? Proc Natl Acad Sci U S A 1998;95:8170 – 4.
DOI: 10.1373/clinchem.2003.024174
Recombinant Human Intrinsic Factor Expressed in Plants Is Suitable for Use in Measurement of Vitamin B12, Mustafa Vakur Bor,1*Sergey N. Fedosov,2Niels B. Laursen,2,3 and Ebba Nexø1 (1Department of Clinical Biochemistry,
AKH; Aarhus University Hospital, DK-8000 Aarhus C, Denmark; 2The Protein Laboratory, Aarhus University,
DK-8000 Aarhus C, Denmark; 3Cobento Biotech A/S,
DK-8000 Aarhus C, Denmark; * address correspondence to this author at: Department of Clinical Biochemistry, AKH, University Hospital of Aarhus, Nørrebrogade 44, DK-8000 Aarhus C, Denmark; fax 45-89493060, e-mail [email protected])
Competitive binding approaches with use of specific binding proteins are the most commonly used methods to measure vitamin B12 in laboratory medicine. Various
binding proteins have been used in these methods, in-cluding intrinsic factor (IF), pooled human or chicken serum, transcobalamin (TC), and saliva (1, 2 ). The most widely used of these are non-human IF preparations, usually obtained from hog gastric mucosa. Numerous problems have been reported with their application, how-ever, including difficulty of purification, instability on storage, and variation in the binding capacity connected with changes in serum protein and vitamin B12
concen-trations (1, 2 ). If IF is not highly purified, it may contain haptocorrins (also called R proteins), which bind not only vitamin B12but also related metabolically inactive
com-pounds that may be present in the sample, thereby causing artificially increased vitamin B12results (1, 3 ).
To circumvent the problems associated with nonhuman IF, we recently expressed human IF in plants and ob-tained a product free of endogenous vitamin B12 and
contaminating vitamin B12-binding proteins (4 ). In the
current study, we examined the feasibility of using this recombinant human IF for measurement of vitamin B12
bound to TC.
Human IF was expressed in the recombinant plant Arabidopsis thaliana and purified as described previously (4 ). As a first step, recombinant human IF was coupled to magnetic beads (Dynabeads, M-280 Tosylactivated; DY-NAL) according to the protocol for ligand-binding appli-cations as recommended by the manufacturer. The beads from 1 mL of the standard suspension were washed three times in 0.2 mol/L phosphate-buffered saline, pH 7.4. The washed beads were mixed with 1 mL of recombinant human IF (0.5 g/L) and incubated for 24 h at 37 °C with gentle and continuous agitation. The beads were precipi-tated, 1 mol/L Tris (pH 7.5) was added to the pellet, and the incubation was then continued for 4 h. The treated beads were then washed five times with 2 mL of 0.05 mol/L Tris (pH 7.5)– 0.5 mol/L NaCl and suspended in this buffer.
Recombinant human IF coupled to magnetic beads was used for measurement of vitamin B12in the last step of the
Axis-Shield Holo-TC assay in place of the binding protein supplied with the assay. This step measures the vitamin B12bound to TC trapped by insolubilized antibodies (5 ).
The Axis-Shield Holo-TC assay was used to demonstrate