C O R O N A V I R U S
Immunophenotyping of COVID-19 and influenza
highlights the role of type I interferons in development
of severe COVID-19
Jeong Seok Lee1*, Seongwan Park2*, Hye Won Jeong3*, Jin Young Ahn4*, Seong Jin Choi1, Hoyoung Lee1, Baekgyu Choi2, Su Kyung Nam2, Moa Sa1,5, Ji-Soo Kwon1,6, Su Jin Jeong4, Heung Kyu Lee1,5, Sung Ho Park7, Su-Hyung Park1,5, Jun Yong Choi4†, Sung-Han Kim6†, Inkyung Jung2†, Eui-Cheol Shin1,5†
Although most severe acute respiratory syndrome coronavirus 2 (SARS-CoV-2)–infected individuals experience mild coronavirus disease 2019 (COVID-19), some patients suffer from severe COVID-19, which is accompanied by acute respiratory distress syndrome and systemic inflammation. To identify factors driving severe progression of COVID-19, we performed single-cell RNA sequencing using peripheral blood mononuclear cells (PBMCs) obtained from healthy donors, patients with mild or severe COVID-19, and patients with severe influenza. Patients with COVID-19 exhibited hyperinflammatory signatures across all types of cells among PBMCs, particularly up-regulation of the tumor necrosis factor/interleukin-1 (TNF/IL-1)–driven inflammatory response as compared with severe influenza. In classical monocytes from patients with severe COVID-19, type I interferon (IFN) response coexisted with the TNF/IL-1–driven inflammation, and this was not seen in patients with milder COVID-19. We documented type I IFN–driven inflammatory features in patients with severe influenza as well. On the basis of this, we propose that the type I IFN response plays a pivotal role in exacerbating inflammation in severe COVID-19.
INTRODUCTION
Currently, severe acute respiratory syndrome coronavirus 2 (SARS-CoV-2), which causes coronavirus disease 2019 (COVID-19), is spread-ing globally (1, 2), and the World Health Organization has declared it a pandemic. As of 2 June 2020, more than 6.1 million confirmed cases and more than 376,000 deaths have been reported worldwide (3).
SARS-CoV-2 infection usually results in a mild disease course with spontaneous resolution in the majority of infected individuals (4). However, some patients, particularly elderly patients, develop severe COVID-19 infection that requires intensive care with mechanical ventilation (4, 5). The mortality rate for COVID-19 in Wuhan, China is estimated to be 1.4% (5). Although this rate is lower than that of severe acute respiratory syndrome (SARS) and Middle East respiratory syndrome, which are caused by other human pathogenic corona-viruses (6), it is much higher than that of influenza, a common re-spiratory viral disease requiring hospitalization and intensive care in severe cases.
In severe cases of COVID-19, a hyperinflammatory response, also called a cytokine storm, has been observed and is suspected of causing the detrimental progression of COVID-19 (7). Circulating levels of proinflammatory cytokines, including tumor necrosis factor (TNF) and interleukin-6 (IL-6), are increased in severe cases (8). Gene expression
analyses have also shown that IL-1–related proinflammatory path-ways are highly up-regulated in severe cases (9). In a murine model of SARS-CoV infection, a delayed but considerable type I interferon (IFN-I) response promotes the accumulation of monocytes-macrophages and the production of proinflammatory cytokines, resulting in lethal pneumonia with vascular leakage and impaired virus-specific T cell responses (10).
Immune dysfunction is also observed in patients with COVID-19. In severe cases, the absolute number of T cells is reduced (8, 11), and the T cells exhibit functional exhaustion with the expression of in-hibitory receptors (12, 13). However, hyperactivation of T cells as reflected in the up-regulation of CD38, human leukocyte antigen (HLA)–DR, and cytotoxic molecules was also reported in a lethal case of COVID-19 (14). Immune dysfunction in patients with severe COVID-19 has been attributed to proinflammatory cytokines (15).
In the present study, we performed single-cell RNA sequencing (scRNA-seq) using peripheral blood mononuclear cells (PBMCs) to identify factors associated with the development of severe COVID-19 infection. By comparing COVID-19 and severe influenza, we report that the TNF/IL-1–driven inflammatory response was dominant in COVID-19 across all types of cells among PBMCs, whereas the up- regulation of various IFN-stimulated genes (ISGs) was prominent in severe influenza. When we compared the immune responses from patients with mild and severe COVID-19 infections, we found that classical monocytes from severe COVID-19 exhibit IFN-I–driven signatures in addition to TNF/IL-1–driven inflammation.
RESULTS
Single-cell transcriptomes of PBMCs from patients with COVID-19 and influenza
PBMCs were collected from healthy donors (n = 4), hospitalized patients with severe influenza (n = 5), and patients with COVID-19
1Graduate School of Medical Science and Engineering, Korea Advanced Institute of Science and Technology (KAIST), Daejeon 34141, Republic of Korea. 2Department of Biological Sciences, KAIST, Daejeon 34141, Republic of Korea. 3Department of Internal Medicine, Chungbuk National University College of Medicine, Cheongju 28644, Republic of Korea. 4Department of Internal Medicine, Severance Hospital, Yonsei University College of Medicine, Seoul 03722, Republic of Korea. 5The Center for Epidemic Preparedness, KAIST Institute, Daejeon 34141, Republic of Korea. 6 Depart-ment of Infectious Diseases, Asan Medical Center, University of Ulsan College of Medicine, Seoul 05505, Republic of Korea. 7School of Life Sciences, Ulsan National Institute of Science & Technology (UNIST), Ulsan 44919, Republic of Korea. *These authors contributed equally to this work.
†Corresponding author. Email: [email protected] (E.-C.S.); [email protected] (I.J.); [email protected] (S.-H.K.); [email protected] (J.Y.C.)
Copyright © 2020 The Authors, some rights reserved; exclusive licensee American Association for the Advancement of Science. No claim to original U.S. Government Works. Distributed under a Creative Commons Attribution License 4.0 (CC BY).
at KOREA ADVANCED INST OF SCI on August 5, 2020
http://immunology.sciencemag.org/
of varying clinical severity, including severe, mild, and asymptomatic (n = 8). PBMCs were obtained twice from three (the patients C3, C6, and C7) of the eight patients with COVID-19 at different time points during hospitalization. PBMC specimens from patients with COVID-19 were assigned to severe or mild COVID-19 groups ac-cording to the National Early Warning Score (NEWS; mild < 5, severe ≥ 5) evaluated on the day of whole blood sampling (16). In NEWS scoring, respiratory rate, oxygen saturation, oxygen supplement, body temperature, systolic blood pressure, heart rate, and consciousness were evaluated (16). Severe influenza was defined when hospitaliza-tion was required irrespective of NEWS score. Patients with severe influenza were enrolled from December 2015 to April 2016, before the emergence of COVID-19. The severe COVID-19 group was characterized by significantly lower lymphocyte count and higher serum level of C-reactive protein than the mild COVID-19 group on the day of blood sampling (fig. S1A). Multiplex real-time merase chain reaction (PCR) for N, RNA-dependent RNA poly-merase (RdRP), and E genes of SARS-CoV-2 was performed, and there was no statistical difference in Ct values for all three genes between two groups (fig. S1B). Demographic information is provided with experimental batch of scRNA-seq in table S1 and clinical data in tables S2 and S3.
Using the 10× Genomics scRNA-seq platform, we analyzed a total of 59,572 cells in all patients after filtering the data with stringent high quality, yielding a mean of 6900 unique molecular identifiers (UMIs) per cell and detecting 1900 genes per cell on average (table S4). The transcriptome profiles of biological replicates (PBMC specimens in the same group) were highly reproducible (fig. S1C), ensuring the high quality of the scRNA-seq data generated in this study.
To examine the host immune responses in a cell type–specific manner, we subjected 59,572 cells to t-distributed stochastic neighbor embedding (tSNE) based on highly variable genes using the Seurat package (17) and identified 22 different clusters unbiased by patients or experimental batches of scRNA-seq (Fig. 1A and fig. S1D). These clusters were assigned to 13 different cell types based on well-known marker genes and two uncategorized clusters (Fig. 1, B and C, and table S5). In downstream analysis, we only focused on 11 different immune cell types, including immunoglobulin G− (IgG−) B cell, IgG+
B cell, effector memory (EM)–like CD4+ T cell, non–EM-like CD4+
T cell, EM-like CD8+ T cell, non–EM-like CD8+ T cell, natural killer
(NK) cell, classical monocyte, intermediate monocyte, nonclassical monocyte, and dendritic cell (DC) after excluding platelets, red blood cells (RBCs), and two uncategorized clusters. The individual C8 (asymptomatic case) was also excluded due to a lack of repli-cates. In hierarchical clustering, most transcriptome profiles from the same cell type tended to cluster together, followed by disease groups, suggesting that both immune cell type and disease biology, rather than technical artifacts, are the main drivers of the variable im-mune transcriptome (fig. S1E).
As a feature of immunological changes, we investigated the relative proportions of immune cells among PBMCs in the disease groups compared with the healthy donor group (Fig. 1, D and E, and fig. S1F). Unlike the limited changes in mild COVID-19, significant changes were observed in both influenza and severe COVID-19 across mul-tiple cell types among PBMCs. In severe COVID-19, the proportion of classical monocytes significantly increased whereas those of DCs, nonclassical monocytes, intermediate monocytes, NK cells, EM-like CD8+ T cells, and EM-like CD4+ T cells significantly decreased (Fig. 1E).
In severe influenza, the proportion of classical monocytes
signifi-cantly increased whereas those of DCs, non–EM-like CD4+ T cells, EM-like CD4+ T cells, IgG+ B cells, and IgG− B cells significantly
de-creased. We validated the proportions of immune cell subsets from scRNA-seq by flow cytometry analysis. The relative proportions of total lymphocytes, B cells, CD4+ T cells, CD8+ T cells, NK cells, and total monocytes from scRNA-seq significantly correlated with those from flow cytometry analysis (fig. S1G).
Transcriptional signatures associated with COVID-19
To compare the effect of infection between diseases, we performed hierarchical clustering based on relative gene expression changes against the healthy donor group. Unexpectedly, all types of cells among PBMCs were clustered together according to the disease groups in-stead of cell types (Fig. 2A). Further investigation of the variable genes based on K-means clustering supported COVID-19–specific up- or down-regulated gene expression patterns across all types of cells among PBMCs (fig. S2A). These results indicate that, in COVID-19, peripheral blood immune cells may be influenced by common in-flammatory mediators regardless of cell type. Despite distinct tran-scriptional signatures between COVID-19 and influenza, severe COVID-19 and influenza shared transcriptional signatures in all types of monocytes and DCs (black boxed region in Fig. 2A), possibly re-flecting common mechanisms underlying the innate immune responses in severe influenza and severe COVID-19.
Next, we sought to identify relevant biological functions in disease- specific up- or down-regulated genes in terms of the Gene Ontology (GO) biological pathways. First, we combined both mild and severe COVID-19 as a COVID-19 group and identified disease- specific changes in genes for each cell type compared with the healthy donor group using model-based analysis of single-cell transcriptomics (MAST) (18). NFKB1, NFKB2, IRF1, and CXCR3 were specifically up-regulated in COVID-19, and CXCL10, STAT1, TLR4, and genes for class II HLA and immunoproteasome subunits were specifically up-regulated in influenza (table S6). TNF, TGFB1, IL1B, and IFNG were commonly up-regulated. When we directly compared COVID-19 and influenza, NFKB1, NFKB2, and TNF were up-regulated in COVID-19, whereas STAT1, TLR4, and genes for immunoprotea-some subunits were up-regulated in influenza. For each group of differentially expressed genes (DEGs), we identified the top 10 en-riched GO biological pathways and collected them to demonstrate
P value enrichment in each group of DEGs (Fig. 2B). Both distinct
and common biological functions were identified as illustrated by inflammatory response genes being highly active in both COVID-19 and influenza, but genes for transcription factors, including inflam-matory factors (i.e., NFKB1/2 and STAT4), were up-regulated in COVID-19. In contrast, a limited response in genes associated with the IFN-I and IFN-II signaling pathways, T cell receptor pathways, and adaptive immune response was observed in COVID-19 compared with influenza. Such disease-specific gene expression patterns were exemplified at single-cell resolution by GBP1 (IFN-–mediated sig-naling pathway) being specifically up-regulated in influenza, CREM (positive regulation of transcription) being specifically up-regulated in COVID-19, and CCL3 (inflammatory response) being commonly up-regulated (Fig. 2C and table S7).
We expanded our analysis in a cell type–specific manner by con-ducting weighted gene correlation network analysis (WGCNA) (19) for the collected genes associated with Fig. 2B. We identified several modular expression patterns (Fig. 2D and table S8). In the COVID-19
group, NFKB1/2, JUN, and TNF were modularized in CD8+ T and
at KOREA ADVANCED INST OF SCI on August 5, 2020
http://immunology.sciencemag.org/
NK cells (G6 and G7 in Fig. 2D), and IL1B, NFKBID, and OSM were modularized in all types of monocytes and DCs (G3 in Fig. 2D). In the influenza group, GBP1, TAP1, STAT1, IFITM3, OAS1, IRF3, and IFNG were modularized in all types of T cells and NK cells
(G2 in Fig. 2D), and CXCL10 and TLR4 were modularized in all types of monocytes and DCs (G5 and part of G6 in Fig. 2D). Con-sistently, the DEGs between COVID-19 and influenza were domi-nant in CD8+ T cells and all types of monocytes (fig. S2B).
B cell, IgG− B cell, IgG+ CD4+ T cell, EM-like CD4+ T cell, non–EM-like CD8+ T cell, non–EM-like CD8+ T cell, EM-like NK cell Monocyte, classical Monocyte, intermediate Disease Cell type Monocyte, nonclassical Uncategorized 1 DC Uncategorized 2 RBC Platelet High Low Normalized expression A C FLU HD
COVID-19 (asymptomatic case)
COVID-19 (mild) COVID-19 (severe)
COVID-19 FLU HD Mild Severe 0.25 0.50 0.75 1.00 Pr opor
tion of each cell type
0.00 D tSNE_1 tSNE_2 tSNE_1 tSNE_2 tSNE_1 tSNE_2 B CD3E CD4 CCR7 CD8A E
NCAM1 CD14 FCGR3A NR4A1
CD19 FCER1A PPBP HBB DC Monocyte, nonclassical Monocyte, intermediate Monocyte, classical NK cell CD8+ T cell, non–EM-like CD8+ T cell, EM-like CD4+ T cell, non–EM-like CD4+ T cell, EM-like B cell, IgG+ B cell, IgG−
Mild Severe FLU
* ** * *** *** ** ** ** * *** * * −4 0 4 −4 0 4 −4 0 4
Log2(relative propotion of cell type
disease/HD)
*
Fig. 1. Single-cell transcriptomes of PBMCs from COVID-19 and influenza patients. (A) tSNE projections of 59,572 PBMCs from healthy donors (HDs) (four samples,
17,590 cells), patients with severe influenza (FLU) (five samples, 10,519 cells), patients with COVID-19 (asymptomatic: one sample, 4425 cells; mild COVID-19: four samples, 16,742 cells; severe COVID-19: six samples, 10,296 cells) colored by group information. (B) Normalized expression of known marker genes on a tSNE plot. (C) tSNE plot colored by annotated cell types. (D) Proportion of cell types in each group excluding Uncategorized 1, Uncategorized 2, RBC, and platelet. The colors indicate cell type information. (E) Boxplots showing the fold enrichment in cell type proportions from patients with mild COVID-19 (n = 4), severe COVID-19 (n = 6), and FLU (n = 5) com-pared with the HD group (mild COVID-19 versus HD: n = 16; severe COVID-19 versus HD: n = 24; FLU versus HD: n = 20). For the boxplots, the box represents the interquar-tile range (IQR), and the whiskers correspond to the highest and lowest points within 1.5 × IQR. Uncategorized 1 (relatively high UMIs per cell and the presence of multiple marker genes), Uncategorized 2 (B cell like and high expression of ribosomal protein genes), RBC, and platelet were excluded. Two-sided KS tests were conducted for each cell type between the disease and HD groups. *P < 0.05, **P < 0.01, and ***P < 0.001.
at KOREA ADVANCED INST OF SCI on August 5, 2020
http://immunology.sciencemag.org/
Distinct subpopulations of CD8+ T cells in COVID-19 and influenza
To uncover disease-specific transcriptional signatures in CD8+ T cells,
we performed subclustering analysis from EM-like and non–EM-like CD8+ T cell clusters using Seurat (17). Each disease group
spe-cifically enriched subclusters compared with the two other groups
were identified in the non–EM-like CD8+ T cell cluster (Fig. 3A). Of
the six subclusters from the non–EM-like CD8+ T cell cluster,
clus-ter 1 and clusclus-ter 3 were significantly enriched in the influenza and COVID-19 groups, respectively (Fig. 3, B and C, and fig. S3A). Clus-ters with the high expression of PPBP, a marker of platelets, were excluded in following analysis (e.g., cluster 6 in fig. S3A). Up-regulated
Fig. 2. Immune landscape of COVID-19. (A) Hierarchical
clustering using the PCC of a normalized transcriptome between diseases in cell type resolution (n = 33). The color intensity of the heatmap in-dicates the PCC values. The color bars above the heatmap indicate the cell type and dis-ease group. The black box indicates the cell types that highly correlate between the severe COVID-19 and FLU groups. (B) Illustration of the enrichment P values for the select GO biological pathways (n = 49) of DEGs in COVID-19 and FLU patients (left, six col-umns: DEGs for COVID-19 and FLU groups compared with HD; right, two columns: DEGs between COVID-19 and FLU groups). MHC, major histocom-patibility complex. (C) tSNE plot of representative gene expression patterns for GBP1 (FLU specific), CREM (COVID-19 specific), and CCL3 (COVID-19/ FLU common). (D) Top: Den-drogram from WGCNA anal-ysis performed using relative normalized gene expression between the COVID-19 and FLU groups for the genes be-longing to the select biologi-cal pathways in (B) (n = 316). Bottom: Heat map of relative normalized gene expression between the COVID-19 and FLU groups. The color bar (left) indicates cell type information clustered by hierarchical clus-tering based on the PCC for relative normalized gene ex-pression. Modularized gene expression patterns by WGC-NA are shown together (G1,
n = 10; G2, n = 147; G3, n = 27;
G4, n = 17; G5, n = 12; G6,
n = 64; G7, n = 34; G8, n = 5).
A B
GO_Biological pathway (DAVID)
COVID-19 up Low High FLU up Common up COVID-19 down FLU down Common down Compare to HD COVID-19 up COVID-19 down −Log10(P value) C D B cell, IgG− B cell, IgG+ CD4+ T cell, EM-like CD4+ T cell, non–EM-like CD8+ T cell, EM-like CD8+ T cell, non–EM-like NK cell Monocyte, classical Monocyte, intermediate Monocyte, nonclassical DC Cell type B cell, IgG− B cell, IgG+ CD4+ T cell, EM-like CD4+ T cell, non–EM-like CD8+ T cell, EM-like CD8+ T cell, non–EM-like NK cell Monocyte, classical Monocyte, intermediate Monocyte, nonclassical DC Cell type Cell type
Relative normalized expression
Log2(COVID-19/FLU) −3 0 3 disease Cell type FLU Disease COVID-19 (mild) COVID-19 (severe) CREM GBP1 HD CCL3 COVI D-19 FLU tSNE_1 tSNE_2 0 2 4 6 8 1 −1 PCC NFKB2NFKBIB NFKB1 JUN CXCR3 COVID-19 FLU NFKBID VEGF A PTX3 TLR4 CXCL10FCGR1B
OAS1PSMA4 GBP1ACTR3TAP1STAT1IRF3 TGFB1 CXTNFCR4 TNFAIP3 HLA-DRB5
OSM
IFITM3IFI6 IFITM2IFNG IL1B
G1 G2 G3 G4 G5 G6 G7 G8
FLU COVID-19
Type I interferon signaling pathway Positive regulation of T cell proliferation Peptide antigen assembly with MHC class II protein complex Antigen processing of exogenous peptide antigen via MHC class II antigen processing and presentation
Antigen processing of peptide or polysaccharide antigen via MHC class II Regulation of translational initiation
Ribosomal large subunit assembly Cytoplasmic translation rRNA processing Translation Viral transcription
Nuclear-transcribed mRNA catabolic process, nonsense-mediated decay SRP-dependent cotranslational protein targeting to membrane Translational initiation
Regulation of cell cycle Platelet aggregation Leukocyte migration Muscle contraction Regulation of immune response Cortical actin cytoskeleton organization T cell costimulation Platelet degranulation
Lipopolysaccharide-mediated signaling pathway Cellular response to lipopolysaccharide Apoptotic process
Positive regulation of nitric oxide biosynthetic process Positive regulation of inflammatory response Cellular response to tumor necrosis factor Neutrophil chemotaxis
Wnt signaling pathway, planar cell polarity pathway Cell-cell adhesion
Adaptive immune response
Tumor necrosis factor−mediated signaling pathway Movement of cell or subcellular component Innate immune response T cell receptor signaling pathway Interferon-γ−mediated signaling pathway
Antigen processing of exogenous peptide antigen via MHC class I, TAP-dependent Regulation of cell proliferation
mRNA transcription from RNA polymerase II promoter Negative regulation of transcription, DNA-templated Transcription, DNA-templated
Negative regulation of apoptotic process Response to lipopolysaccharide Immune response Inflammatory response
Negative regulation of transcription from RNA polymerase II promoter Positive regulation of transcription from RNA polymerase II promoter
Compare to FLU
*
at KOREA ADVANCED INST OF SCI on August 5, 2020
http://immunology.sciencemag.org/
genes in cluster 1 and cluster 3 were associated with previously de-fined gene sets for “influenza A virus infection” and “SARS-CoV infection,” respectively (fig. S3B) (20). We also found that the cluster 3–specific up-regulated genes reflect activation of immune response, including CD27, RGS1, CCL5, SELL, and RGS10 (fig. S3C and table S9). Protein interaction network analysis of selected top 30 up- regulated genes in each cluster based on STRING v11 (21) revealed the up-regulation of PRF1, GNLY, GZMB, and GZMH in cluster 1 and the up-regulation of GZMK, GZMA, CXCR3, and CCL5 in cluster 3
(Fig. 3D, green). STAT1, TAP1, PSMB9, and PSME2, which are up-regulated preferentially by IFN-, were overexpressed only in influenza-specific cluster 1 (Fig. 3D, blue). We validated these data by intracellular staining for granzyme B and phorbol 12-myristate 13-acetate (PMA)/ionomycin-stimulated intracellular cytokine stain-ing for IFN-. The percentages of granzyme B+ and IFN-+ cells
among CD8+ T cells were significantly higher in the influenza group
than in the COVID-19 group (fig. S3D). Of the seven representative GO biological pathways for the proinflammatory and IFN responses,
A B C tSNE_1 tSNE_2 Cluster 1 2 3 4 5 6 ** * 0.2 0.1 0.3 FLU COVID-19 HD HD FLU COVID-19 D E 0.6 0.4 0.2 ** ** 1 2 3 4 5 6 Cluster 1 Cluster 3 Cluster 1 PRF1 GNLY GZMB GZMH STAT1 TAP1 PSMB9 PSME2 GZMK GZMA CXCR3 CCL5 Cluster 3 Gene Ontology biological pathway
0 2 4 6
Response to interferon-γ Response to interferon-β Response to interferon-α Type I interferon signaling pathway Cellular response to type I interferon Cellular response to interleukin-1 Cellular response to tumor necrosis factor
–Log10(P value) Pr opor tion of cells in cluster 1 Pr opor tion of cells in cluster 3 FLU COVID-19 HD
Fig. 3. Subpopulation analysis of CD8+ T cells. (A) tSNE plot of the non–EM-like CD8+ T cell subpopulations in all groups (left, n = 6253), COVID-19 (top right, n = 2653), FLU (middle right, n = 1452), and HD (bottom right, n = 2148) colored by cluster information. (B and C) Boxplots showing the proportion of individual subclusters from the non–EM-like CD8+ T cell cluster within each group (COVID-19, n = 10; FLU, n = 5; HD, n = 4). The proportions follow normal distribution as tested by the Shapiro-Wilk nor-mality test except the proportion of cluster 3 in the COVID-19 group (P = 0.04). Cluster 1 and cluster 3 were highly enriched in the FLU and COVID-19 group, respectively. Two-sided Welch’s t test P values were 4.4 × 10⁻³ between COVID-19 and FLU in cluster 1, 3.5 × 10⁻² between FLU and HD donor in cluster 1, 8.6 × 10⁻³ between COVID-19 and FLU in cluster 3, and 5.8 × 10⁻³ between COVID-19 and HD in cluster 3. *P < 0.05 and **P < 0.01. (D) STRING analysis using the top 30 up-regulated genes in cluster 1 (left) and cluster 3 (right). (E) Bar plots showing enrichment P values of eight representative GO biological pathways for proinflammation and IFN in cluster 1– or cluster 3–specific up-regulated genes (cluster 1, n = 66; cluster 3, n = 183).
at KOREA ADVANCED INST OF SCI on August 5, 2020
http://immunology.sciencemag.org/
pathways for responses to I and IFN-II were more associated with influenza- specific cluster 1, whereas pathways for the response to TNF or IL-1 were more prominent in COVID-19–specific cluster 3 (Fig. 3E).
Transcriptional signatures of classical monocytes in COVID-19
We performed subclustering analysis from all three types of monocyte clusters to find COVID-19–specific subclusters. However, there was no COVID-19– specifically enriched subcluster (fig. S4, A and B). Next, we further focused on classical monocytes considering their crucial roles for inflammatory responses. We investigated DEGs between influenza and COVID-19 to seek COVID-19– specific transcriptional signatures in clas-sical monocytes (Fig. 4A). TNF and IL1B, major genes in the inflammatory re-sponse, were identified as COVID-19– specific and commonly up-regulated genes, respectively. To better characterize the transcriptional signatures in classical mono-cytes, we performed K-means clustering of up-regulated genes in at least one dis-ease group compared with the healthy donor group. We identified five different clusters of up-regulation (Fig. 4B and table S10): Genes in cluster 1 are com-monly up-regulated in all disease groups, cluster 2 is influenza specific, cluster 3 is associated with mild/severe COVID-19, cluster 4 is associated with influenza and severe COVID-19, and cluster 5 is severe COVID-19 specific.
We examined each cluster-specific genes by gene set enrichment analysis (GSEA) using cytokine-responsive gene sets originated from each cytokine- treated cells (LINCS L1000 ligand per-turbation analysis in Enrichr) (22). COVID-19–specific cluster 3 genes were enriched by TNF/IL-1–responsive genes, whereas influenza-specific cluster 2 genes were enriched by IFN-I–responsive genes in addition to TNF/IL-1–responsive genes (Fig. 4C), indicating that the IFN-I response is dominant in influenza com-pared with COVID-19. We confirmed this result by analyzing cluster-specific genes with cytokine-responsive gene sets originated from other sources (Fig. 4D).
Unexpectedly, clusters 4 and 5 exhibited strong associations with IFN-I– responsive genes, in addition to TNF/IL-1–responsive genes (Fig. 4E), indicating that severe COVID-19 acquires IFN-I–responsive fea-tures in addition to TNF/IL-1–inflammatory feafea-tures.
IFN-I response in addition to TNF/IL-1 inflammatory response in severe COVID-19
Next, we directly compared classical monocytes between mild and severe COVID-19. When we analyzed DEGs, severe COVID-19 was
A
HD < FLU
DEGs n = 249 HD < COVID-19 (all)DEGs n = 181
149 100 81 CXCL8 IL1B JUNB NFKBIZ FOS OSM JUN PTX3 TNF NFKBID GBP1 IFI16 JAK3 PSMB9 TAP1 FLU COVID -19 (mild) COVID-19 (severe) C1. Common n = 12 n = 96 C3. Mild/severe common n = 143 Log2( disease/HD ) −2 −1 0 1 2
C4. FLU/severe common (up)
C5. Severe specific C2. FLU specific n = 218 n = 30 IL1B TAP1 IFIT3 OAS1 PSME2 JAK2 GBP2 XAF1 CDKN1A CD83 SAT1 OSM PTX3 TNF JUN JUND AHR NR4A1 NAMPT S100A8 S100A12 IL1R2 SOCS3 NFKBIA SELL ITGAM S100A9 TLR2 IFITM2 IL17RA IFI16 PSMB9 JAK3 IFI35 TLR4 ISG20 IFITM1 ISG15 B E –Log10(P value) C D Type I IFN (GSE26104) C2 C3 0 100 200 300 400 500 ** Co mb in ed sc or e TNF (GSE2638, GSE2639) C2 C3 0 100 200 300 400 500 –Log10(P value) C2 0 5 10 15 20 IL-17 IFN-α IL-1β TNF C3 0 5 10 15 20 C4 0 5 10 15 IL-17 IFN-α IL-1β TNF C5 0 5 10 15
Fig. 4. Transcriptome of classical monocytes in patients with COVID-19. (A) Venn diagram of DEGs in COVID-19
and FLU compared with HD. The representative genes are shown together. (B) K-means clustering of DEGs between all pairs of FLU, mild COVID-19, and severe COVID-19 (n = 499). The color indicates the relative gene expression be-tween the diseases and HD. The representative genes are shown together. (C) Bar plots showing the average − log10(P value) values in enrichment analysis using the perturbed genes of four different cell lines listed in L1000 LINCS for up-regulated genes in cluster 2 (C2, left) and cluster 3 (C3, right). Error bars indicate SD. (D) Combined enrichment scores were compared between C2 and C3 for the gene sets of the type I IFN response (left; GSE26104) and TNF response (right; GSE2638 and GSE2639). **P < 0.01. Each dot indicates an individual. (E) Bar plots showing the average −log10(P value) values in the enrichment analysis using the perturbed genes listed of four different cell lines in L1000 LINCS for up-regulated genes in cluster 4 (C4, left) and cluster 5 (C5, right). Error bars indicate SD (C and E).
at KOREA ADVANCED INST OF SCI on August 5, 2020
http://immunology.sciencemag.org/
characterized by up-regulation of various ISGs, including ISG15,
IFITM1/2/3, and ISG20 (Fig. 5A). Both TNF/IL-1–responsive genes
and IFN-I–responsive genes were enriched in severe COVID-19– specific up-regulated genes (Fig. 5B). We measured plasma concen-trations of TNF, IL-1, IL-6, IFN-, IFN-, and IL-18 in a larger cohort of patients with COVID-19. Among these cytokines, IL-6 and IL-18 were significantly increased in severe COVID-19 compared with mild COVID-19, whereas there was no difference in plasma concentrations of the other cytokines between the two groups (fig. S5A). These results indicate that cytokine-responsive gene signatures can-not be simply explained by a few cytokines because of overlapped effects of cytokines.
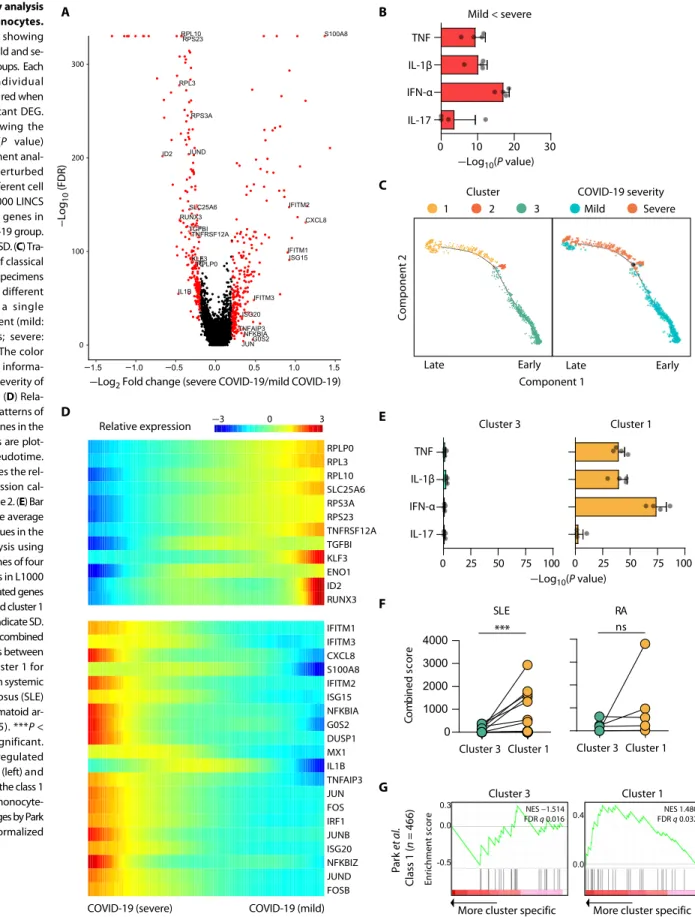
To further investigate the characteristics of severe COVID-19, we performed a trajectory analysis with Monocle 2 (23) using two internally well-controlled specimens (one severe and one mild) in which both PBMC samples were collected from a single patient (the individual C7) with COVID-19. Trajectory analysis aligned classical monocytes along the disease severity with cluster 1 and cluster 3 cor-responding to later and earlier pseudotime, respectively (Fig. 5C). Representative genes in cluster 1 were enriched in the severe stage and highly associated with the both IFN-I and TNF/IL-1–associated inflammatory response (Fig. 5D, fig. S5B, and table S11). GSEA con-firmed that both the IFN-I response and TNF/IL-1 inflammatory response were prominent in cluster 1 but not in cluster 3 (Fig. 5E). Cluster 1 exhibited a significantly higher association with a gene set from systemic lupus erythematosus, which is a representative in-flammatory disease with IFN-I features, than cluster 3 (Fig. 5F, left) but was not significantly associated with a gene set from rheuma-toid arthritis (Fig. 5F, right).
We obtained additional evidence of the IFN-I–potentiated TNF inflammatory response in severe COVID-19 by analyzing a gene module that is not responsive to IFN-I but associated with TNF- induced tolerance to TLR stimulation. Park et al. (24) previously demonstrated that TNF tolerizes TLR-induced gene expression in monocytes, although TNF itself is an inflammatory cytokine. They also showed that IFN-I induces a hyperinflammatory response by abolishing the tolerance effects of TNF and defined a gene module responsible for the IFN-I–potentiated TNF–nuclear factor B (NF-B) inflammatory response as “class 1” (24). This gene module was significantly enriched in cluster 1 but not in cluster 3 (Fig. 5G), which suggests that the IFN-I response may exacerbate hyper-inflammation by abolishing a negative feedback mechanism.
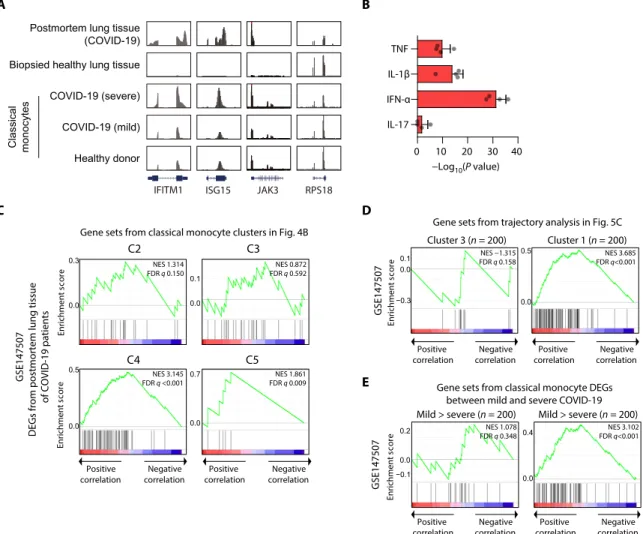
Validation of hyperinflammatory features combined with IFN-I response in lung tissues from a lethal case of COVID-19
Last, we validated IFN-I response and inflammatory features using bulk RNA-seq data obtained using postmortem lung tissues from patients with lethal COVID-19 (25). Although the analysis was lim-ited to only two patients without individual cell-type resolution, in genome browser, up-regulation of IFITM1, ISG15, and JAK3 and down-regulation of RPS18 were observed commonly in postmortem COVID-19 lung tissues and classical monocytes of severe COVID-19 (Fig. 6A). In the analysis with cytokine-responsive gene sets, both the IFN-I response and TNF/IL-1–inflammatory response were prominent in the lung tissues (Fig. 6B). DEGs in the lung tissues were significantly associated with cluster 4, which is commonly up-regulated in both influenza and severe COVID-19, and cluster 5, which is spe-cific to severe COVID-19 in Fig. 4B (Fig. 6C). These genes were also
significantly associated with the cluster 1 identified in the trajectory analysis but not with cluster 3 (Fig. 6D). When gene sets were de-fined by DEGs between mild and severe COVID-19, the DEGs in postmortem lung tissues were significantly associated with genes up-regulated specifically in severe COVID-19 (Fig. 6E).
DISCUSSION
Severe COVID-19 has been shown to be caused by a hyperinflam-matory response (7). In particular, inflamhyperinflam-matory cytokines secreted by classical monocytes and macrophages are considered to play a crucial role in severe progression of COVID-19 (26). In the current study, we confirmed the results from previous studies by showing that the TNF/IL-1 inflammatory response is dominant in COVID-19, although a small number of patients were enrolled. However, we also found that severe COVID-19 is accompanied by the IFN-I response in addition to the TNF/IL-1 response. These results indicate that the IFN-I response might contribute to the hyperinflammatory re-sponse by potentiating TNF/IL-1–driven inflammation in severe progression of COVID-19.
In the current study, we carried out scRNA-seq using PBMCs instead of specimens from the site of infection, e.g., lung tissues or bronchoalveolar lavage (BAL) fluids. However, hierarchical clustering based on relative changes to the healthy donor group showed that all types of cells among PBMCs were clustered together according to the disease groups as shown in Fig. 2A, indicating that there is disease-specific global impact across all types of cells among PBMCs. This finding suggests that peripheral blood immune cells are influ-enced by common inflammatory mediators regardless of cell type. However, we could not examine granulocytes in the current study because we used PBMCs, not whole blood samples, for scRNA-seq.
In transcriptome studies for cytokine responses, we often analyze cytokine-responsive genes rather than cytokine genes themselves. However, we cannot exactly specify responsible cytokine(s) from the list of up-regulated genes because of overlapped effects of cytokines. For example, up-regulation of NF-B–regulated genes can be driven by TNF, IL-1, or other cytokines, and up-regulation of IFN-responsive genes can be driven by IFN-I or other IFNs. In the current study, we designated the IFN-I response because many up-regulated IFN- responsive genes were typical ISGs.
Recently, Wilk et al. (27) also performed scRNA-seq using PBMCs from patients with COVID-19 and healthy controls. Similar to our study, they found IFN-I–driven inflammatory signatures in monocytes from patients with COVID-19. However, they did not find substantial expression of proinflammatory cytokine genes such as TNF, IL6, IL1B, CCL3, CCL4, and CXCL2 in peripheral mono-cytes from patients with COVID-19, whereas we detected the up-regulation of TNF, IL1B, CCL3, CCL4, and CXCL2 in the current study. Moreover, they found a developing neutrophil population in patients with COVID-19 that was not detected in our study. These discrepant results might be due to different platforms for scRNA-seq. Wilk et al. (27) used the Seq-Well platform, whereas we used the 10× Genomics platform that is more generally used. We also note that recent scRNA-seq analyses of COVID-19 sometimes lead to unre-lated or contradictory conclusions to each other despite the same platform (28, 29). Although it often occurs in unsupervised analysis of highly multidimensional data, more caution will be required in designing scRNA-seq analysis of COVID-19, including definition of the severity and sampling time points.
at KOREA ADVANCED INST OF SCI on August 5, 2020
http://immunology.sciencemag.org/
Fig. 5. Trajectory analysis of classical monocytes.
(A) Volcano plot showing DEGs between mild and se-vere COVID-19 groups. Each dot indicates individual gene, colored by red when a gene is significant DEG. (B) Bar plot showing the average −log10(P value) values in enrichment anal-ysis using the perturbed genes of four different cell lines listed in L1000 LINCS for up-regulated genes in the severe COVID-19 group. Error bars indicate SD. (C) Tra-jectory analysis of classical monocytes from specimens obtained at two different time points in a single COVID-19 patient (mild: C7-2, 1,197 cells; severe: C7-1, 631 cells). The color indicates cluster informa-tion (left) or the severity of COVID-19 (right). (D) Rela-tive expression patterns of representative genes in the trajectory analysis are plot-ted along the pseudotime. The color indicates the rel-ative gene expression cal-culated by Monocle 2. (E) Bar plots showing the average −log10(P value) values in the enrichment analysis using the perturbed genes of four different cell lines in L1000 LINCS for up-regulated genes in cluster 3 (left) and cluster 1 (right). Error bars indicate SD. (F) Comparison of combined enrichment scores between cluster 3 and cluster 1 for the gene sets from systemic lupus erythematosus (SLE) (n = 16) and rheumatoid ar-thritis (RA) (n = 5). ***P < 0.001; ns, not significant. (G) GSEA of up-regulated genes in cluster 3 (left) and cluster 1 (right) to the class 1 gene module of monocyte- derived macrophages by Park
et al. (24). NES, normalized
enrichment score.
at KOREA ADVANCED INST OF SCI on August 5, 2020
http://immunology.sciencemag.org/
Recently, Blanco-Melo et al. (25) examined the transcriptional response to SARS-CoV-2 in in vitro–infected cells, infected ferrets, and postmortem lung samples from patients with lethal COVID-19 and reported that IFN-I and IFN-III responses are attenuated. How-ever, we noted that the IFN-I signaling pathway and innate immune response genes were relatively up-regulated in postmortem lung samples from patients with lethal COVID-19 compared with SARS-CoV-2–infected ferrets in their paper. Given that SARS-CoV-2 in-duces only mild disease without severe progression in ferrets (30), we interpret that IFN-I response is up-regulated in severe COVID-19 (e.g., postmortem lung samples from patients with lethal COVID-19) but not in mild COVID-19 (e.g., SARS-CoV-2–infected ferrets). Se-vere COVID-19–specific signatures found in our current study were significantly enriched in the publically available data of postmortem lung tissues from the Blanco-Melo et al.’s study, although the analysis was limited to only two patients without individual cell type resolu-tion (Fig. 6). In a recent study, Zhou et al. (31) also found a robust
IFN-I response in addition to proinflammatory response in BAL fluid of patients with COVID-19. Moreover, up-regulation of IFN-I– responsive genes has been demonstrated in SARS-CoV-2–infected intestinal organoids (32).
Although IFN-I has direct antiviral activity, their immuno-pathological role was also reported previously (33). In particular, the detrimental role of the IFN-I response was elegantly demonstrated in a murine model of SARS (10). In SARS-CoV–infected BALB/c mice, the IFN-I response induced the accumulation of pathogenic inflammatory monocytes-macrophages and vascular leakage, lead-ing to death. It was proposed that a delayed but considerable IFN-I response is critical for the development of acute respiratory distress syndrome and increased lethality during pathogenic coronavirus infection (6, 34).
Currently, the management of patients with severe COVID-19 relies on intensive care and mechanical ventilation without a specific treatment because the pathogenic mechanisms of severe COVID-19
B A
Gene sets from trajectory analysis in Fig. 5C Cluster 3 (n = 200) Cluster 1 (n = 200)
Positive
correlation correlationNegative correlationPositive correlationNegative
D
Positive
correlation correlationNegative correlationPositive correlationNegative
Gene sets from classical monocyte DEGs between mild and severe COVID-19 Mild > severe (n = 200) Mild > severe (n = 200)
GSE147507 GSE147507 E C C2 C3 C4 C5
Gene sets from classical monocyte clusters in Fig. 4B
Positive
correlation correlationNegative correlationPositive correlationNegative
GSE147507
DEGs from postmortem lung tissue
of COVID-19 patients NES 1.314 FDR q 0.150 FDR q 0.592NES 0.872 NES 3.145 FDR q <0.001 FDR q 0.009NES 1.861 NES −1.315 FDR q 0.158 FDR q<0.001NES 3.685 NES 1.078 FDR q 0.348 FDR q<0.001NES 3.102 Postmortem lung tissue
(COVID-19) Biopsied healthy lung tissue COVID-19 (severe) Classical monocytes COVID-19 (mild) Healthy donor ISG15 IFITM1 JAK3 RPS18 Enrichment sc or e 0.0 −0.3 0.1 0.0 0.5 Enrichment sc or e 0.0 −0.1 0.2 0.0 0.4 Enrichment sc or e 0.0 0.3 Enrichment sc or e 0.0 0.5 0.0 0.7 0.0 0.1 −Log10(P value) 0 10 20 30 40 IL-17 IFN-α IL-1β TNF
Fig. 6. Validation of the combined IFN-I and inflammatory responses in the transcriptome of postmortem lung tissues from lethal COVID-19. (A) UCSC Genome
Browser snapshots of representative genes. (B) Bar plot showing the average −log10(P value) values from the enrichment analysis using the perturbed genes of four dif-ferent cell lines in L1000 LINCS for up-regulated genes (n = 386) in postmortem lung tissues compared with biopsied healthy lung tissue. Error bars indicate SD. (C) GSEA of significantly up- and down-regulated genes in postmortem lung tissues for gene sets originated from up-regulated genes in C2 (n = 96), C3 (n = 143), C4 (n = 218), and C5 (n = 30) of Fig. 4B. (D and E) GSEA of significantly up- and down-regulated genes in postmortem lung tissues for gene sets originated from the top 200 up-regulated genes in cluster 3 (left) and cluster 1 (right) from the trajectory analysis in Fig. 5C (D) and from gene sets originated from the top 200 up-regulated genes in classical monocytes of mild (left) and severe (right) COVID-19 (E).
at KOREA ADVANCED INST OF SCI on August 5, 2020
http://immunology.sciencemag.org/
have not yet been clearly elucidated. In the current study, we demonstrated that severe COVID-19 is characterized by TNF/IL-1–inflammatory features combined with the IFN-I response. In a murine model of SARS-CoV infection, timing of the IFN-I response is a critical factor determining outcomes of infection (6, 10). De-layed IFN-I response contributes to pathological inflammation, whereas early IFN-I response controls viral replication. Therefore, we propose that anti-inflammatory strategies targeting not only in-flammatory cytokines, including TNF, IL-1, and IL-6, but also patho-logical IFN-I response need to be investigated for the treatment of patients with severe COVID-19.
MATERIALS AND METHODS Patients
Patients diagnosed with COVID-19 were enrolled from Asan Med-ical Center, Severance Hospital, and Chungbuk National University Hospital. SARS-CoV-2 RNA was detected in patients’ nasopharyn-geal swab and sputum specimens by multiplex real-time reverse- transcriptase PCR using the Allplex 2019-nCoV Assay kit (Seegene, Seoul, Republic of Korea). In this assay, N, RdRP, and E genes of SARS-CoV-2 were amplified, and Ct values were obtained for each gene. SARS-CoV-2–specific antibodies were examined using the SARS-CoV-2 Neutralization Antibody Detection kit (GenScript, Piscataway, NJ) and were positive in all patients with COVID-19 in convalescent plasma samples or the last plasma sample in a lethal case. Hospitalized patients diagnosed with influenza A virus infection by a rapid antigen test of a nasopharyngeal swab were also enrolled from Asan Medical Center and Chungbuk National University Hospital from December 2015 to April 2016, before the emergence of COVID-19. Patients’ clinical features, laboratory findings, and chest radiographs were collected from their electronic medical records at each hospital. This study protocol was reviewed and ap-proved by the institutional review boards of all participating institu-tions. Written informed consent was obtained from all patients.
Single-cell RNA sequencing
PBMCs were isolated from peripheral venous blood via standard Ficoll-Paque (GE Healthcare, Uppsala, Sweden) density gradient centrifugation, frozen in freezing media, and stored in liquid nitro-gen until use. All samples showed a high viability of about 90% on average after thawing. Single-cell RNA-seq libraries were generated using the Chromium Single Cell 3′ Library & Gel Bead Kit v3 (10× Genomics, Pleasanton, CA) following the manufacturer’s instruc-tions. Briefly, thousands of cells were separated into nanoliter-scale droplets. In each droplet, complementary DNA (cDNA) was gener-ated through reverse transcription. As a result, a cell barcoding sequence and UMI were added to each cDNA molecule. Libraries were constructed and sequenced as a depth of approximately 50,000 reads per cell using the Nextseq 550 or Novaseq 6000 platform (Illumina, San Diego, CA).
Single-cell RNA-seq data processing
The sequenced data were demultiplexed using mkfastq (Cell Ranger 10× Genomics, v3.0.2) to generate fastq files. After demultiplexing, the reads were aligned to the human reference genome (GRCh38; 10× Cell Ranger reference GRCh38 v3.0.0), feature-barcode matrices were generated using the cellranger count and then aggregated by cellranger aggr using default parameters. The following analysis was
performed using Seurat R package v3.1.5 (17). After generating the feature-barcode matrix, we discarded cells that expressed <200 genes and genes not expressed in any cells. To exclude low-quality cells from our data, we filtered out the cells that express mitochondrial genes in >15% of their total gene expression as described in previous studies (29, 35, 36). Doublets were also excluded, which were dominant in the cluster “Uncategorized 1.” Although there was a high variability in the number of UMIs detected per cell, most of the cells (90.5%) were enriched in a reasonable range of the UMIs (1000 to 25,000), and 59% of cells with less than 1000 UMIs were platelet or RBC ex-cluded in downstream analysis. In each cell, the gene expression was normalized on the basis of the total read count and log transformed. To align the cells originating from different samples, 2000 highly variable genes from each sample were identified by the vst method in Seurat R package v3.1.5 (17). Using the canonical correlation analy-sis, we found anchors and aligned the samples based on the top 15 canonical correlation vectors. The aligned samples were scaled, and principal components analysis (PCA) was conducted. Last, the cells were clustered by unsupervised clustering (0.5 resolution) and visu-alized by tSNE using the top 15 principal components (PCs).
Cell type annotation through marker gene identification in each cluster
To identify marker genes, up-regulated genes in each cluster rela-tive to the other clusters were selected on the basis of the Wilcoxon rank sum test in Seurat’s implementation with >0.25 log fold change compared with the other clusters and a Bonferroni-adjusted P < 0.05 (table S4). By manual inspection, among the 22 different clus-ters, 20 were assigned to 11 known immune cell types, RBCs which are characterized by HBA1, HBA2, and HBB, and platelets. The clusters characterized by similar marker genes were manually com-bined as one cell type. The two remaining clusters were assigned to Uncategorized 1 and “Uncategorized 2” because they had no distinct features of known cell types. On the basis of the distribution of UMI counts, the cluster Uncategorized 1 was featured by relatively high UMIs per cell compared with other clusters and the presence of higher expression of multiple cell type marker genes. The cluster Uncat-egorized 2 was featured by a B cell–like signatures and high expression of ribosomal protein genes, not recommended to be further analyzed according to the 10× platform guideline. In these aspects, RBCs, platelets, Uncategorized 1, and Uncategorized 2 were excluded in downstream analysis.
Reproducibility of biological replicates
To check the reproducibility of biological replicates (individuals within a same group), we calculated the Spearman’s rank correlation coefficient for UMI counts that were merged according to each in-dividual. The correlation coefficients of all individual pairs within the same group were visualized by a boxplot (COVID-19, n = 45; FLU,
n = 10; HD, n = 6).
Hierarchical clustering of the transcriptomes at cell type resolution
In fig. S1E, to investigate the similarity of the transcriptomes be-tween cell types across diseases, we merged the UMI counts of each cell type according to healthy donor, influenza, mild COVID-19, and severe COVID-19. Next, the UMI counts for each gene were divided by the total UMI count in each cell type and multiplied by 100,000 as the normalized gene expression. On the basis of a median expression
at KOREA ADVANCED INST OF SCI on August 5, 2020
http://immunology.sciencemag.org/
value of >0.5, we calculated the relative changes in gene expression divided by the median value for each gene. Hierarchical clustering analysis was performed on the basis of the Pearson correlation coef-ficient (PCC) of the relative change in gene expression.
Hierarchical clustering of variable gene expression among disease groups at cell type resolution
In Fig. 2A and fig. S2A, to compare the highly variable gene expres-sion among mild and severe COVID-19 and influenza relative to healthy donors, the normalized gene expression used in fig. S1E was divided by the values in the healthy donor group. We selected the
highly variable genes in terms of the top 25% SD followed by log2
transformation (pseudocount = 1). In Fig. 2A, hierarchical cluster-ing analysis was performed on the basis of the PCCs of the selected highly variable genes. For fig. S2A, to investigate the expression pat-terns of the selected highly variable genes (n = 6052), K-means clus-tering (k = 50) was performed on the basis of Euclidean distance. We manually ordered the clusters and visualized them as a heatmap, re-vealing four distinct patterns: influenza specific (n = 1046), COVID-19 specific (n = 1215), influenza/COVID-19 common (n = 1483), and cell type specific (n = 2308).
Analysis of dynamic changes in cell type composition compared with healthy donors
To investigate the dynamic changes in cell type composition, we calculated the proportion of cell types in each individual. As a control, we calculated the relative variation in each cell type composition between all pairs of healthy donors. Similarly, for each disease group, we calculated the relative variation in each cell type by dividing the fraction of the cell type in individual patient by that of individual healthy donor. After log2 transformation, we conducted statistical
anal-ysis using the relative variation in composition between the control and disease groups using a two-sided Kolmogorov-Smirnov (KS) test.
Identification of DEGs using MAST
For any two transcriptome profiles, to identify DEGs, we used the MAST algorithm in Seurat’s implementation based on a Bonferroni- adjusted P < 0.05 and a log2 fold change > 0.25.
GO analysis for biological pathways
In Fig. 2B, the DEGs in COVID-19 and influenza compared with healthy donors or COVID-19 compared with influenza were iden-tified at cell type resolution. All DEGs were combined according to the disease groups for further analysis. The overlapping up- or down- regulated DEGs between COVID-19 and influenza compared with healthy donors were defined as “common up” or “common down.” The specific DEGs in COVID-19 or influenza were assigned as “COVID-19 up/down” or “FLU up/down,” respectively. In addition, COVID-19–specific up- or down-regulated genes compared with influenza were assigned as “COVID-19 > FLU” or “FLU > COVID-19,” respectively. The GO analysis was performed by DAVID. For each group of DEGs, the top 10 enriched GO biological pathways were selected, resulting in 49 unique GO biological pathways across all groups. The −log10(P values) are shown as a heatmap in Fig. 2B. WGCNA analysis to identify modular gene
expression patterns
The WGCNA was conducted with the genes listed in the top 10 GO biological pathways of “COVID-19 up,” “FLU up,” and Common
up defined in Fig. 2B. The normalized gene expression values of the genes in COVID-19 were divided by the values in influenza and log2
transformed (pseudocount = 1). We used default parameters with the exception of soft threshold = 10 and networkType = “signed” when we constructed a topological overlap matrix. The modular gene expression patterns were defined using cutreeDynamic with a minClusterSize of 5. We visualized the modular gene expres-sion pattern as a heatmap in which the cell types were ordered according to hierarchical clustering with the default parameters of hcluster in R.
Subclustering analysis
To find disease-specific subpopulations, each immune cell type was subjected to the subclustering analysis using Seurat. Briefly, the highly variable genes (n = 1000) were selected on the basis of vst and then scaled by ScaleData in Seurat with the vars.to.regress option to eliminate variation between individuals. The subpopulations were identified by FindClusters with default parameters, except resolu-tion (non–EM-like CD8+ T cells, 0.3; classical monocytes, 0.2); the inputs were the top eight PCs obtained from PCA of the scaled ex-pression of the highly variable genes. The subpopulations were vi-sualized by tSNE using the top eight PCs.
Trajectory analysis
The trajectory analysis was performed with 2000 highly variable genes in classical monocytes across mild (C7-2) and severe (C7-1) COVID-19 as defined by the vst method in Seurat. The following analysis was performed using Monocle2. Briefly, the input was created from the UMI count matrix of the highly variable genes using the newCellDataSet function with default parameters, except expressionFamily = “negbinomial.size”. The size factors and dis-persion of gene expression were estimated. The dimension of the normalized data was reduced on the basis of DDRTree using reduceDimension with default parameters, except scaling = FALSE, which aligned the cells to the trajectory with three dis-tinct clusters.
To determine genes that gradually changed along the trajectory, we identified the DEGs using MAST between clusters 1 and 3, which represent the severe stage and mild stage, respectively. The ex-pression patterns of representative DEGs were visualized along the pseudotime after correction with estimated size factors and disper-sion for all genes.
K-means clustering analysis of monocytes
In Fig. 4B, we performed K-means clustering of DEGs among all pairs of mild COVID-19, severe COVID-19, and influenza. The
log2-transformed relative gene expression of DEGs compared with
healthy donors was subjected to K-means clustering (k = 10). Here, we used up-regulated DEGs in at least one disease group compared with the healthy donor group. We manually assigned five clusters based on gene expression patterns.
Data analysis of the transcriptome profiles of postmortem lung tissues
The transcriptome profiles of postmortem lung tissues from two lethal cases of COVID-19 and biopsied heathy lung tissues from two donors were downloaded from a public database (GSE147507). The DEGs were identified using DESeq2 based on a Bonferroni-adjusted P < s0.05 and a log2 fold change > 1.
at KOREA ADVANCED INST OF SCI on August 5, 2020
http://immunology.sciencemag.org/
Enrichment analysis using Enrichr and GSEA 4.0.3
Enrichr, the web-based software for GSEA was used for LINCS L1000 ligand perturbation analysis (22), virus perturbation analysis, and disease perturbation analysis from the GEO database. “Combined score” was calculated as a parameter of enrichment as the log(P value) multiplied by the z-score from the Fisher’s exact test. GSEA 4.0.3 software was used to conduct the GSEA when a ranked list of genes was available (Figs. 5G and 6, C to E) (37). Results for IFN-– responsive genes were not presented because those were considerably overlapped with IFN-–responsive genes, which are typical ISGs. The normalized enrichment score and false discovery rate (FDR)
q value were calculated to present the degree and significance of
enrichment.
Flow cytometry analysis
Cryopreserved PBMCs were thawed, and dead cells were stained using the Live/Dead Fixable Cell Stain kit (Invitrogen, Carlsbad, CA). Cells were stained with fluorochrome-conjugated antibodies, including anti-CD3 (BV605; BD Biosciences), anti-CD4 (BV510; BD Biosci-ences), anti-CD8 (BV421; BD BiosciBiosci-ences), anti-CD14 (PE-Cy7; BD Biosciences), anti-CD19 (Alexa Fluor 700; BD Biosciences), and anti- CD56 (VioBright FITC; Miltenyi Biotec). For staining with anti– granzyme B (BD Biosciences), cells were permeabilized using a Foxp3 staining buffer kit (eBioscience).
For intracellular cytokine staining of IFN-, PBMCs were stimu-lated with PMA (50 ng/ml) (Sigma-Aldrich) and ionomycin (1 g/ml) (Sigma-Aldrich). Brefeldin A (GolgiPlug, BD Biosciences) and mo-nesin (GolgiStop, BD Biosciences) were added 1 hour later. After another 5 hours of incubation, cells were harvested for staining with the Live/Dead Fixable Cell Stain kit, anti-CD3, anti-CD4, and anti- CD8. After cell permeabilization, cells were further stained with anti–IFN- (Alexa Fluor 488; eBioscience). Flow cytometry was per-formed on an LSR II instrument using FACSDiva software (BD Bio-sciences), and the data were analyzed using FlowJo software (Treestar, San Carlos, CA).
Enzyme-linked immunosorbent assay and cytometric bead arrays
Cytokines were measured in plasma samples, including IFN-, IL-18 (enzyme-linked immunosorbent assay, R&D Systems, Minneapolis, MN), IL-1 (Cytometric bead array flex kit, BD Biosciences, San Jose, CA), TNF, IL-6, and IFN- (LEGENDplex bead-based immuno-assay kit, BioLegend, San Diego, CA).
Statistical analysis
We performed the KS test to compare the distributions of two groups without assuming that the distributions follow normality. Welch’s
t test was conducted to compare the two distributions after
confirm-ing the normality of the distributions usconfirm-ing the Shapiro-Wilk nor-mality test. A Wilcoxon signed rank test was conducted to compare the differences between two groups with paired subjects. The Mann- Whitney test was performed to compare the means of two groups. Statistical analyses were performed using Prism software version 5.0 (GraphPad, La Jolla, CA). P < 0.05 was considered significant.
SUPPLEMENTARY MATERIALS
immunology.sciencemag.org/cgi/content/full/5/49/eabd1554/DC1
Fig. S1. Clinical characteristics and assessment of the quality of scRNA-seq results. Fig. S2. Transcriptome features of highly variable genes.
Fig. S3. Characterization of disease-specific CD8+ T cell subpopulations.
Fig. S4. Subpopulation analysis of classical monocytes.
Fig. S5. Serum cytokine concentration of COVID-19 patients (A), and STRING analysis of up-regulated genes in cluster 1 obtained from the trajectory analysis of classical monocytes (B). Table S1. Experimental batches of scRNA-seq.
Table S2. Clinical characteristics of patients with severe influenza. Table S3. Clinical characteristics of patients with COVID-19. Table S4. The scRNA-seq results.
Table S5. A list of marker genes for each cluster.
Table S6. A list of DEGs and associated biological pathways in Fig. 2B.
Table S7. Cell types in which the GBP1, CREM, and CCL3 were up-regulated in Fig. 2C. Table S8. A list of genes in each module obtained from WGCNA in Fig. 2D. Table S9. A list of up-regulated genes in non–EM-like CD8+ T cell subpopulations.
Table S10. A list of genes included in each cluster defined by K-mean clustering of classical monocytes.
Table S11. A list of genes up-regulated in early and late pseudotime.
View/request a protocol for this paper from Bio-protocol.
REFERENCES AND NOTES
1. F. Wu, S. Zhao, B. Yu, Y.-M. Chen, W. Wang, Z.-G. Song, Y. Hu, Z.-W. Tao, J.-H. Tian, Y.-Y. Pei, M.-L. Yuan, Y.-L. Zhang, F.-H. Dai, Y. Liu, Q.-M. Wang, J.-J. Zheng, L. Xu, E. C. Holmes, Y.-Z. Zhang, A new coronavirus associated with human respiratory disease in China.
Nature 579, 265–269 (2020).
2. N. Zhu, D. Zhang, W. Wang, X. Li, B. Yang, J. Song, X. Zhao, B. Huang, W. Shi, R. Lu, P. Niu, F. Zhan, X. Ma, D. Wang, W. Xu, G. Wu, G. F. Gao, W. Tan; China Novel Coronavirus Investigating and Research Team, A novel coronavirus from patients with pneumonia in China, 2019. N. Engl. J. Med. 382, 727–733 (2020).
3. World Health Organization, Coronavirus disease 2019 (COVID-19) Situation Report−134. (2 June 2020);
www.who.int/docs/default-source/coronaviruse/situation-reports/20200602-covid-19-sitrep-134.pdf?sfvrsn=cc95e5d5_2.
4. W.-j. Guan, Z.-y. Ni, Y. Hu, W.-h. Liang, C.-q. Ou, J.-x. He, L. Liu, H. Shan, C.-l. Lei, D. S. C. Hui, B. Du, L.-j. Li, G. Zeng, K. Y. Yuen, R.-c. Chen, C.-l. Tang, T. Wang, P.-y. Chen, J. Xiang, S.-y. Li, J.-l. Wang, Z.-j. Liang, Y.-x. Peng, L. Wei, Y. Liu, Y.-h. Hu, P. Peng, J.-m. Wang, J.-y. Liu, Z. Chen, G. Li, Z.-j. Zheng, S.-q. Qiu, J. Luo, C.-j. Ye, S.-y. Zhu, N.-s. Zhong; China Medical Treatment Expert Group for Covid-19, Clinical characteristics of Coronavirus disease 2019 in China. N. Engl. J. Med. 382, 1708–1720 (2020).
5. J. T. Wu, K. Leung, M. Bushman, N. Kishore, R. Niehus, P. M. de Salazar, B. J. Cowling, M. Lipsitch, G. M. Leung, Estimating clinical severity of COVID-19 from the transmission dynamics in Wuhan, China. Nat. Med. 26, 506–510 (2020).
6. R. Channappanavar, S. Perlman, Pathogenic human coronavirus infections: Causes and consequences of cytokine storm and immunopathology. Semin. Immunopathol. 39, 529–539 (2017).
7. S. F. Pedersen, Y.-C. Ho, SARS-CoV-2: A storm is raging. J. Clin. Invest. 130, 2202–2205 (2020).
8. G. Chen, D. Wu, W. Guo, Y. Cao, D. Huang, H. Wang, T. Wang, X. Zhang, H. Chen, H. Yu, X. Zhang, M. Zhang, S. Wu, J. Song, T. Chen, M. Han, S. Li, X. Luo, J. Zhao, Q. Ning, Clinical and immunological features of severe and moderate coronavirus disease 2019.
J. Clin. Invest. 130, 2620–2629 (2020).
9. E. Z. Ong, Y. F. Z. Chan, W. Y. Leong, N. M. Y. Lee, S. Kalimuddin, S. M. Haja Mohideen, K. S. Chan, A. T. Tan, A. Bertoletti, E. E. Ooi, J. G. H. Low, A dynamic immune response shapes COVID-19 progression. Cell Host Microbe 27, 879–882 (2020).
10. R. Channappanavar, A. R. Fehr, R. Vijay, M. Mack, J. Zhao, D. K. Meyerholz, S. Perlman, Dysregulated type I interferon and inflammatory monocyte-macrophage responses cause lethal pneumonia in SARS-CoV-infected mice. Cell Host Microbe 19, 181–193 (2016). 11. C. Qin, L. Zhou, Z. Hu, S. Zhang, S. Yang, Y. Tao, C. Xie, K. Ma, K. Shang, W. Wang,
D.-S. Tian, Dysregulation of immune response in patients with COVID-19 in Wuhan, China.
Clin. Infect. Dis. 2020, ciaa248 (2020).
12. H.-Y. Zheng, M. Zhang, C.-X. Yang, N. Zhang, X.-C. Wang, X.-P. Yang, X.-Q. Dong, Y.-T. Zheng, Elevated exhaustion levels and reduced functional diversity of T cells in peripheral blood may predict severe progression in COVID-19 patients. Cell. Mol. Immunol. 17, 541–543 (2020).
13. M. Zheng, Y. Gao, G. Wang, G. Song, S. Liu, D. Sun, Y. Xu, Z. Tian, Functional exhaustion of antiviral lymphocytes in COVID-19 patients. Cell. Mol. Immunol. 17, 533–535 (2020). 14. Z. Xu, L. Shi, Y. Wang, J. Zhang, L. Huang, C. Zhang, S. Liu, P. Zhao, H. Liu, L. Zhu, Y. Tai,
C. Bai, T. Gao, J. Song, P. Xia, J. Dong, J. Zhao, F.-S. Wang, Pathological findings of COVID-19 associated with acute respiratory distress syndrome. Lancet Respir. Med. 8, 420–422 (2020).
15. E. J. Giamarellos-Bourboulis, M. G. Netea, N. Rovina, K. Akinosoglou, A. Antoniadou, N. Antonakos, G. Damoraki, T. Gkavogianni, M. E. Adami, P. Katsaounou, M. Ntaganou, M. Kyriakopoulou, G. Dimopoulos, I. Koutsodimitropoulos, D. Velissaris, P. Koufargyris, A. Karageorgos, K. Katrini, V. Lekakis, M. Lupse, A. Kotsaki, G. Renieris, D. Theodoulou,
at KOREA ADVANCED INST OF SCI on August 5, 2020
http://immunology.sciencemag.org/