©Copyright 2021 Architectural Institute of Korea.
1. INTRODUCTION
Since recently, buildings have been minimizing casualties from natural disasters while providing comfort to their human occupants. However, even though buildings are constructed using many advanced technologies and functional materials, they cannot perfectly prevent natural disasters. Buildings are
most significantly affected by earthquakes and winds, which trigger dynamic behaviors such as bending moment and shear force. Thus, firm preparation against these natural calamities is required. To address this need, concrete-filled tube (CFT) structures have been widely used for two decades now (Han et al., 2006, Wei et al., 1995). However, CFT structures have an insufficient self-weight reduction effect and have a problem with processing the panel zone of the beam-column junction.
Therefore, a structure that can address these challenges with reduced weight and increased strength is required. The concrete-filled double tube (CFDT), in which the space between the interior and exterior parts of the steel tubes is filled with concrete, meets this need. However, although many domestic and overseas researches have been conducted on CFDT, they were mostly about compressed columns. There have been very few researches on CFDT for beam members (Jung et al., 2009; Lee et al., 2007; Tao et al., 2006; Kojiro et al., 2003; Zhao et al., 2006).
In this study, the structural behavior characteristics and bending-shear strength of CFDT beam members with shape memory alloy (SMA) and rebar between the inside and outside of the double-skin steel tubes were evaluated by fabricating them using different concrete strengths and fiber types and by performing bending tests on them with centralized loading (Song et al., 2006).
Bending-shear Strength of Concrete-filled Double Skin Circular
Steel Tubular Beams with SMA and Rebar in
Normal-and-High-strength Concrete
Seung Jo Lee and Jung Min Park
Professor, Department of Architecture, Chosun College of Science & Technology, Gwangju, South Korea Professor, Department of Architecture, Kyungbuk College, Yeongju, South Korea
https://doi.org/10.5659/AIKAR.2021.23.11
Abstract
A concrete-filled circular steel tube beam was fabricated, and a bending test was performed to analyze its failure modes, displacement ductility, bending-shear strength, and load-central deflection relationship. For the bending test, the installation position of the shape memory alloy (SMA) inside and outside the double-skin steel tube was used, and the rebar installation position, the concrete strength, the mixing of fibers, and the inner-outer diameter ratio as the main parameters. The test results showed that the installation positions of the reinforcements inside and outside the double-skin steel tube and the inner-outer diameter ratio of the steel tube affected the ductility, maximum load, and failure mode. In general, the specimen made of general concrete with SMA installed outside and inside (OI) the double-skin steel tube showed the best results.
Keywords: CFDT, Inside-outside Diameter Ratio, Bending-shear Strength, Displacement Ductility
Corresponding Author : Seung Jo Lee
Department of Architecture, Chosun College of Science & Technology, 309-1, Pilmundaero, Dong-gu, Gwangju, South Korea e-mail : [email protected]
This research was supported by Basic Science Research Program through the National Research Foundation of Korea (NRF-2018R1D1A1B07049830) funded by the Ministry of Education, Science and Technology.
This is an Open Access article distributed under the terms of the Creative Commons Attribution Non-Commercial License (http:// creativecommons. org/licenses/by-nc/3.0/) which permits unrestricted non-commercial use, distribution, and reproduction in any medium, provided the original work is properly cited.
Figure 2. Instrumentation sketch.
2. OVERVIEW OF THE CFDT BEAM TEST SAMPLES To evaluate the structural performance of CFDT, the dimensions and characteristics of steel tubes and all other materials were planned, as shown in Table 1 and Fig. 1. The concrete mixes are shown in Table 2 according to strength. Class 1 ordinary Portland cement was used to produce concrete, and garnet and fibers were mixed in each specimen. Up to 10% garnets were mixed in all the specimens, steel fibers (diameter: 0.5㎛ and length: 31.06mm) were mixed in the ordinary concrete specimen, and nylon (diameter: 12㎛; length: 6mm) was mixed in the high-strength concrete specimen.
Furthermore, carbon steel tubes for building structures were used. The external steel tubes were set at D0/t0=36.7, and two types of steel tube with Di/D0=0.21 and 0.46 were used for the internal steel tubes. The specimens were welded with SMA (10mm) and rebar (D13) inside the external steel tube and outside the internal steel tube. To install the internal and external
steel tubes in concentric circles, the end of each steel tube was divided into three equal parts, and the parts were welded onto each other. The concrete was placed between these double-skin steel tubes. Specimens aged 28 days after concrete placement were used in the experiments.
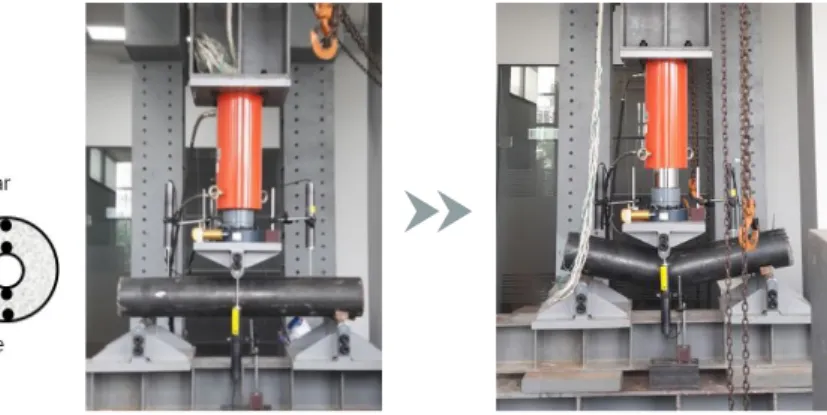
The bending test specimens were fabricated in accordance with ASTM C 348, and the central loading test was performed as shown in Figs. 2 and 3. Forged loading was performed using a 444.8kN load cell, and only the deformation strokes below 200 mm after the maximum load was applied were measured. The physical property values of the SMA are shown in Table 3, and the tensile stress-strain curve of the SMA at room temperature is shown if Fig. 4. The bending test results for the CFDT beams are shown in Table 4.
3. TEST RESULTS AND DISUSSION
(1) Load-Central Deflection Relationship Curve Figure1. Schematic of specimen with embedded CFDT.
Table 1. The list of CFDT beam.
Specimen (mm)D0 (mm)t0 (mm)Di (mm)ti Di/D0 D0/t0 fy fu fck SMA B
(MPa) (MPa) (MPa) (mm) (mm)
SF CSON* 165.2 4.5 76.3 2.8 0.46 36.7 358.2 411.4 25.2 10 -CSIN 76.3 2.8 0.46 10 -CSOIN 34 1.8 0.21 10 -CBON 76.3 2.8 0.46 - D13 CBIN 76.3 2.8 0.46 - D13 CBOIN 34 1.8 0.21 - D13 Ny CSOH 76.3 2.8 0.46 41.7 10 -CSIH 76.3 2.8 0.46 10 -CSOIH* 34 1.8 0.21 10 -CBOH 76.3 2.8 0.46 - D13 CBIH 76.3 2.8 0.46 - D13 CBOIH* 34 1.8 0.21 - D13
Note) S: SMA, O: Installing SMA and Rebar in the Outer Steel Tube, I: Installing the same in the Inner Steel Tube, OI: Installing the same in the Inner and Outer Steel Tubes, N: fck =25.2MPa, H: fck =41.7MPa, D0, Di: Outer and Inner Tube’s Diameters, t0, ti: Outer and Inner Tube’s Thicknesses, fy: Yielding Point of Steel Tubes, fu: Tension Strength of Steel Tubes, fck: Concrete Strength, B: Rebar, SF: Steel Fiber, Ny: Nylon
Table 2. Mixing properties composition of W/B ratios and materials W/b
(%) f
cu
(MPa) (%)S/a GA(%) W C GAMaterials (kgf/㎥)S G Ag
33 39.2 43 10 160 436.3 48.5 715 962.6 0.8
53 20.6 45 170 288.7 32.1 771.9 1023.2 0.812
Note) W/b: Water-binder Rate, fcu: Concrete Mixing Strength, S/a: Fine Aggregate Proportion, GA: Garnet, W: Water, C: Cement, S: Sand, G: Gravel, Ag: Agent Table 3. Phase transition temperature NiTi SMA and Physical properties of SMA.
Phase transition temperature (℃) Elasticity modulus Physical properties
(MPa) Tensile strength(MPa) Yield strength (MPa)
Mf Ms Rf Rs As Af
2291 1373 528
4.4 26.5 36.3 45.8 52.7 58.6
Note: Ms-martensite start temperature, Mf-martensite finish temperature, Rs-R phase start temperature, Rf-R phase finish temperature, As-austenite start temperature,
Af-austenite finish temperature
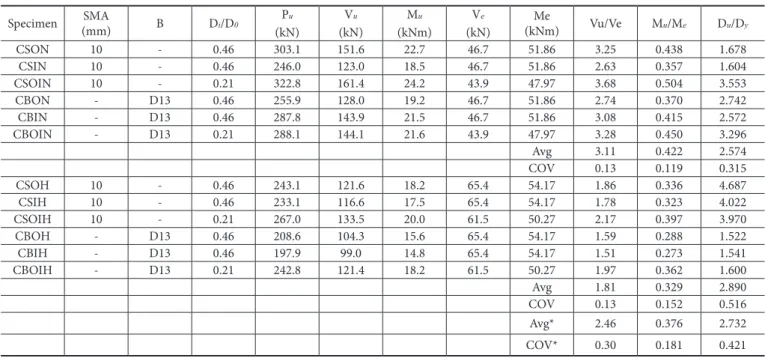
Table 4. Test results of CFDT beam
Specimen (mm)SMA B Di/D0 Pu (kN) Vu (kN) Mu (kNm) Ve (kN) (kNm)Me Vu/Ve Mu/Me Du/Dy CSON 10 - 0.46 303.1 151.6 22.7 46.7 51.86 3.25 0.438 1.678 CSIN 10 - 0.46 246.0 123.0 18.5 46.7 51.86 2.63 0.357 1.604 CSOIN 10 - 0.21 322.8 161.4 24.2 43.9 47.97 3.68 0.504 3.553 CBON - D13 0.46 255.9 128.0 19.2 46.7 51.86 2.74 0.370 2.742 CBIN - D13 0.46 287.8 143.9 21.5 46.7 51.86 3.08 0.415 2.572 CBOIN - D13 0.21 288.1 144.1 21.6 43.9 47.97 3.28 0.450 3.296 Avg 3.11 0.422 2.574 COV 0.13 0.119 0.315 CSOH 10 - 0.46 243.1 121.6 18.2 65.4 54.17 1.86 0.336 4.687 CSIH 10 - 0.46 233.1 116.6 17.5 65.4 54.17 1.78 0.323 4.022 CSOIH 10 - 0.21 267.0 133.5 20.0 61.5 50.27 2.17 0.397 3.970 CBOH - D13 0.46 208.6 104.3 15.6 65.4 54.17 1.59 0.288 1.522 CBIH - D13 0.46 197.9 99.0 14.8 65.4 54.17 1.51 0.273 1.541 CBOIH - D13 0.21 242.8 121.4 18.2 61.5 50.27 1.97 0.362 1.600 Avg 1.81 0.329 2.890 COV 0.13 0.152 0.516 Avg* 2.46 0.376 2.732 COV* 0.30 0.181 0.421
Note) B: Rebar, Pu: Maximum Load, Vu: Shear Strength, Mu: Bending Strength, Ve: Estimation of Shear Strength, Me: Estimation of Bending Strength, Du: The Deformation within the Strength Limit, Dy: Yield Deformation, Avg: Average, COV: Coefficient of Variation, Avg*: Overall Average, COV*: Overall Coefficient of Variation
Figure 4. Measured tensile stress-strain curve SMA at room temperature
Figure 5. Load versus central deflection curve of specimen
The load-central deflection relationship curve is shown in Fig.
5(a). It can be seen that the “N” series specimen had a typical bilinear curve shape. The deflections of most of the specimens gradually increased with the rising load until the initial yield. The specimens with SMA installed inside and outside showed approximately 4.6% higher load results than the specimens with rebars installed. In particular, CSOIN and CBOIN in the “N” series specimens showed significantly higher maximum loads. As shown in the previous results, the load of the specimens with SMA installed inside and outside the double-skin steel tube increased by 23.8%, and the load of the specimens with rebar installed inside and outside the double-skin steel tube increased by 11.2%.
In the “H” series specimens, the load of the specimens with SMA was 12.6% higher than that of the specimens with rebar, and at least 8% higher than that of the “N” series specimen. Furthermore, CSOIH and CBOIH, for which the SMA or rebar was installed both inside and outside the double-skin steel tube, showed higher loads than the other specimens. Overall, the maximum loads of the “N” series specimens were approximately 18.3% higher than those of the “H” series specimens, as shown in Fig. 5(b). In general, the specimens made of high-strength concrete had higher maximum loads than the specimens made of ordinary concrete. However, the specimens that were fabricated with ordinary concrete in this study showed increased loads as well as higher ductility and toughness because the installation of SMA and the mixing of steel fibers produced good results.
Figure 6. Failure mode of specimens
(2) Failure Modes
First, in the case of CSON, due to the gradually increasing centralized load after the initial yield, the neural axis clearly went down along with the buckling of the steel tube. Furthermore, the steel tube buckling phenomenon of the central bending area along with the increasing load and deflection was obvious, and
the steel tube of the bottom center was torn up to 22 mm. This phenomenon occurred from the neutral axis up to 19 mm and caused the aggregates inside the steel tube to protrude to the outside, as shown in Fig. 6. The CSOIH and CBOIH specimens also showed a failure mode similar to that of the CSON, but 4.5mm and 1.4 mm widening gaps occurred, respectively, together with buckling. Most of the specimens showed severe buckling of the compression area due to the centralized load. The other end parts showed almost no concrete surface cracks and relative displacements inside the steel tube.
4. COMPARISON OF THE TEST RESULTS WITH THE CONVENTIONAL EQUATION
To evaluate the shear strength, it was calculated by referring to the conventional shear strength (Ve) equation (i) for RC deep
beams (Kojiro et al., 2008):
Ve= .
/ [ ( ) ]( . / )
( ) (i)
where fck is the concrete strength (MPa), bw is the web width,
d is the effective depth, r is the loading width, a is the shear span length, and pw=As/bwd. Furthermore, as is 1/4 of the shear
section area of the inner and outer tubes, and d and bw are the
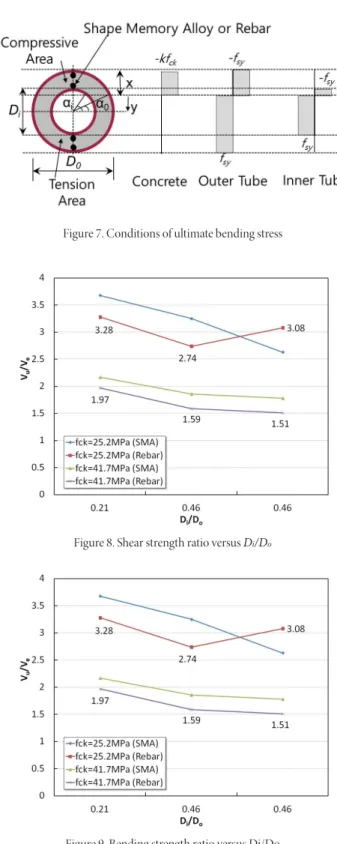
effective height and web width when the CFDT is changed to an equal-area square shape. Meanwhile, the flexural strength of the CFDT was calculated using equation (ii), by applying the equivalent stress block assuming that there was a neutral axis inside the inner tube and the steel tube was in full plastic state. The conditions of bending stress as shown in Fig. 7 (Kojiro et al., 2008).
Me= ( − ) + 4 ( + )(ii) where fsy is the yield strength of the steel tube; fck is the
compressive strength of the filled concrete; k is the reduction factor of concrete (=0.85); R0 and Ri are the radii of the outer
tube (=D0/2) and the inner tube (=Di/2), respectively; to and ti
are the thicknesses of the outer and inner tubes, respectively; and ai and a0 are the angles between the neutral and compressive
regions of the inner and outer tubes, respectively (however, Sinai=(R0/Ri)sina0).
(1) Relationship between the Experimental and Evaluation Values in the Bending-Shear Strength
To evaluate the bending-shear strength, the results of the shear strength evaluation equation (i) and the bending strength evaluation equation (ii) of the RC deep beam were compared with the experimental values.
Fig. 8 shows the evaluation of the shear strength according to the concrete strength. The average Vu/Ve ratio of the ordinary
concrete specimen was 3.11, and the coefficient of variation was 13%, whereas those of the high-strength concrete specimen were 1.81 and 13%, respectively. Therefore, the predicted values were higher than the experimental values.
Figure 7. Conditions of ultimate bending stress
Figure 8. Shear strength ratio versus Di/Do
Figure 9. Bending strength ratio versus Di/Do
This is because the cross-section area of the steel tube (As) was
1/4 of the shear cross-section area of the internal-external steel tubes, and the fck and other variables had significant effects on
the evaluation equation.
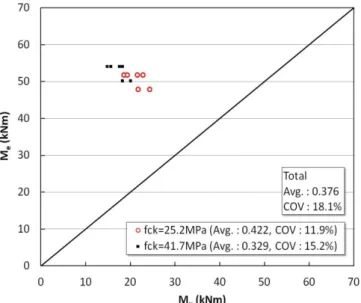
To evaluate the bending strength, the experimental and evaluation values were compared according to the concrete strength. The results are shown in Fig. 9. The average Mu/Me
ratio of the ordinary concrete specimen was 0.422, and the coefficient of variation was 11.9%, whereas those of the
high-strength concrete specimen were 0.329 and 15.2%, respectively. Thus, the experimental values were lower than the predicted values.
(2) Bending-Shear Strength and Displacement Ductility In essence, the displacement ductility reflects the inelastic deformation capacity of a structure, which ensures that its strength and stiffness do not fall sharply because of inelastic deformation (Choi et al., 2019). The test piece ductility can be defined as follows:
D=Du/Dy (iii)
In the above equation, Dy is the yield deformation, and Du is
the ultimate deformation within the strength limit. These values are determined at the member strength that is usually 80% of the ultimate strength (Lee et al., 2017).
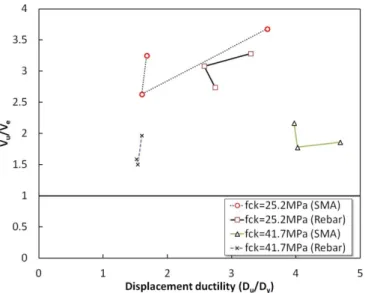
The relationship between the displacement ductility (Du/
Dy) and the shear strength (Vu/Ve) is shown in Fig. 10. When
the specimens were evaluated using equation (i), most of them showed a clear tendency to be overestimated as the fck decreased.
In particular, the CSOIN specimen was overestimated by up to 59% compared to the CBIH specimen. Furthermore, as Du/
Dy increased, the increase and decrease in the Vu/Ve tended to
be mixed. First, the value of the specimen with SMA was 4.92% higher on average than that of the specimen with rebar when fck=25.2 MPa, and 12.8% higher on average when fck=41.7 MPa.
The relationship between the Du/Dy and the bending strength
(Mu/Me) calculated using equation (ii) is shown in Fig. 11. As
the displacement ductility increased, the Mu/Me results showed
a tendency similar to that of the Vu/Ve results.
When the CBIH was compared with the other specimens, the Mu/Me was found to have been underestimated by up to 45.8%
regardless of the reinforcement inside the steel tube, the use of
high-strength concrete, and the use of fibers. This is because the bending strength (Mu) obtained through the experiment
showed the lowest value. Therefore, with respect to Vu/Ve, the
specimen with high-strength concrete and rebar installed inside the steel pipe showed a tendency to approach 1, which indicates a tendency towards decreasing overestimation. However, with respect to Mu/Me, the underestimation increased, and moved
farther from 1, which is the opposite result.
(3) Relationship between the Bending-Shear Strength and the Inner-Outer Ratio
As seen in Fig. 12, the concrete strength fck increased and the
overestimation of the shear strength (Vu/Ve) in the experimental
values decreased. The specimens with both SMA and rebar installed inside and outside generally showed high Vu/Ve
ratios, that peaked at fck=25.2 MPa. Compared with the other
specimens except for the CBIN specimen, the overestimation
Figure 12. Estimation of shear strength versus Vu
tendency of Vu/Ve depending on the installation positions of
the SMA and rebar inside and outside the double-skin steel tube was highest in the case of the inside and outside installations, followed by the outside and inside installations.
As the inner-outer diameter ratio increased, the bending strength tended to be overestimated, as shown in Fig. 13. These results are opposite the tendencies of the shear strength and the inner-outer diameter ratio, which is more obvious in the specimens made of high-strength concrete and rebars because the evaluation value obtained using equation (ii) was smaller than the experimental value.
Figure 13. Estimation of bending strength versus Mu
5. CONCLUSIONS
1) The outside and inside (OI) specimens with shape memory alloy (SMA) and rebar installed in the bending-shear area inside and outside the double-skin steel tube showed the best results in terms of the increase in the maximum load, ductility, and toughness. Various forms of cracks, failures, and sharp load reduction that may generally appear in steel-reinforced concrete beams hardly occurred, which suggests the possibility of the application of SMA as a beam member material.
2) The concrete-filled double-tube (CFDT) specimens showed almost no relative displacement, which refers to the outside protrusion of the internal concrete. This seems to be because the internal and external steel tubes were welded after the end of the steel tube was divided into three equal parts, and because of the concrete restraint effect of the double-skin steel tube as well as the combined actions of the SMA, rebar, and fibers.
3) The OI specimens also showed the best results in the bending-shear strength evaluation according to the displacement ductility and the inner-outer diameter ratio. However, as the current bending-shear strength evaluation equation has limitations, there is a plan to propose an evaluation
equation with new variables for proper evaluation. REFERENCES
Choi, W., Jang, S. J., & Yun, H. D. (2019). “Design Properties of Insulated Precast Concrete Sandwich Panels with Composite Shear Connector.” Composites part B-Engineering 157: 36-42.
Han, L. H., H. Hong, & X. L. Zhao. (2006). “Concrete-Filled Double Skin Steel Tubular (CFDST) Beam-Columns Subjected to Cyclic Bending.” Engineering Structures 28: 1698-1714.
Jung, H. M., Ryoo, J. Y., Lee, S. H., Kim, J. H., & Choi, S. M. (2009). “An Experimental of Structure Performance of Double-Skin CFT Column.” Proceeding of Annual Conference of the Architectural Institute of Korea 29(1): 405-408.
Kojiro, U., Y. Shimizu & K. Hiroaki. (2008). “Bending Shear Test of Double Steel Tube and Concrete Composite Deep Beam.” Proceeding of the Japan Concrete Institute 30: 1321-1326. Kojiro, U., K. Hiroaki, K. Sonoda, & M. Hayami. (2003).
“Experimental Study on Concrete Filled Double Tubular Steel Column under Axial Loading.” Advances in Structures: 877-882.
Lee, S. H., Park, J. H., Choi , Y. H., Kim, J. H., & Choi, S. M. (2007). “Structural Characteristics of Thin Walled Cold-Formed Square Concrete Filled Tubular Stub Column Based on Concrete Strength.” Proceeding of Annual Conference of the Architectural Institute of Korea 27(1): 53-56.
Lee, S. J., & Park, J. M. (2017). “An Experimental Study on the Structural Behaviors of HIRC Beams Using Nickel-Titanium SMA Wires.” Key Engineering Materials 585: 423-428. Song, G., Ma, N., & H. N. Li. (2006). “Applications of Shape
Memory Alloys in Civil Structures.” Engineering Structures 128: 1266-1274.
Tao, Z., & L. H. Han. (2006). “Behaviour of Concrete-Filled Double Skin Rectangular Steel Tubular Beam-Columns.” Journal of Constructional Steel Research 62: 631-646. Wei, S., S. T. Mau, C. Vipulanandan & S. K. Mantrala. (1995).
“Performance of New Sandwich Tube under Axial Loading: Experiment.” ASCE Journal of Structural Engineering 121: 1806-1814.
Zhao, X. L., & L. H. Han. (2006). “Double Skin Composite Construction, Progress in Structural Engineering and Materials.” Progress in Structural Engineering and Materials 8: 93-102.