1. INTRODUCTION
Developing a reliable method for automated drug infusion systems would improve a patient’s individualized drug therapy under the unexpected and acute changes of hemodynamics in a clinical setting. Automated drug infusion systems for controlling mean arterial blood pressure (MAP) have been previously constructed using proportional-integral-derivative (PID) algorithms [2-3]. As long as the MAP response to pharmacological intervention does not change markedly, the simple PID controls work reasonably well. However, the conventional PID controller might not be able to achieve maximum performance because of the unexpected change of the intra- and inter-patient variability. The robustness in the fuzzy PID control and the conventional PID control was tested under the unknown MAP responses to a vasopressor agent (norepinephrine; NE) during acute hypotension.
2. METHODS
2.1 Modeling of MAP response
The average step response as MAP changed from baseline (∆MAP) during a infusion of NE at 3 µg kg-1 min-1 (5 min)
was obtained in anesthetized rabbits (n = 3). The animal study conformed to the Guide for the Care and Use of Laboratory
Animals published by the US National Institutes of Health
(NIH Publication No. 85-23, revised 1996). Japanese white rabbits were anesthetized via intravenous injection (2 ml kg-1)
with a mixture of urethane (250 mg ml-1) and α-chloralose (40
mg ml-1). The rabbits were ventilated artificially with
oxygen-enriched room air. To maintain the appropriate level of anesthesia, supplemental doses of the anesthetics were administered continuously (0.2-0.5 ml kg-1 h-1, i.v.). MAP was
measured using a high-fidelity pressure transducer (Millar Instruments, Houston, TX, USA) inserted into the right femoral artery. A catheter was introduced into the left femoral artery, and a computer-controlled infusion pump (CFV-3200; Nihon Kohden, Tokyo, Japan) was attached to the arterial line for later arterial blood withdrawal and re-infusion, which induced acute hypotension. A double-lumen catheter was introduced into the right femoral vein for administration of anesthetic agent and NE. Another computer-controlled
infusion pump was used for the anesthetic agent and the infusion of NE. The infusion rate of NE was controlled through a 12-bit digital-to-analog converter connected to a laboratory computer. Body temperature was maintained at around 38ºC with a heating pad throughout the experiment.
ICCAS2005 June 2-5, KINTEX, Gyeonggi-Do, Korea
Automated Drug Infusion System Based on Fuzzy PID Control
during Acute Hypotension
Koji Kashihara*
* Tokyo Institute of Technology, Tokyo, Japan (Tel:+81-48-462-1111;E-mail: [email protected])
Abstract: In a clinical setting, developing a reliable method for the automated drug infusion system would improve a drug therapy
under the unexpected and acute changes of hemodynamics. The conventional proportional-integral-derivative (PID) controller might not be able to achieve maximum performance because of the unexpected change of the intra- and inter-patient variability. The fuzzy PID control and the conventional PID control were tested under the unexpected response of mean arterial blood pressure (MAP) to a vasopressor agent during acute hypotension. Compared with the conventional PID control, the fuzzy PID control performed the robust MAP regulation regardless of the unexpected MAP response (average absolute value of the error between target value and actual MAP: 0.98 vs. 2.93 mmHg in twice response of the expected MAP and 2.59 vs. 9.75 mmHg in three-times response of the expected MAP). The result was due to the adaptive change of the proportional gain in PID parameters.
Keywords: Hemodynamics, Mean arterial blood pressure, Rabbits, Norepinephrine, Acute disturbance
The ∆MAP response at sampling rate of 10 Hz was averaged every 10 s. The step response of ∆MAP was approximated to the first-order delay system with a time delay.
) ( exp 1 ) MAP( t L T L t K t = ⋅ − − − ≥ ∆ ⎥⎥⎥ ⎦ ⎤ ⎢ ⎢ ⎢ ⎣ ⎡ ⎟ ⎟ ⎟ ⎠ ⎞ ⎜ ⎜ ⎜ ⎝ ⎛ (1)
where K is a proportional gain [mmHg/(µg kg-1 min-1)], L is a
pure time delay (s), and T is a time constant (s). If t < L then ∆MAP(t) = 0. The fitted parameters to the averaged step responses in NE were acquired by least squares method: K = 20, T = 49, and L = 10.
The ∆MAP response as a model was calculated by the convolution integral between the impulse response of ∆MAP and the infusion rate of NE.
∑
= − ⋅ ∆ ⋅ = ∆ Nm τ τ t u T τ g t 0 ) ( ) ( ) MAP( (2) where ⎟ ⎠ ⎞ ⎜ ⎝ ⎛− − ⋅ = T L t T K t g() expu(t) is the infusion rate of NE (µg kg-1 min-1) and g(t) is the
unit impulse response (mmHg). The g(t) is calculated from the derivative values of the step response of Eq. (1). ∆T is sampling interval (s) and Nm is the finite number of terms in
the model for the unit impulse response. K is a proportional gain [mmHg/(µg kg-1 min-1)], T is a time constant (s), and L is
a pure time delay (s). The parameters of ∆MAP used for the following simulation study were ∆T = 10, Nm = 30, K = 20/3, T = 49, and L = 10.
2.2 Fuzzy PID control
Conventional PID Control. The PID algorithm as the
ICCAS2005 June 2-5, KINTEX, Gyeonggi-Do, Korea
velocity form algorithm in the discrete time domain was adopted.
[
]
[
]
⎭ ⎬ ⎫ ⎩ ⎨ ⎧ − + − ⋅ − ⋅ ∆ + ⋅ ∆ + − − ⋅ = ∆ () () ( 1) () e(t) 2e(t 1) e(t 2) T T t e T T t e t e K t u D I P (3) ) ( 1) ( ) (t u t u t u = − +∆where u(t) is the infusion rate of NE (µg kg-1 min-1), ∆u(t) is a
change in u(t), KP is a proportional gain [(µg kg-1 min-1)
mmHg-1], T
I is integral time (s), TD is derivative time (s), ∆T is
the sampling interval (10 s), and e(t) is the difference between a target value and observed ∆MAP (mmHg). Initial PID parameters were determined by the Ziegler-Nichols method [4]: KP = 0.3, TI = 20, and TD = 5.
Fuzzy PID Control. Fig. 1 shows the diagram of fuzzy PID
control. The proportional gain (KP) of the PID controller in Eq.
(3) was adjusted by fuzzy inference. Fuzzy inference is the process of formulating and mapping from a given input to an output using fuzzy logic [1, 5]. The inputs to the fuzzy inference system are the positive change from target value to ∆MAP(t) (overshoot) and the difference between ∆MAP(t-1) and ∆MAP(t) (slope), and the output is the KP on the PID
controller. The fuzzy inference process can be described as follows. + -e(t) Infusion Rate u(t) ∆MAP(t) Integral TI=20 Sensor Controller Pump Patient Target Value r Delay + Derivative TD=5 + + Fuzzy Inference Proportional KP=(0.05-0.3)
Fig.1 The diagram of fuzzy PID control
1) Fuzzify Inputs. The initial step is to take the inputs and
determine the degree belonging to each of the appropriate fuzzy sets via membership functions. In the present study, the triangular membership function formed by straight lines was used. The adjustment of KP is built on the following three
rules: Rules 1-3.
IF overshoot is small or slope is small THEN KP is large.
IF overshoot is middle or slope is middle THEN KP is middle.
IF overshoot is large or slope is large THEN KP is small.
Each of the rules depends on resolving the inputs into a number of different fuzzy linguistic sets. The inputs must be fuzzified according to each of the linguistic sets. This Step 1) shows how large the overshoot (rated on a scale of 5 to 15 mmHg) or the slope (rated on a scale of 5 to 15 mmHg/10s) is via its membership functions (rated on a scale of 0 to 1). Each input is fuzzified over all the qualifying membership functions required by the rules.
2) Apply Fuzzy Operator. The inputs to the fuzzy operator
are two membership values from fuzzified input variables in Step 1), and the output is a single value. The OR operator was used for determining the single output as the membership value:
µC=max
{
µA(x1), µB(x2)}
(4) where µ is the degree of the membership function. A and B are fuzzy sets in overshoot and slope as inputs to the antecedent of the fuzzy rules. C is a fuzzy set in the values selected as the input to the consequent of the rules. The x is the input to the membership function.3) Apply Implication Method. A consequent (KP ranged
from 0.05 to 0.25) of the three rules is a fuzzy set represented by a membership function weighting the linguistic characteristics. To determine a single number, the consequent is reshaped using a function associated with the antecedent. The input for the implication process is a single number given by the antecedent. The output is a fuzzy set. An implication method was used by the AND operator:
{
( ), ( )}
min ) ( 3i C 3i D 3i E x µ x µ x µ = i = 0, 1, •••, 20 (5) where C contains the values determined by Step 1). D is a fuzzy set in KP for the antecedent of fuzzy rules. E is a fuzzyset in the values selected for the aggregation procedure of the next Step 4). To discretize the time domain, the input range of
x was divided by 20. The AND operator selected the minimum
of the two values as a single number given by the antecedent and the membership function of the consequent.
4) Aggregate All Outputs. Aggregation is the process by
which the fuzzy sets representing the outputs of each rule are combined into a single fuzzy set. Aggregation only occurs once for each output variable. The input of the aggregation process is the list of truncated output functions returned by the implication process for each rule. The output of the aggregation process is one fuzzy set for each output variable. The aggregation was performed by the selection of the maximum of two values in the membership functions:
{
( ), ( ), ( )}
max ) ( 3i E1 3i E2 3i E3 3i F x µ x µ x µ x µ = (6)where E1, E2, and E3 are the fuzzy sets determined by the Steps 1) to 4) under the Rules 1 to 3, respectively. F is a fuzzy set acquired from the result of the aggregation process. i = 0, 1, •••, and 20. All three rules have been placed together to show how the output of each rule is combined, or aggregated, into a single fuzzy set whose membership function assigns a weighting for every output value (KP).
5) Defuzzify. To resolve a single output value from the set, it
must be defuzzified because the aggregate of a fuzzy set encompasses a range of output values. The centroid calculation is used to determine the action that the controller will actually take. The proportional gain for update, KP*, was
calculated as
∑
∑
= = = 20 0 3 3 20 0 3 * ) ( .) ( i F i i i F i x x x Kp µ µ (7)187
ICCAS2005 June 2-5, KINTEX, Gyeonggi-Do, Korea
Fig.4 shows the simulation result of fuzzy or conventional PID control under the unknown ∆MAP change (three-times response of ∆MAP model) during acute hypotension. In the unexpected ∆MAP change, the ∆MAP of fuzzy PID control was stabilized compared with that under the conventional PID control (average absolute value of the error between target value and actual ∆MAP: 2.59 vs. 9.75 mmHg). The proportional gain (Kp) of fuzzy PID controller was adjusted to
the optimal value (change from 0.3 to 0.15) during acute hypotension. The conventional PID control had the large oscillation of ∆MAP, which exceeded +30 mmHg. The fuzzy PID control had the slight oscillation of ∆MAP within ±10 mmHg.
3. SIMULATION
MAP control against acute hypotension under the expected (∆MAP response as the model used for the control design) or unexpected (twice or three times as large as the ∆MAP model response) condition was simulated. The target value in the closed-loop control was set to ∆MAP = 0. The exogenous pressure perturbation was introduced at a constant speed of -18 mmHg min-1 for 2 min, and then maintained at -36 mmHg
for 5 min. Random noise within ±1 mmHg was added to ∆MAP during acute hypotension.
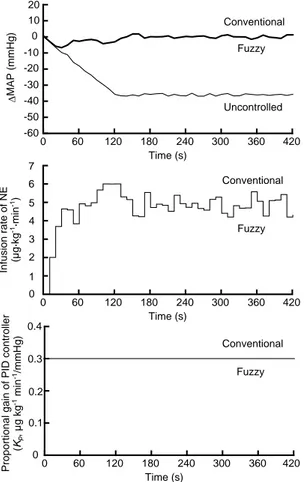
Fig.2 shows the simulation result of fuzzy or conventional PID control under the expected ∆MAP change during acute hypotension. In the expected change, ∆MAP under the conventional PID control and the fuzzy PID control returned to the target value within approximately 60 s, respectively. The ∆MAP was maintained at baseline level (i.e., ∆MAP = 0) in both of the controls.
4. DISCUSSION
The fuzzy PID control performed the robust MAP regulation under the unexpected MAP change during acute hypotension (Figs. 3, 4). The adaptive change of the proportional gain (Kp) in the PID parameter contributed to the
robust control. As the only problem, the fuzzy PID control showed the slight oscillation under the three-times response of the expected MAP (Fig. 4). The adjustment of the TI and TD in
the PID parameters by the fuzzy logic will improve the problem. However, further unexpected responses of hemodynamics in actual clinical situations may occur. Therefore, the design of the robust fuzzy controller under the clinical settings will require preparing a great number of experienced rules fit for the various cases.
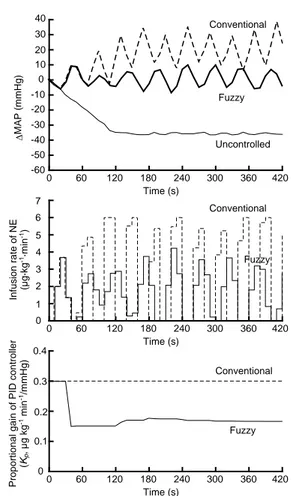
Fig.3 shows the simulation result of fuzzy or conventional PID control under the unknown ∆MAP change (twice response of ∆MAP model) during acute hypotension. In the unexpected ∆MAP change, the ∆MAP of fuzzy and conventional PID controls quickly returned to the target value. The ∆MAP of fuzzy PID control was stabilized compared with that under the conventional PID control (average absolute value of the error between target value and actual ∆MAP during the 7-min closed-loop control: 0.98 vs. 2.93 mmHg). The proportional gain (Kp) of fuzzy PID controller was
adjusted to the optimal value (change from 0.3 to 0.2)during acute hypotension. 0 60 120 180 240 300 360 420 -50 -40 -30 -20 -10 0 10 20 -60 Time (s) ∆ MAP (mmHg) 0 60 120 180 240 300 360 420 1 2 3 4 5 6 7 0 Time (s) In fu sio n r a te o f NE (µg· kg -1·min -1) Conventional Uncontrolled 0 60 120 180 240 300 360 420 0.1 0.2 0.3 0.4 0 Time (s) Proport ional gain of PI D cont roller (K p , µg kg -1 min -1/mmHg) Fuzzy Conventional Fuzzy Conventional Fuzzy 0 60 120 180 240 300 360 420 -50 -40 -30 -20 -10 0 10 20 -60 Time (s) ∆ MAP (mmHg) 0 60 120 180 240 300 360 420 1 2 3 4 5 6 7 0 Time (s) In fu sio n r a te o f NE (µg ·kg -1·min -1) Uncontrolled 0 60 120 180 240 300 360 420 0.1 0.2 0.3 0.4 0 Time (s) Proport ional gain of PI D cont roller (K p , µg kg -1 min -1/mmHg) Conventional Fuzzy Conventional Fuzzy Conventional Fuzzy
Fig. 2 Simulation result of fuzzy or conventional PID control under the expected MAP response during acute hypotension
Fig. 3 Fuzzy or conventional PID control under the twice response of the expected MAP during acute hypotension
ICCAS2005 June 2-5, KINTEX, Gyeonggi-Do, Korea
5. CONCLUSION
0 60 120 180 240 300 360 420 -50 -40 -30 -20 -10 0 10 20 -60 Time (s) ∆ MAP ( mmHg) 0 60 120 180 240 300 360 420 1 2 3 4 5 6 7 0 Time (s) In fu sio n ra te o f N E (µ g· k g -1·m in -1) Uncontrolled 0 60 120 180 240 300 360 420 0.1 0.2 0.3 0.4 0 Time (s) Pr opor ti onal gai n of PI D c ont ro lle r (K p , µg kg -1 mi n -1/mmHg) Conventional Fuzzy Conventional Fuzzy Conventional Fuzzy 4030 Compared with the conventional PID control, the fuzzy PID
control performed the robust regulation of MAP response under the unexpected MAP change during acute hypotension. The result was due to the adaptive change of the proportional gain in the PID parameter.
REFERENCES
[1] E. H. Mamdani and S. Assilian, “An experiment in linguistic synthesis with a fuzzy logic controller , ”
International Journal of Man-Machine Studies, Vol. 7,
pp. 1-13, 1975.
[2] M. L. Quinn, N. T. Smith, J. E. Mandel, J. F. Martin, and A. M. Schneider, “Automatic control of arterial pressure in the operating room: safety during episodes of artifact and hypotension?,” Anesthesiol, Vol. 68, pp. A327, 1988.
[3] L. C. Sheppard, “Computer control of the infusion of vasoactive drugs,” Ann. Biomed. Eng, Vol. 8, pp. 431-444, 1980.
[4] J. G. Zieglar and N. B. Nichols, “Optimum settings for automatic controllers,” Trans. ASME, Vol. 64, pp. 759-768, 1942.
[5] L. A. Zadeh, “Making computers think like people,”
IEEE Spectrum, Vol. 8, pp. 26-32, 1984.
Fig. 4 Fuzzy or conventional PID control under the three-times response of the expected MAP during acute
hypotension