09-S-092
대한설비공학회 2009 하계학술발표대회 논문집 pp. 0508 ~ 0513
신재생에너지 적용이 도시열섬방지에 미치는 기여도 분석
손 원 득†, 박정한, 박경순
삼신설계(주) 부설 삼신에너지환경연구원
A Study on Quantitative Estimation for prevention of Heat Island
by Using New & Renewable Energy
Won-Tug Son†, Jung-Han, Park, Kyung-Soon Park
Sahm Shin Energy and Environment Institute, Sahm Shin Engineers, INC
ABSTRACT: Significant air temperature increases in urban areas are known as the heat island phenomenon in a global scale. Therefore, we use numerical model in order to analyze quantitative effects by using new & renewable energy on the heat island phenomenon in urban area. The present study quantitatively analyzes the Urban Heat Island Effects, Energy-Saving Effects, and Environmental Load Decrease Effect along New and Renewable Energy Application which is 10% of the Building Energy Consumption.
Key words: New & renewable energy(신재생에너지), Heat Island(도시열섬), Environmental Load(환경부하), Ground source heat pump(지열원히트펌프)
†Corresponding author
Tel.: +82-2-578-5671; fax: +82-2-578-8378 E-mail address: [email protected]
기 호 설 명 u : 풍속 [m/s] θ : 공기온도 [K] q : 비습 [kg/kg] H, W : 생성항 [-] Km, Kh, Kv : 난류확산계수 [-] C : 저항계수 [-]
Rf : Flux richardson number [-]
Rfc : 한계 Flux richardson number(=0.25) [-]
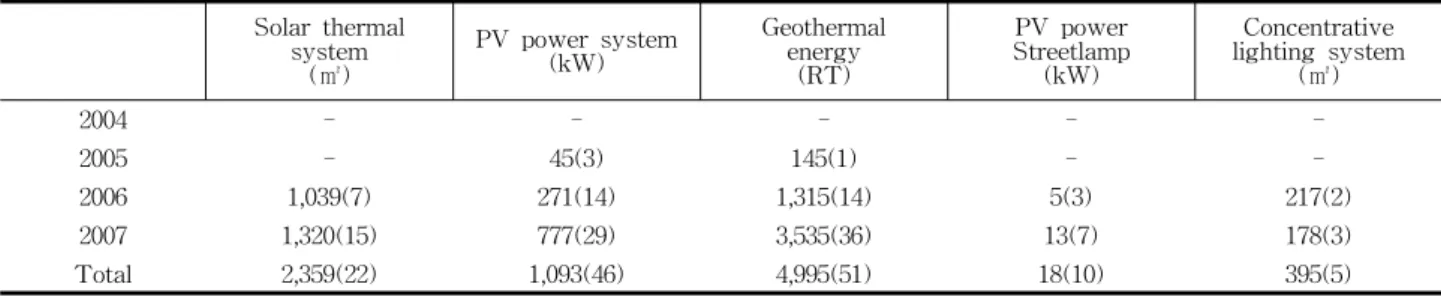
l : 혼합장 [-] k : Karman 정수(=0.4) m : 유체체적밀도 [-] a : 단위유체체적당 건물입면적 [1/m] B : 건물폭 [m] W : 도로폭 lrate : 부하율변동에 따른 성능변화계수 COP : 성적계수 Hload : 건물전열부하 [W] Hcanopy : 건물높이 [m] 1. 연구의 목적 최근 유가폭등 및 정부시책에 의해 에너지절약 및 환경친화적 건축물에 관한 관심이 고조되고 있다. 친환경 녹색성장을 위한 대표적인 에너지 원인 신재생에너지는 그 보급률이 증가하고 있는 추세이다. 현행 '신에너지 및 재생에너지개발·이용·보급촉 진법 제12조제12항'에 의한 공공기관이 신축하는 연면적 3천제곱미터 이상인 신축건축물에 대해서 는 표준건축공사비의 5%이상을 신·재생에너지설 비에 의무적으로 사용하도록 규정되어 있으며, 09.3.15일부터 증개축하는 건축물까지 확대 시행
Solar thermal system (㎡) PV power system (kW) Geothermal energy (RT) PV power Streetlamp (kW) Concentrative lighting system (㎡) 2004 - - - - -2005 - 45(3) 145(1) - -2006 1,039(7) 271(14) 1,315(14) 5(3) 217(2) 2007 1,320(15) 777(29) 3,535(36) 13(7) 178(3) Total 2,359(22) 1,093(46) 4,995(51) 18(10) 395(5)
Table 1 The present state of the spread of new & renewable energy in building1)
되고 있다. 또한 2009년 3월 서울시의 저탄 소·Green 에너지 건축물 설계 가이드라인에서는 신재생에너지 적용 의무화 규정이 강화되어, 공 동주택의 경우 표준건축공사비의 1%이상, 초고층 건물(50층, 높이 200m이상)의 경우 건물에너지 사용량의 10%이상 신·재생에너지 설계를 권장하 고 있다. 한편, 신·재생에너지의 경우 아직까지는 효율이 낮고 초기투자비가 높은 이유로 보급이 미비한 상태이다. 또한 11개의 신·재생에너지 중 건축물에 적용된 에너지원은 Table 1에 나타낸 바와 같이 태양열(광) 및 지열에 한정되고 있는 실정이다. 본 논문은 기보2),3)에서 일본 나고야시를 대상으 로 한 도심지 온열성상에 관한 연구를 토대로, 신재생에너지 적용에 따른 도시열섬현상 방지에 기여정도를 정량적으로 분석하여 건물에서의 에 너지 절약 및 친환경적인 효과를 제시하여 보급 률 확대에 기여하는 데에 목적이 있다. 2. 연구 대상 및 연구 방법 -연구대상 : 강남역과 역삼역 사이 중심지 (13.77㎢) 연구대상은 Fig. 1, 2에 나타낸 바와 같이 고층 건물이 가장 많이 있는 강남역과 역삼역 사이 중 심지를 대상으로 하였다. 이 지역은 대로 중심으로 일반상업지역이 길게 분포되어 있으며, 제2, 3종 일반주거지역으로 구 성되어있다. 본 논문에서는 도시온열성상 분석을 위해 개 량·건축-도시-토양연성계 모델(이하 AUSSSM: Architecture-Urban-Soil Simultaneous Simulation Model)4)을 사용하였다. AUSSSM의 개요를 Fig. 3에 나타내었다. AUSSSM은 도시대 기, 토양, 건물의 3개의 서브모델로 구성되어 있으며,
Fig. 1 Urban area of calculation(Gangnam, Seoul Korea).
Fig. 2 3D map in around Gangnam station
Transport equation (1) (2) (3) Turbulent diffusion coefficient
(4)
(5)
(6)
(7)
(8) Scale of turbulent length (9) (10) ≥ ∝ (11)Table 2 The basic equation of urban atmospheric sub-model
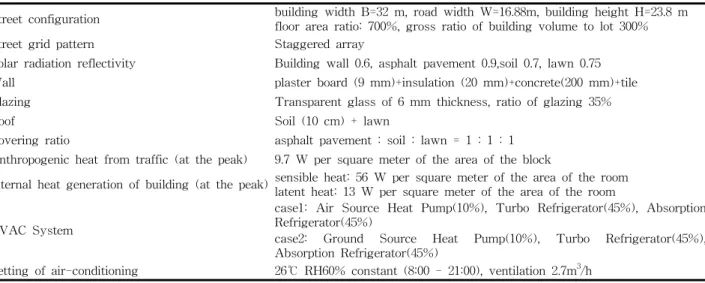
전체를 완전연성계로서 취급하고 있다. 도시고온 화요인의 정량화 다시말해, 도시고온화 억제수법 의 정량적평가를 목적으로 하는 수치해석모델이 다. AUSSSM에서는 동일형상의 직방체건물이 등 간격으로 무한히 존재하는 이상적인 도시를 가정 하여 대기측에 수직 1차원모델을 적용하고 있다. 또한 토양에 관한 서브모델 및 건축서브모델은 1차원 열전도방정식을 기본으로 하고 있다. 상정 하는 도시의 가로형상을 Fig. 4에 나타내었으며, 대기서브모델에 관한 기초식을 Table 2에 나타내 었다. 3. 수치해석 개요 Table 3에 계산조건 및 계산에 사용된 각 재료의
Street configuration building width B=32 m, road width W=16.88m, building height H=23.8 m
floor area ratio: 700%, gross ratio of building volume to lot 300%
Street grid pattern Staggered array
Solar radiation reflectivity Building wall 0.6, asphalt pavement 0.9,soil 0.7, lawn 0.75
Wall plaster board (9 mm)+insulation (20 mm)+concrete(200 mm)+tile
Glazing Transparent glass of 6 mm thickness, ratio of glazing 35%
Roof Soil (10 cm) + lawn
Covering ratio asphalt pavement : soil : lawn = 1 : 1 : 1
Anthropogenic heat from traffic (at the peak) 9.7 W per square meter of the area of the block
Internal heat generation of building (at the peak) sensible heat: 56 W per square meter of the area of the room latent heat: 13 W per square meter of the area of the room HVAC System
case1: Air Source Heat Pump(10%), Turbo Refrigerator(45%), Absorption Refrigerator(45%)
case2: Ground Source Heat Pump(10%), Turbo Refrigerator(45%),
Absorption Refrigerator(45%)
Setting of air-conditioning 26℃ RH60% constant (8:00 - 21:00), ventilation 2.7m3/h
Table 3 Basic assumptions used in the standard solution
Fig. 4 The grid pattern in the AUSSSM
열물성치를 나타내었다. HVAC System의 경우 공기열원히트펌프, 터보냉동기 및 흡수식냉동기 를 열원으로 적용한 경우를 case1로, 지열히트펌 프, 터보냉동기 및 흡수식냉동기를 열원으로 적 용한 경우를 case2로 선정하였다. 기상데이터는 서울지역 8월 평년값을 사용하였 다. 수치해석에 사용된 기상데이터를 Fig. 5에 나 타내었다. 서울 강남역 부근 GIS 데이터에 의해 평균 건 물군의 높이는 23.8m, 도로폭은 17m, 건물군 폭 은 32m로, 창면적율은 35%로 선정하였다. 실내 발열 및 환기에 대해서는 바닥면적을 기 준으로 산정하였다. 또한 도로의 교통수단에 의 한 배열은 실측조사를 기초로 하여 발열량 및 배 기가스의 발열량을 산출하였다. 4. 공조기기로부터의 배열량 계산에 사용된 공조시스템의 종류, COP 및 배 열량의 계산방법을 Table 4에 나타내었다. 공기 열원히트펌프의 경우 COP는 Fig. 6에 나타낸 바 와 같이 공기열원히트펌프의 열원온도와 COP관 계로부터 결정하였다. 현열처리비는 공기열원히 트펌프 100%, 터보냉동기 12.5%, 가스직화식 흡 수식냉동기는 가스연소에 따른 수증기 발생량을 별도로 고려하여 대기의 비습계산점에 부여하였 다. 지열히트펌프의 경우 도로공간으로의 배열량 은 없는 것으로 하였다. 5. 공조배열량 및 도시온도변화 검토 이 절에서는 신재생에너지원 중 하나인 지열히 트펌프를 에너지사용량의 10% 적용함에 따라 건 축물로부터 배출되는 공조배열의 감소에 의한
System Calculation of COP Exhausted heat rate
Air conditioning system
Air source heat pump COP=COPHPair·lrate
Q=(1+1/COP)·Hload
Ground source heat pump COP=1.20COPHPair·lrate
Turbo refrigerator COP=1.60COPHPair·lrate
Gas-fueled absorption refrigerator COP=0.38COPHPair·lrate
Table 4 COP of air conditioning system
Fig. 6 COP and heat source temperature of air source heat pump
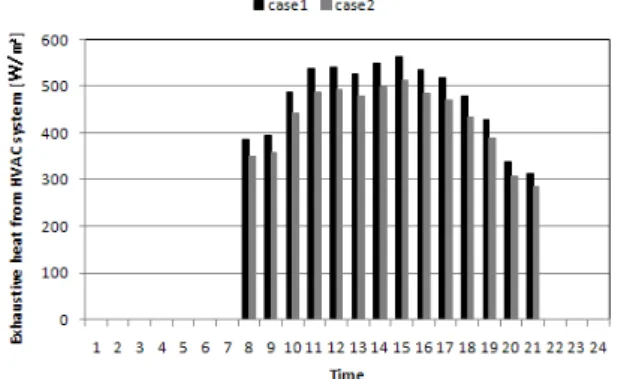
Fig. 7 Comparison of exhaustive heat from HVAC system
Fig. 8 Comparison of street space temperature
도심지 공간 내의 온열성상 및 에너지 절약효 과에 관해서 검토하고자 한다. Fig. 7에 전체 건물에너지사용량의 10%를 신재 생에너지인 지열히트펌프가 담당한 경우(case2) 와 기준조건(case1)에서의 전체 공조시스템에서 의 공조배열량의 비교를 나타내었다. case2의 경 우 case1에 비해 시각별 평균 공조배열량이 약 9%(43.04W/㎡)정도 감소되는 것으로 나타났다. case1과 case2의 최대 공조배열 배출량은 15시에 나타났으며, 각각 564.64W/㎡, 513.20W/㎡로 나 타났다. Fig. 8에 나타낸 바와 같이 신재생에너지인 지 열히트펌프를 전체 건물에너지사용량의 10%로 적용하여 공조배열량이 감소된 경우(case2), 도로 공간의 시각별 평균 온도는 기준조건(case1)에 비해 0.16℃ 낮게 나타났다. 도심온도가 가장 높 은 13시의 경우, case1과 case2의 도로공간의 온 도는 각각 32.01℃, 31.76℃로 0.25℃의 온도차가 있음을 확인 할 수 있었다. Fig. 9에 상공100m까지 높이별 온도변화를 나 타내었다. case1과 case2의 온도차는 지면에 가까 워질수록 증가하는 것으로 나타났으며, 상공 약 60m지점부터의 case1과 case의 온도차는 canopy 평균온도차의 10%이하로, 대기로의 배열 감소효과에 크게 영향을 받지 않는 것으로 나타 났다. 6. 에너지사용량 및 환경부하변화 검토 지금까지 신재생에너지 사용에 따른 공조배열 량 감소 및 도심지 온도변화에 관해 검토하였다. 본 절에서는 신재생에너지 사용에 따른 에너지절 약 및 환경부하 저감량을 정량적으로 검토하고자 한다.
Fig. 10에 case1, case2의 일일 에너지사용량 변화를 나타내었다. case2의 경우 case1에 비해 시각별 평균 1차 에너지소비량이 약 14.53W/㎡저 감되는 것으로 나타났다. case1과 case2의 일평균 에너지사용량은 각각 3208.60W/㎡, 3005.25W/㎡으로 나타났다. 일일에 너지사용량을 기준으로 연간 (냉방운전일수 88일 기준) 약 18kW/㎡의 에너지절약효과가 있는 것 으로 나타났다.
Fig. 11에 case1, case2의 연간 CO2, SOx 및
NOx배출량을 비교하였다. 신재생에너지 적용에
Fig. 9 Comparison of perpendicular distribution air temperature
Fig. 10 Comparison of primary energy consumption
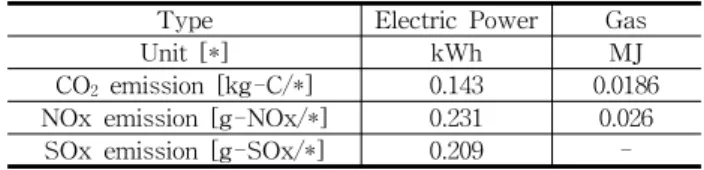
Fig. 11 Comparison of environmental load Table 7 The conversion factor of CO2, NOx,
SOx emission6)
Type Electric Power Gas
Unit [*] kWh MJ
CO2 emission [kg-C/*] 0.143 0.0186
NOx emission [g-NOx/*] 0.231 0.026
SOx emission [g-SOx/*] 0.209
-따른 CO2, SOx 및 NOx 배출 저감률은 각각
5. 결론 본 논문은 강남역 주변 시가지(13.77㎢)를 대상 으로 건물 에너지사용량의 10%를 지열원 히트펌 프로 충당할 경우, 공조배열감소 및 도시열섬현 상 방지에 기여정도를 정량적으로 분석하고 건물 에서의 에너지 절약 및 친환경적인 효과를 정량 적으로 분석하였다. 도시온열성상 분석을 위해 개량·건축-도시-토 양연성계 모델(이하 AUSSSM: Architecture-
Urban-Soil Simultaneous Simulation Model)을 사용하였다. 수치해석 결과를 간략히 정리하면 아래와 같다. (1) 신재생에너지를 전체 건물에너지사용량의 10% 적용한 경우(case2), 기준조건(case1)에 비해 도로로 배출되는 시각별 평균 공조배열량은 약 9% (43.04W/㎡)정도 감소되는 것으로 나타났으 며, 일일 최대 공조배열감소량은 51.44W/㎡로 나 타났다. (2) case2의 경우 기준조건에 비해 일일평균 도 심지 온도가 약 0.16℃ 낮게 나타났으며, 최대 0.25℃ 온도차가 있음을 확인하였다. 또한 이 온 도차는 지면에 가까워질수록 증가하였다. (3) 신재생에너지를 적용한 case2의 경우 case1 에 비해 시각별 평균 1차 에너지소비량이 약 14.53W/㎡ 감소되며, 연간 약 18kW/㎡의 에너지 절약효과가 있는 것으로 나타났다. (4) 신재생에너지 적용에 따른 온실가스배출량 을 비교한 결과, case2가 case1에 비해 CO2, SOx
및 NOx 배출양이 5.4%, 5.9% 및 12.8%감소되는 것으로 나타났다. 이상의 결과로부터 신재생에너지 사용이 도심 열섬방지에 일정부분 기여하며, 에너지절약 및 환경부하저감에도 효과가 있음을 확인하였다. 참 고 문 헌
1. Korea energy management corporation, 「New & Renewable Energy Statistics 2007」, September 2008
2. Won tug, Son et al., Study on Thermal Property in Urban Area - Part 1: Experimental Analysis for Predicting Methodology of Thermal Property In Urban Area- Korean Journal of Air-Conditioning and Refrigeration Engineering, 2004, Vol.16, No. 9, pp.984-989.
3. Won tug, Son et al., Study on Thermal Property in Urban Area - Quantitative Estimation of Heat Island in Urban area using the Simple Urban Canopy Model-, Korean Journal of Air-Conditioning and Refrigeration Engineering, 2004, Vol.16, No. 12, pp.1190-1196.
4. Aya Hagishima et al., An Organic Analysis for Quantitative Estimation of Heat Island by the Revised Architecture-Urban-Soil-Simultaneous Simulation Model, AUSSSM-Part.1 Theoretical Frame of the Model and Results of Standard Solution, Journal of SHASEJ, 2001, Vol.12, No.5, pp.1051-1057
5. Aya Hagishima et al., An Organic Analysis for Quantitative Estimation of Heat Island by the Revised Architecture-Urban-Soil-Simultaneous Simulation Model, AUSSSM-Part.2 Quantitative Analysis based on a Series of Numerical Experiments, Journal of SHASEJ, 2001, Vol.12, No.5, pp.1058-1064.
6. Won tug, Son et al., Study on Fresh Air Load Reduction System by Air-to-Earth Heat Exchange using Underground Double Floor Space, Journal of Asian Architecture and Building Engineering, May 2003, Vol.2, No. 1, pp.41-48.