Factors Influencing the Background
Parenchymal Enhancement in
Follow-Up Breast MRI after Adjuvant
Endocrine Therapy
This is an Open Access article distributed under the terms of the Creative Commons Attribution Non-Commercial License (http://creativecommons.org/licenses/ by-nc/3.0/) which permits unrestricted non-commercial use, distribution, and reproduction in any medium, provided the original work is properly cited. Received: May 12, 2015 Revised: June 10, 2015 Accepted: June 16, 2015 Correspondence to: Ji Hyun Youk, M.D. Department of Radiology, Gangnam Severance Hospital, 211, Eonju-ro, Gangnam-gu, Seoul 135-720, Korea. Tel. +82-2-2019-3510 Fax. +82-2-3462-5472 Email: [email protected]
Copyright © 2015 Korean Society of Magnetic Resonance in Medicine (KSMRM)
Original Article
Purpose: parenchymal enhancement (BPE) at follow-up breast magnetic resonance imaging To investigate factors influencing the evaluation of background (MRI) after adjuvant endocrine therapy.Materials and Methods: One hundred twelve women with breast cancer and MRI of the contralateral unaffected breast before and after endocrine therapy were identified. Two readers in consensus performed blinded side-by-side comparison of BPE (minimal, mild, moderate, and marked) before and after therapy with categorical scales. Age, body mass index, menopausal status, treatment regimen (selective estrogen receptor modulator or aromatase inhibitor), chemotherapy, follow-up duration, BPE at baseline MRI, MRI field strength before and after therapy, and recurrence were analyzed for their influences on decreased BPE.
Results: Younger age, premenopausal status, treatment with selective estrogen receptor modulator, MRI field strength, and moderate or marked baseline BPE were significantly associated with decreased BPE. In multivariate analysis, MRI field strength and baseline BPE showed a significant association.
Conclusion: MRI field strength and baseline BPE before and after therapy .were associated with decreased BPE at post-therapy, follow-up MRI.
Keywords: Breast cancer; Antineoplastic agents; Hormonal; Magnetic resonance imaging
INTRODUCTION
Considering that at least 70% of breast cancers are classified as estrogen receptor-positive breast cancers, adjuvant endocrine therapy designed to interfere with estrogen action has been a mainstay of breast cancer treatment. Tamoxifen is a selective estrogen receptor modulator (SERM) that was the first and so far most successful targeted cancer therapy. Novel and effective endocrine therapies have been developed that target estrogen synthesis, such as aromatase inhibitors (AIs) (1). Still, late recurrences remain common in estrogen receptor-positive breast cancer survivors, with rates of 2.5% per year for 20 years with Tamoxifen treatment and about 2% per year with AI for the 10 years (2, 3). Effective biomarkers of hormonal treatment response are needed, but little information is available of a host factor indicating individual Ji Hyun Youk, Eun Ju Son, Jeong-Ah Kim
Department of Radiology, Gangnam Severance Hospital, Yonsei University College of Medicine, Seoul, Korea
susceptibility to endocrine agents (3, 4).
Breast magnetic resonance imaging (MRI) is often used following breast cancer surgery to monitor for recurrent disease (5). Breast vascularity and composition are influenced by hormonal changes, which are often visible in MRI as differences in background parenchymal enhancement (BPE) and amount of fibroglandular tissue (6, 7). BPE is an imaging characteristic of normal breast parenchyma defined by the volume and intensity of normal fibroglandular breast tissue enhancement after administration of an intravenous contrast agent. Although the underlying biologic mechanism of changes and variability in BPE within and between individuals is not well understood, previous studies have demonstrated the effects of physiologic hormonal status (8-10), hormone therapy (11, 12), and anti-estrogen medications (13-16) on BPE. In particular, as a potential marker of response in the adjuvant setting, a significant association was reported between endocrine agents and visible decreases in BPE (6, 7, 14, 15). The possible effects of potential confounders such as reproductive history, body habitus, concomitant medications, or MRI-related factors have been little considered.
This study was performed to investigate factors influencing the BPE at follow-up breast MRI after adjuvant endocrine therapy.
MATERIALS AND METHODS
The present retrospective study was conducted with Institutional Review Board approval and a waiver of patient informed consent.
Patients
Between January 2007 and March 2012, 1245 breast cancer surgeries were performed at our institution. After review of medical records, 674 women who underwent adjuvant endocrine therapy after breast cancer surgery were identified. Of these, 164 women with breast cancer underwent breast MRI before and after adjuvant endocrine therapy. Among them, 122 women with breast cancer and MRI of contralateral unaffected breast before and after adjuvant endocrine therapy were included in the present study. The mean time interval from baseline MRI to the beginning of adjuvant endocrine therapy, and from the beginning of adjuvant endocrine therapy to follow-up MRI was 3.0 ± 2.7 months and 28.3 ± 17.0 months, respectively. The remaining 42 women were excluded because of
bilateral breast cancer (n = 19), distant metastasis observed before the start of endocrine therapy (n = 2), absence of MRI of the contralateral untreated breast (n = 15), or loss to follow-up (n = 6).
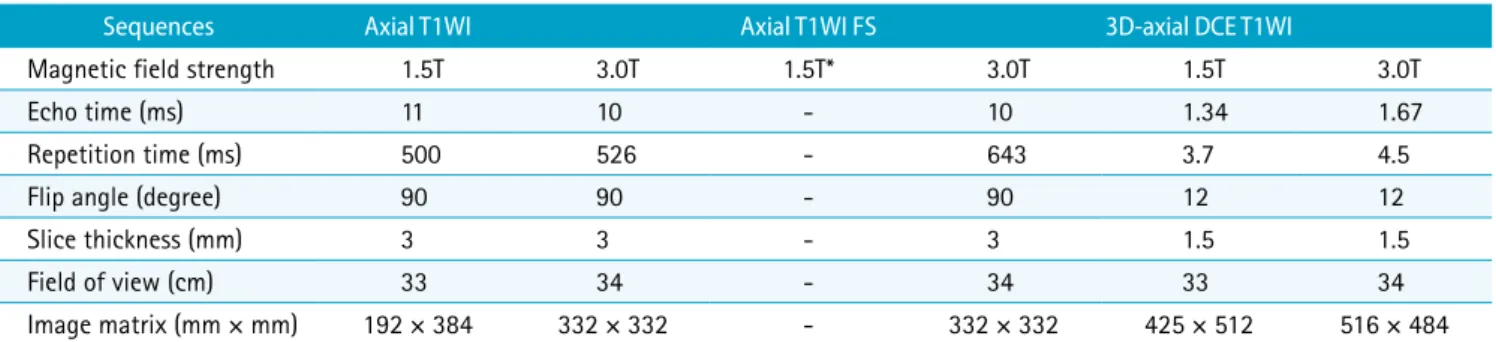
MRI Technique
Breast MRI was performed using a 1.5T (Magnetom Avanto; Siemens, Erlangen, Germany) or a 3.0T system (Intera Achieva; Philips Medical Systems, Best, the Netherlands, Discovery MR 750; GE Healthcare, Waukesha, WI, USA) with a dedicated surface breast coil. Pulse sequence parameters for pre- and post-contrast T1-weighted images are given in Table 1. Dynamic contrast-enhanced MRI examination was performed with axial imaging, with one pre-contrast and five post-contrast dynamic series performed 90, 150, 210, 270, and 330 s after bolus injection of 0.1 mmol gadopentetate dimeglumine (Magnevist; Bayer Healthcare Pharmaceuticals, Montville, NJ, USA) or gadoterate meglumine (Dotarem; Guerbet, Paris, France) per kilogram of body weight into an antecubital vein. The injection rate was 2 mL/s, followed by an 18-mL saline flush. After the examination, subtraction images were obtained by subtracting the unenhanced images from all contrast-enhanced images.
MRI Evaluation
All images were reviewed by two radiologists with 9 and 3 years’ experience in breast MRI, respectively, who were blinded as to whether the MRI examinations were performed before or after endocrine therapy. Both readers in consensus performed side-by-side blinded analyses of the individual pairs of MRI before and after endocrine therapy, to increase sensitivity by comparing images at the same time (7). In the case of 22 women who underwent follow-up MRI more than once, only their first follow-up MRI examinations were analyzed. In the unaffected breast, BPE of the entire normal breast parenchyma was visually assessed on the basis of criteria as minimal, mild, moderate, or marked using a combination of pre- and post-contrast T1-weighted and subtraction images obtained 90, 150, 210, and 270 s after contrast medium injection (7, 17).
Data and Statistical Analyses
BPE change was determined by comparing BPE before and after endocrine therapy. A decrease meant a downgrading of BPE after therapy and no decrease meant an upgrading of BPE or stable BPE after therapy. The percentage of women whose BPE decreased after endocrine therapy was
compared among phases of dynamic MRI 90, 150, 210, and 270 s after contrast medium injection using the chi-square test. The sign test was used to determine the statistical significance of the difference between the number of women whose BPE decreased and the number of women whose BPE did not decrease after endocrine therapy. The phase of dynamic MRI showing the highest percentage of decrease in BPE was determined.
Medical records were reviewed and clinical data were compiled as follows: patient age, body mass index (BMI), menopausal status, type of endocrine therapy (SERM [tamoxifen or toremifene] or AI [anastrozole or letrozole]), concomitant chemotherapy, follow-up duration from treatment to follow-up MRI, field strength of MRI system used before and after therapy (1.5T or 3.0T), and recurrence of breast cancer. The phase of dynamic MRI showing the highest percentage of decrease in BPE was used to analyze the association of decrease in BPE with those clinical variables and visually assessed BPE at baseline MRI before therapy using the chi-square test and two-sample t-test. Using variables with a statistical significance of P < 0.05 in the univariate analysis, multivariate logistic regression analysis with odds ratio estimates and 95% confidence interval was performed to determine variables independently associated with decrease in BPE after endocrine therapy. Statistical analysis was performed with IBM SPSS Statistics, version 20.0.0 software (IBM Corp., Armonk, NY, USA). Differences were considered to be statistically significant at P < 0.05.
RESULTS
All phases of dynamic MRI showed significantly higher percentage of women whose BPE decreased than women
whose BPE did not decrease after endocrine therapy (P < 0.001; Table 2). The decrease in BPE after endocrine therapy was significantly different according to the phase of dynamic MRI (P = 0.003) and the highest percentage was observed 150 s after contrast medium injection (79.5%, 25/97; Table 2). Of 122 women with breast MRI obtained 150 s after contrast medium injection, 7 (6%), 40 (33%), 49 (40%), and 26 (21%) had minimal, mild, moderate, or marked BPE, respectively, before therapy, compared with 75 (61%), 41 (34%), 6 (5%), and 0 (0%), respectively, after therapy. Among 25 women (25.8%) showing no decrease BPE after endocrine therapy, BPE increased after therapy in two (mild to moderate and minimal to mild, respectively).
Table 3 summarizes the results of a comparison among clinical and MRI variables concerning decreased BPE after therapy. Mean patient age was significantly different and women with decreased BPE were younger than those with no decrease in BPE (P = 0.002). Premenopausal women showed a significantly higher proportion of decreased BPE than postmenopausal women (88% vs. 59%, P = 0.001).
Table 1. Standard MRI Protocol
Sequences Axial T1WI Axial T1WI FS 3D-axial DCE T1WI
Magnetic field strength 1.5T 3.0T 1.5T* 3.0T 1.5T 3.0T
Echo time (ms) 11 10 - 10 1.34 1.67
Repetition time (ms) 500 526 - 643 3.7 4.5
Flip angle (degree) 90 90 - 90 12 12
Slice thickness (mm) 3 3 - 3 1.5 1.5
Field of view (cm) 33 34 - 34 33 34
Image matrix (mm × mm) 192 × 384 332 × 332 - 332 × 332 425 × 512 516 × 484
3D = three-dimensional; DCE = dynamic contrast-enhanced; FS = fat saturated; T1WI = T1-weighted image *Axial T1WI FS was not obtained in the 1.5T MR system.
Table 2. The Percentage of Women Whose BPE Decreased after Adjuvant Endocrine Therapy According to the Phase of Dynamic MRI
Phase* No decrease Decrease P value† 090 s 41.8 (51) 58.2 (71) < 0.001 150 s 20.5 (25) 79.5 (97) < 0.001 210 s 27.9 (34) 72.1 (88) < 0.001 270 s 28.7 (35) 71.3 (87) < 0.001 P value‡ 0.003
Numbers in parenthesis are numbers of cases.
* Phase of dynamic MR imaging obtained 90, 150, 210, and 270 s after contrast media injection.
† Sign test ‡ Chi-square test
Women who received SERM showed a significantly higher proportion of decreased BPE than women who received AI (88% vs. 63%, P = 0.001). However, BMI, follow-up duration from treatment to follow-up MRI, concomitant chemotherapy, and recurrence of breast cancer did not show significant differences concerning decreased BPE. Regarding breast MRI, decreased BPE after treatment was significantly higher when the MRI field strength differed before and after therapy (88% vs. 67%, P = 0.005). Decreased MRI field strength was evident for 46 (71%) women treated using SERM and 19 (29%) treated using AI. No decreased MRI field strength was noted for 8 (89%) women treated
with SERM and 1 (11%) treated with AI (P = 0.46). For all 74 women in whom MRI field strength differed before and after therapy, pretreatment study was performed with the 1.5T MR system followed by the 3.0-T MR system. For the remaining 48 women in whom field strength of MRI before and after therapy was the same, MRI examinations were performed with the 1.5T MR system in 18 women and the 3.0-T MR system in 30 women. Moderate or marked BPE at baseline MRI showed significantly higher rate of a decrease in BPE than minimal or mild BPE at baseline (94% vs. 61%, P < 0.001).
In multivariate logistic regression analysis, the difference Table 3. Clinical and MRI Variables According to Decrease in Background Parenchymal Enhancement after Adjuvant Endocrine Therapy
Variable Total BPE after endocrine therapy P value
No decrease Decrease
Age (years)* 48.64 ± 9.09 53.52 ± 10.05 47.39 ± 8.44 0.002
Body mass index (kg/m2
)* 22.82 ± 2.81 23.22 ± 3.32 22.71 ± 2.68 0.969
Follow-up duration (months)* 28.27 ± 17.00 25.84 ± 18.83 28.90 ± 16.49 0.424
Menopause Pre-menopause 88 (72.1%) 11 (12.5%) 77 (87.5%) 0.001 Post-menopause 34 (27.9%) 14 (41.2%) 20 (58.8%) Treatment regimen SERM 82 (67.2%) 10 (12.2%) 72 (87.8%) 0.001 AI 40 (32.8%) 15 (37.5%) 25 (62.5%) Neoadjuvant chemotherapy Yes 12 (9.8%) 1 (8.3%) 11 (91.7%) 0.272 No 110 (90.2%) 24 (21.8%) 86 (78.2%) Adjuvant chemotherapy Yes 56 (45.9%) 15 (26.8%) 41 (73.2%) 0.113 No 66 (54.1%) 10 (15.2%) 56 (84.8%) Recurrence Yes 7 (5.7%) 3 (42.9%) 4 (57.1%) 0.131 No 115 (94.3%) 22 (19.1%) 93 (80.9%) Evaluated breast 0.165 Right 63 (51.6%) 16 (25.4%) 47 (74.6%) Left 59 (48.4%) 9 (15.3%) 50 (84.7%)
Field strength of MRI system before and after therapy
Different 74 (60.7%) 9 (12.2%) 65 (87.8%) 0.005
Same 48 (39.3%) 16 (33.3%) 32 (66.7%)
Baseline BPE
Minimal or mild 54 (44.3%) 21 (38.9%) 33 (61.1%) < 0.001
Moderate or marked 68 (55.7%) 4 (5.9%) 64 (94.1%)
*Mean ± standard deviation.
in MRI field strength before and after therapy (P = 0.004) and moderate or marked BPE at baseline MRI (P = 0.003) were significantly associated with decreased BPE after endocrine therapy (Table 4, Figs. 1, 2).
DISCUSSION
Our results are consistent with previous studies showing that anti-estrogenic treatment is associated with decreases in BPE (6, 7, 14-16). Still, little has been known of the dynamic phase of MRI examination to assess the change in BPE. In general, BPE progresses over time during dynamic contrast-enhanced MRI (6, 18-20). In a previous study, the level of BPE showed a significant tendency to increase during dynamic contrast-enhanced MRI from the early and late dynamic phases (19). On the basis of these observations, we compared different dynamic MRI phases in terms of the percentage of women whose BPE decreased after endocrine therapy to determine the phase showing the highest percentage of decrease in BPE. Although the reduction of the average enhancements after endocrine therapy was not statistically significant at each phase (i.e., 1 min, 2 min, and 6 min) in one study (6), presently the decrease in BPE after endocrine therapy was significantly different according to the phase of dynamic MRI (P = 0.003) and the highest percentage was observed 150 s after contrast medium injection (79.5%, 25/97). The possible reason to explain this discrepancy is uncertain but differences in populations and methodologic details such as the MRI acquisition protocol
or contrast agent. Further study will be necessary using a second dynamic phase (150 s after contrast injection) in monitoring BPE after adjuvant endocrine therapy.
Regarding the visual assessment of BPE decrease, the effects of potential confounders, such as reproductive history, body habitus, concomitant medications, or MRI-related factors should be considered. For the treatment regimen, women who received SERM showed significantly Table 4. Results of Multivariate Logistic Regression Analysis of Variables Associated with Decrease in Background Parenchymal Enhancement after Adjuvant Endocrine Therapy
Variable Odds ratio* P value
Age 0.963 (0.887, 1.046) 0.377 Menopause Pre-menopause 2.176 (0.534, 8.867) 0.278 Post-menopause 1 Treatment regimen SERM 1 AI 0.950 (0.208, 4.332) 0.660
Field strength of MR system before and after therapy
Different 5.596 (1.812, 17.284) 0.003
Same 1
Baseline BPE
Minimal or mild 1 0.003
Moderate or marked 7.934 (2.029, 31.030)
*Numbers in parentheses are 95% confidence intervals.
AI = aromatase inhibitor; BPE = background parenchymal enhancement; SERM = selective estrogen receptor modulator
Fig. 1. Axial contrast-enhanced T1-weighted subtraction MR images obtained 150 s after con-trast injection in a 49-year-old premenopausal woman treated for contralateral invasive ductal carcinoma. (a) Baseline image before treatment with tamoxifen obtained with 1.5T MRI system shows moderate BPE. (b) After 22 months from baseline study, follow-up 3.0T MR image during treatment with tamoxifen shows a decrease to minimal background parenchymal enhancement.
higher rate of a decrease in BPE than women who received AI (88% vs. 63%, P = 0.001), but the difference in anti-estrogenic agent was not independently associated with BPE decrease in multivariate analysis. Tamoxifen is still the endocrine therapy of choice in premenopausal patients. AI is indicated only for postmenopausal and should be avoided in women whose menopausal status is not established (21). It stands to reason that the treatment regimen is closely associated with menopausal status as well as patient age. In this context, menopausal status and age were not independently associated with BPE decrease in multivariate analysis, as treatment regimen, although the rate of a decrease in BPE was significantly higher in younger and premenopausal women (Table 3).
Interestingly, MRI-related factors including the difference in MRI field strength before and after therapy and BPE at baseline MRI were independently associated with the decrease in BPE after endocrine therapy. The change from 1.5T MRI at baseline to 3.0T MRI in the follow-up was more likely to show a decrease in BPE compared to both MRI studies done at 1.5T or 3.0T. Although the reasons for this were not completely understood and investigated in the present study, one of them might be the improved image quality at 3.0T MRI system. The main improvement in using a higher field strength magnet is the increase in the signal-to-noise ratio, theoretically, doubling from 1.5T to 3.0T, which can be exploited to image at a higher spatial resolution and translated into the improved image quality by improved morphological details aiding in characterization of normal physiological BPE (22, 23). Although higher
magnetic field strengths have been associated with physical effects that are not advantageous to obtain high image quality including stronger susceptibility effects, increased T1 relaxation times, radiofrequency inhomogeneity, and accentuation of certain MR imaging artifacts, previous studies reported that image quality was better at 3.0T than at 1.5T (24-26). In addition, high contrast-to-noise ratio is affected by field strength effects on T1 relaxation times of breast tissue and gadolinium. At 3.0T, the T1 relaxation time is increased for both fat and glandular tissue in the breast by approximately 21% and 17%, respectively, but T1 relaxation of gadolinium is increased to a much lesser extent (27). This suggests that the relative difference in signal intensity between enhancing and nonenhancing tissues would be increased at 3.0T, making enhancing tissue more conspicuous (23). However, it is currently unclear how the T1 relaxation time effect affects BPE in terms of high contrast-to-noise ratio at 3.0T and why the change from 1.5T at baseline to 3.0T in the follow-up was more likely to show a decrease in BPE compared to both MR studies done at 3.0T in our study. Further investigation of qualitative and quantitative comparison between 1.5T and 3.0T MRI is needed to prove these speculations.
Regarding BPE status at baseline MRI, women with moderate or marked BPE were significantly associated with the decrease in BPE after endocrine therapy than those with minimal or mild BPE. In a previous study for the effect of AI on BPE (7), a similar result was reported; of women with moderate or marked BPE, 71% (20 of 28) of those treated with anastrozole and 80% (8 of 10) of those treated with Fig. 2. Axial contrast-enhanced T1-weighted subtraction MRI obtained 150 s after contrast injection in a 57-year-old post-menopausal woman treated for contralateral invasive ductal carcinoma. (a) Baseline image before treatment with letrozole obtained with 3.0-T MRI system shows mild background parenchymal enhancement. (b) After 22 month from baseline study, follow-up 3.0-T MR image during treatment with tamoxifen shows a mild BPE or no decrease in BPE.
letrozole had a decrease in BPE, whereas 27% (17 of 64) and 44% (7 of 16) of women with mild baseline BPE treated with anastrozole and letrozole had a decrease, respectively. The suggested reason for this observation was that among many postmenopausal women who already had a low degree of enhancement, substantial further decreases in BPE could not be achieved. However, presently there was an independent association of baseline BPE with the decrease in BPE after therapy, irrespective of treatment regimen and menopausal status. Considering that both studies assessed BPE using a four-level categorical scale on the basis of the side-by-side comparison, the difference in visually assessed BPE would seem to be more significant when the baseline BPE was moderate or marked than minimal or mild, and vice versa. To clarify this result, quantitative measures to assess BPE is required. However, no validated and reliable quantitative method for measuring BPE was available. Although some quantitative methods for measuring overall BPE are currently in the early stages of development, they were not widely available at this time (15).
This study has some limitations. Owing to its retrospective nature, there might have been unavoidable selection bias, because only women who underwent breast MRI both before and after adjuvant endocrine therapy were included. Long-term follow-up data for treatment response or recurrence were limited. Further prospective studies will be necessary to evaluate the role of BPE as a potential marker of response in the adjuvant setting and its associated factors. The use of different MRI systems in magnetic field strength or vendors can be a limitation. It is difficult to make a direct comparison, as the sequence parameters and coils for 1.5T and 3.0T are different. For 3.0T MRI, two different systems were used randomly, but the same protocol was applied. In addition, different types of contrast agent were used. It may play a major role in BPE, but was not evaluated in the present study.
In conclusion, the different MRI field strength before and after therapy and moderate or marked BPE at baseline MRI before therapy were associated with the decrease in BPE at follow-up MRI after adjuvant endocrine therapy.
REFERENCES
1. Musgrove EA, Sutherland RL. Biological determinants of endocrine resistance in breast cancer. Nat Rev Cancer 2009;9:631-643
2. Early Breast Cancer Trialists' Collaborative Group (EBCTCG), Davies C, Godwin J, et al. Relevance of breast cancer
hormone receptors and other factors to the efficacy of adjuvant tamoxifen: patient-level meta-analysis of randomised trials. Lancet 2011;378:771-784
3. Cuzick J. Breast density predicts endocrine treatment outcome in the adjuvant setting. Breast Cancer Res 2012;14:109
4. Kim J, Han W, Moon HG, et al. Breast density change as a predictive surrogate for response to adjuvant endocrine therapy in hormone receptor positive breast cancer. Breast Cancer Res 2012;14:R102
5. Brennan S, Liberman L, Dershaw DD, Morris E. Breast MRI screening of women with a personal history of breast cancer. AJR Am J Roentgenol 2010;195:510-516
6. Mousa NA, Eiada R, Crystal P, Nayot D, Casper RF. The effect of acute aromatase inhibition on breast parenchymal enhancement in magnetic resonance imaging: a prospective pilot clinical trial. Menopause 2012;19:420-425
7. King V, Goldfarb SB, Brooks JD, et al. Effect of aromatase inhibitors on background parenchymal enhancement and amount of fibroglandular tissue at breast MR imaging. Radiology 2012;264:670-678
8. Kuhl CK, Bieling HB, Gieseke J, et al. Healthy premenopausal breast parenchyma in dynamic contrast-enhanced MR imaging of the breast: normal contrast medium enhancement and cyclical-phase dependency. Radiology 1997;203:137-144
9. Muller-Schimpfle M, Ohmenhauser K, Stoll P, Dietz K, Claussen CD. Menstrual cycle and age: influence on parenchymal contrast medium enhancement in MR imaging of the breast. Radiology 1997;203:145-149 10. Chen JH, Yu H, Lin M, Mehta RS, Su MY. Background
parenchymal enhancement in the contralateral normal breast of patients undergoing neoadjuvant chemotherapy measured by DCE-MRI. Magn Reson Imaging 2013;31: 1465-1471
11. Pfleiderer SO, Sachse S, Sauner D, et al. Changes in magnetic resonance mammography due to hormone replacement therapy. Breast Cancer Res 2004;6:R232-238 12. Delille JP, Slanetz PJ, Yeh ED, Kopans DB, Halpern EF,
Garrido L. Hormone replacement therapy in postmenopausal women: breast tissue perfusion determined with MR imaging--initial observations. Radiology 2005;235:36-41 13. Eng-Wong J, Orzano-Birgani J, Chow CK, et al. Effect of
raloxifene on mammographic density and breast magnetic resonance imaging in premenopausal women at increased risk for breast cancer. Cancer Epidemiol Biomarkers Prev 2008;17:1696-1701
14. Oksa S, Parkkola R, Luukkaala T, Maenpaa J. Breast magnetic resonance imaging findings in women treated
with toremifene for premenstrual mastalgia. Acta Radiol 2009;50:984-989
15. King V, Kaplan J, Pike MC, et al. Impact of tamoxifen on amount of fibroglandular tissue, background parenchymal enhancement, and cysts on breast magnetic resonance imaging. Breast J 2012;18:527-534
16. Schrading S, Schild H, Kuhr M, Kuhl C. Effects of tamoxifen and aromatase inhibitors on breast tissue enhancement in dynamic contrast-enhanced breast MR imaging: a longitudinal intraindividual cohort study. Radiology 2014;271:45-55
17. Morris E, Comstock CE, Lee CH, et al. ACR BI-RADS magnetic resonance imaging. In ACR BI-RADS atlas, breast imaging reporting and data system. Reston, VA: American College of Radiology, 2013
18. Morris EA. Diagnostic breast MR imaging: current status and future directions. Radiol Clin North Am 2007;45:863-880, vii
19. Uematsu T, Kasami M, Watanabe J. Background enhancement of mammary glandular tissue on breast dynamic MRI: imaging features and effect on assessment of breast cancer extent. Breast Cancer 2012;19:259-265 20. Cubuk R, Tasali N, Narin B, Keskiner F, Celik L, Guney S.
Correlation between breast density in mammography and background enhancement in MR mammography. Radiol Med 2010;115:434-441
21. Harris JR, Lippman ME, Morrow M, Osborne CK. Disease of the breast. Philadelphia, PA: Lippincott Williams & Wilkins, 2010
22. Raza S. Implementing a breast MR imaging program: all things considered. Magn Reson Imaging Clin N Am 2010;18:187-198, vii
23. Rahbar H, Partridge SC, DeMartini WB, Thursten B, Lehman CD. Clinical and technical considerations for high quality breast MRI at 3 Tesla. J Magn Reson Imaging 2013;37:778-790
24. Chatterji M, Mercado CL, Moy L. Optimizing 1.5-Tesla and 3-Tesla dynamic contrast-enhanced magnetic resonance imaging of the breasts. Magn Reson Imaging Clin N Am 2010;18:207-224, viii
25. Kuhl CK, Jost P, Morakkabati N, Zivanovic O, Schild HH, Gieseke J. Contrast-enhanced MR imaging of the breast at 3.0 and 1.5 T in the same patients: initial experience. Radiology 2006;239:666-676
26. Pinker K, Grabner G, Bogner W, et al. A combined high temporal and high spatial resolution 3 Tesla MR imaging protocol for the assessment of breast lesions: initial results. Invest Radiol 2009;44:553-558
27. Rakow-Penner R, Daniel B, Yu H, Sawyer-Glover A, Glover GH. Relaxation times of breast tissue at 1.5T and 3T measured using IDEAL. J Magn Reson Imaging 2006;23:87-91